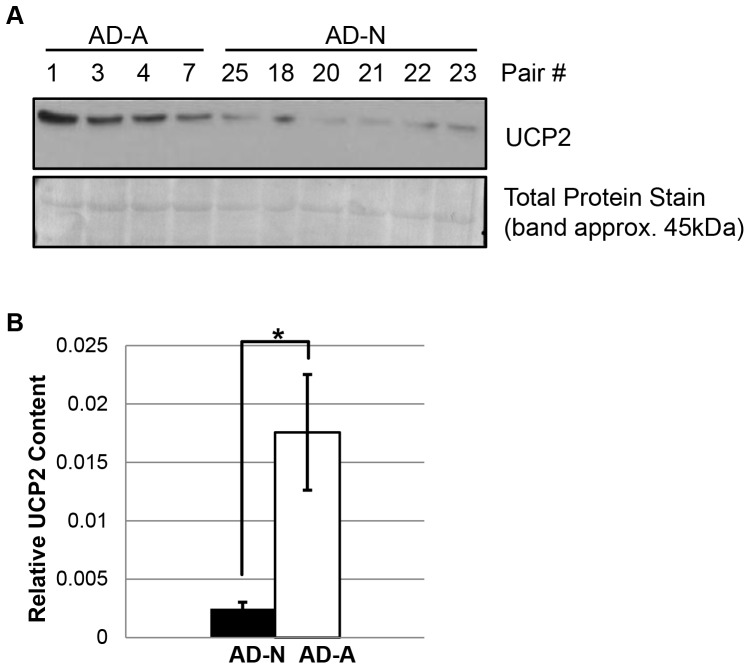
Figure 7. UCP2 content is higher in the AD-A LCL subgroup.
(A) Immunoblot analysis of UCP2. Cell lysates from AD-N LCLs (N = 4) and AD-A LCLs (N = 6) were analyzed for UCP2 content. A total protein stain served as the loading control. The molecular weight of UCP2 was confirmed using molecular mass markers. (B) Quantitation of band densities demonstrates the significantly higher UCP2 content in AD-A LCLs as compared to AD-N LCLs. *p<0.01.

