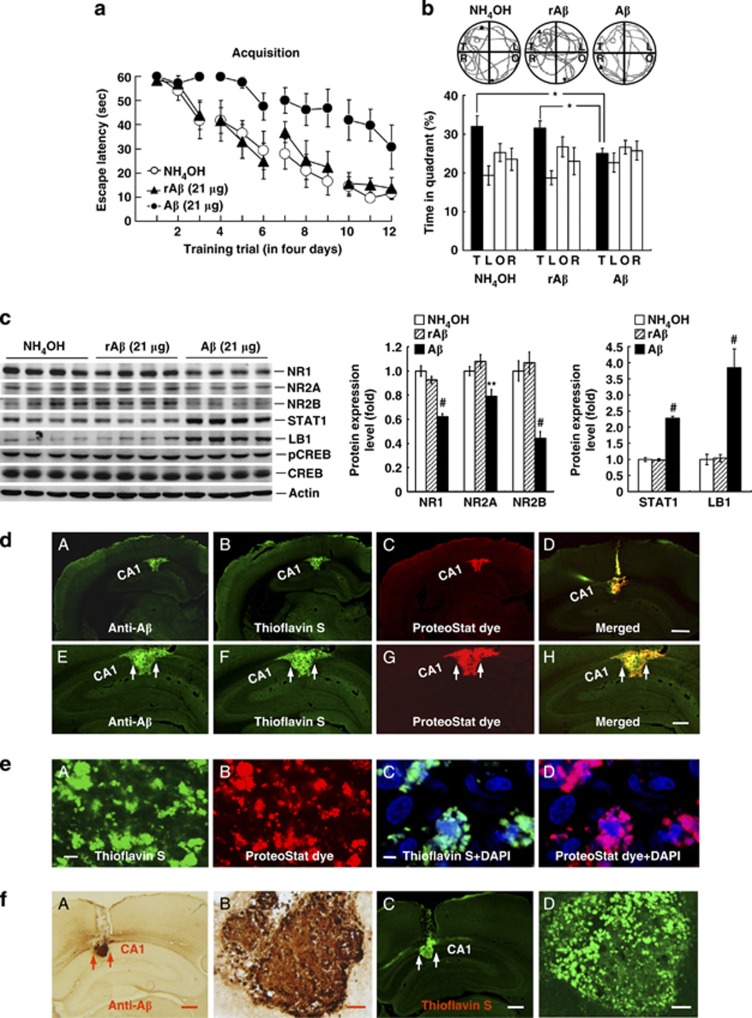
Figure 4.
Aβ impairs spatial learning and memory, decreases the expression of NR1, NR2A and NR2B, but increases the expression of signal transducer and activator of transcription-1 (STAT1) and laminin β1 (LB1). Rats received 21 μg Aβ, rAβ, or NH4OH injection and were subject to (a) water maze learning and (b) probe trial test. (c) Gel pattern and the analysis of protein expression of NR1, NR2A, NR2B, STAT1, and LB1 after the probe trial test. Data are mean±SEM. *P<0.05, **P<0.01, and #P<0.001. (d) Immunohistochemistry (IHC) showing ‘A' Aβ staining using anti-Aβ antibody, ‘B' Aβ aggregation with thioflavin S staining, and ‘C' amyloid plaque with ProteoStat dye staining in the CA1 area 14 days after Aβ injection. Consecutive photomicrographs were taken and merged for (d (A–D)). Photomicrographs for A–C taken at a higher magnification are shown in (d (E–G)) in order and the merged image is shown in (d (H)). (d (D)) shows the merged image of an adjacent tissue section showing need track at a lower magnification. Scale bar equals 800 μm for the upper panels and scale bar equals 400 μm for the lower panels. (e) Photomicrographs taken at a higher magnification show distinct populations of ‘A' Aβ aggregates and ‘B' amyloid plaques. Scale bar equals 10 μm. Further illustrations show the relationship between ‘C' Aβ aggregation and DAPI as well as ‘D' amyloid plaque and DAPI. Scale bar equals 2.5 μm. (f) 3,3′-diaminobenzidine (DAB) staining shows ‘A' Aβ staining using anti-Aβ antibody. Photomicrograph at a higher magnification is shown in ‘B'. IHC shows ‘C' thioflavin S staining of an adjacent tissue section. Photomicrograph taken at a higher magnification is shown in ‘D'. Scale bars equal 400 μm for (f (A and C)) and scale bars equal 50 μm for (f (B and D)). Anti-Aβ staining overlaps with thioflavin S staining in photomicrographs taken at both magnifications.

