

Abstract
Two-day-old (P2) rat pups were subjected to either a global hypoxia or to electrocoagulation of the right carotid artery followed by 2.5 hrs hypoxia. Cellular and regional injury in the cerebellum (CB) was studied at 1, 2 and 19 days using immunohistology. Following hypoxia and hypoxia-ischemia, all neuronal populations of the CB were damaged in a subset of Purkinje cells. The decrease in the number of interneurons, as well as the thickness of molecular and granular layers was significant following hypoxia. Diffuse white matter damage, with loss of preoligodendrocytes was more severe following hypoxia than hypoxia-ischemia. Global hypoxia in the rat at P2 produces extensive damage to many cell types in different areas of the CB. The addition of unilateral forebrain ischemia does not increase the severity of these changes. Our data provide insight into the mechanisms of the changes observed in the CB of premature newborns.
Keywords: cerebellum, hypoxia, ischemia, neuronal death, Purkinje cells, granule cells, white matter, development
INTRODUCTION
Premature birth is a significant risk factor for adverse motor, coordination, cognitive, and behavioral outcomes in survivors (Saigal and Doyle, 2008). The prevailing brain pathology in very preterm infants is diffuse white matter injury in the cerebral hemispheres (Volpe, 2003). In addition, a consistent pattern of regionally specific long-term volume reduction and abnormalities in cortical and deep grey matter structures in ex–preterm infants is now recognized (Limperopoulos et al., 2005c). Injury and impaired development of the cerebellum, involving both white matter and grey matter components as a complication of premature birth, are also becoming increasingly recognized with advanced neonatal brain imaging (Messerschmidt et al., 2005; Nosarti et al., 2008; Parker et al., 2008; Pierson et al., 2007).
Survivors of preterm birth demonstrate a constellation of long-term neurodevelopmental deficits, many of which are potentially related to cerebellar injury, including impaired motor functions such as hypotonia, fine motor incoordination, ataxia, and impaired motor sequencing (Goyen et al., 1998; Powls et al., 1995). Cerebellar injury has also been implicated in cognitive, social, and behavioral dysfunction among older patients (Berquin et al., 1998; Levisohn et al., 2000) and may contribute to the long-term cognitive, language, and behavioral dysfunction seen among 25% to 50% formerly preterm infants (Allin et al., 2001; Limperopoulos et al., 2007; Limperopoulos et al., 2005a; Messerschmidt et al., 2008).
Cerebellar atrophy may occur as a result of a primary acquired injury, such as hemorrhage or infarction (Mercuri et al., 1997) currently detected, mostly in very preterm infants (Volpe, 2009). In the largest reported MRI series of very preterm and preterm, a decrease in cerebellar volume at term equivalent age correlated with decreasing gestational age (Limperopoulos et al., 2005b). In the pathology of preterm infants, neuronal loss detected in the cerebellum and related brain stem nuclei was essentially confined to the infants with periventricular leukomalacia (25 to 30% of infants) (Pierson et al., 2007). Primary impaired cerebellar development of a different origins, such as hypoxia-ischemia, has most often consisted of bilateral, generally symmetric deficits in the cerebellar hemispheric volumes (Volpe, 2009). On the other hand, a recent MRI study suggested that unilateral injury confined to the preterm cerebral hemisphere was associated with a significantly decreased volume of the contralateral cerebellar hemisphere. All these data suggest that two main mechanisms might induce the impaired cerebellar development of the premature brain: either a direct effect on the development of the cerebellar cortex or remote effects operating via trophic trans-synaptic interaction between the telencephalic leukomalacia and the developing cerebellum.
To address this question we developed a model of the preterm human in neonatal rat pups. We chose the postnatal day 2 (P2) which is comparable to 28 weeks of gestation in the human, when the cerebellar cortex is the most vulnerable to insult (Volpe, 2009). At this age the second wave of neuronal cerebellar proliferation plays a key role in the organization of the cerebellar cortex. We hypothesized that at this age, global hypoxia alone would be sufficient to induce morphological damage to the cerebellar cortex compared to those sustaining a forebrain lesion induced by hypoxia-ischemia at the same age. To test this hypothesis, the morphological and cytological neuronal changes of the cerebellar cortex, the glial reaction and white matter damage were analyzed at P21 following the hypoxic (H) or hypoxic-ischemic (HI) injuries performed at P2.
MATERIALS AND METHODS
Hypoxia and hypoxia-ischemia in P2 rats
All animal research was approved by the University of California San Francisco Institutional Animal Care and Use Committee and was performed in accordance with the Guide for the Care and Use of Laboratory Animals (US Department of Health and Human Services, Publication Number 85–23, 1985).
Rat pups were assigned to either experimental (n = 37) or sham (n = 9) groups, and pups were sacrificed at P3, P4, and P21. The Vannucci (Rice et al., 1981) neonatal adaptation of the Levine procedure (Levine, 1960) was used to induce brain injury in 2-day-old (P2) Sprague–Dawley rat pups of either sex, weighing between 6 and 8 g (Harlan Sprague–Dawley, Indianapolis, IN). Experimental rats (hypoxic-ischemic group, HI, n=27) were anesthetized with isoflurane (4% induction for 5 min, 2% maintenance for 5 min) and the right common carotid artery isolated from the nerve and vein and electrocoagulated (sham group had surgical manipulation without coagulation). Animals were returned to their dam for 1-h recovery. Subsequently, pups receiving hypoxia were placed in 5.5% oxygen in chambers floating in a 37°C water bath for 2.5 h. One pup from each litter was monitored with a skin surface temperature probe to ensure consistency between litters and that the animals did not overheat. The body surface temperature was kept constant at 34°C (normal P2 core temperature, 33–35°C) for 2.5 h. They were returned to their dams after removal from the chamber.
Ten rat pups received hypoxic treatment alone (H group, n=10). They were placed in 5.5% oxygen for 2.5 h in a chamber floating in a 37°C water bath, with the same procedure.
Tissue preparation
At 24h, 48h and 19 days (P21) after hypoxia or hypoxia-ischemia (time 0), rat pups were anesthetized with pentobarbital and received transcardiac perfusion with 4% paraformaldehyde (PFA) in 0.1M PBS for 30 min at 4 ml/min. The forebrain and cerebellum were removed within 5 min, postfixed in 4% paraformaldehyde overnight, cryoprotected in 30% sucrose, and frozen in isopentane (30°C). Serial cerebellar coronal cryostat sections (12 μm) were stained with cresyl violet (CV) staining and immunocytochemistry.
Following hypoxia or hypoxia-ischemia the extent of their forebrain injury was characterized. Twenty one forebrains were scored at P21, in a blinded fashion, for degree of damage using cresyl violet stained sections. Every 4th section of the forebrain was examined, and 8 brain regions were scored: the frontal, parietal, and occipital corticies; the hippocampal formation (CA1, CA2, CA3, dentate gyrus), and striatum (caudate putamen). The sham operated brain sections served as a reference for uninjured tissue. Each region was given a rating from 0–3, 0= no detectable neuronal cell loss; 1=small focal areas of neuronal cell loss; 2=columnar damage in the cortex involving predominately layers II–IV; and 3=cystic infarction and gliosis. The score for each region was then added for a final score ranging from 0–24, thus defining the degree of forebrain damage. Even though all HI rats received the same treatment as indicated above, differences in the extent of injury were seen due to variability of the model: mild (score 1–8), moderate (score 9–16), and severe (score 17–24) groups.
Immunofluorescence
Sections were thawed and immunostained as previously described (Dingman et al., 2006). Double-labeling for Pax6 - calbindin-28kd, AP2Beta - glial fibrillary acidic protein (GFAP), and olig2 - myelin basic protein (MBP) was performed at P21 whereas calbindin- Iba-1, for cleaved caspase-3 - calbindin were performed at P3, P4 and P21 (Table 1). Non-specific sites were blocked with 0.1 M PBS containing 5% normal horse serum for 1h on all sections. This primary incubation was performed in blocking solution overnight at 4°C at the dilutions indicated in Table 1. Secondary antibodies raised in the appropriate target species and conjugated to Cy2 or Cy3 dyes (1:100) were applied for two hours at room temperature. Three successive washes in 0.1 M PBS were made between each step. Slides were incubated in bis-benzamide (0.001%) for visualization of nuclei. For controls, the primary antibody was omitted from the incubation solution. Control and experimental sections were stained at the same time to avoid procedural variation. Sections were imaged with a Zeiss Axiovert 100 fluorescent microscope equipped with OpenLab Software (Improvision).
Table 1.
Primary antibodies
| Antibodies | Host species | Labelled structures | Compagny | Dilution |
|---|---|---|---|---|
| Anti-Calbindin | Mouse | Purkinje cell | Sigma, Oakville ON | 1/1000 |
| Anti-Pax6 | Rabbit | Granule cell | Chemicon | 1/1000 |
| Anti-AP2β | Rabbit | Interneuron | Santa Cruz | 1/100 |
| Anti-MBP | Mouse | Myelin | Covance | 1/2000 |
| Anti-GFAP | Mouse | Astrocyte | Chemicon | 1/500 |
| Anti-Olig2 | Rabbit | Preoligodendro cyte | Gift Dr C.Stiles | 1/10000 |
| Anti-Iba1 | Rabbit | Microglia | Wako, Chemicals | 1/1000 |
| Activated caspase 3 | Rabbit | Apoptosis | Cell Signaling | 1/200 |
Measurements of the internal granular and molecular layers
The thickness of the internal granular layer (IGL) and molecular layer (ML) was measured with a 10X objective on cresyl violet stained sections by using CapturePro software. Two regions of the cerebellum were chosen for assessment: in the gyrus of lobules 3 and 4 (L.3, 4), corresponding to the anterior cerebellum and in the gyrus of lobules 8 and 9 (L.8, 9) to the posterior cerebellum. For each region, measurements were made of randomly selected points on the surface of the anterior and posterior vermis (four sections for each brain, 320 measurements in total), (Fig 1A, B black boxes).
Figure 1.

Schematic of coronal sections from the anterior (A) and posterior levels of the cerebellum (B). Boxes indicated the regions observed for immunochemistry and quantitative assessment (lobules (L) 3-4 and 8-9), from Paxinos G and Watson C, The Rat Brain in stereotaxic coordinates, 5th edition.
(C) Measurement of the entire volume of cerebellum by stereologic analysis at P21 with no significant difference between all groups, hypoxic (Hypo) and hypoxic-ischemic animals (HI) Nissl stain section of the white matter (WM), internal granular layer (IGL), molecular layer (ML) and external granular layer (EGL) in sham animals at P21 (of L 3-4) (D). Pc: Purkinje cell layer. Scale bar: 50 μm.
Cell quantification
Four alternate sections of vermis and cerebellar hemispheres in the gyrus of the lobules 3,4 and 8,9 per animal (n=21 animals per HI injury and H groups) were used for quantification at P21. Using SPOT capture software, a 1000-μm contour line was drawn along the purkinje cell layer on both sides of the fissure or gyrus for a total 2000 μm length sampling area. The number of purkinje cells (Pc) for each region (L.3-4 and 8-9) was calculated as the average number of Pc counted in each region 1 and 2 with a 20X objective on CV stained slides. Two criteria were used in cell counts: 1) the cell body was well defined, and 2) had the general characteristic morphology of a Pc (i.e. round cell body approximately 25–30 μm in diameter located between the granule cell and molecular layers).
The total numbers of AP2beta expressing interneurons and GFAP expressing astrocytes in the molecular layer were quantified in a field with dimensions of 0.5 mm2, with a 20X objective. The total numbers of olig2 expressing oligodendrocytes in lobules 3–4 and 8–9 of the cerebellum were quantified in a field with dimensions of 0.25 mm2, with a 40X objective.
Quantification of myelination
The optical density (OD) of MBP immunoreactive fibers was measured in the vermis and cerebellum of both hemispheres of coronal sections. OD was measured with a 40X objective and image-analysis software (ImageJ, http://rsb.info.nih.gov/ij/) that read OD as gray levels, calculated the area and pixel value statistics of user-defined selections, and generated density histograms. Nonspecific background densities were measured in the deep cerebellar nuclei, a region devoid of MBP immunostaining and were subtracted from pathway values. OD was analyzed in 5 animals per group (H, HI, sham) from 3 separate experiments and in at least 4 sections per cerebellum, in lobules 3–4 and 8–9. All the quantitative analyses were conducted in a blinded manner.
Volumetric analyses by stereology
For volumetric analysis of the entire cerebellum, serial cresyl violet stained sections were used. Using systematic random sampling, a series representing every 12th section was selected, stained, and analyzed. Volumetric quantifications were performed using a Nikon Eclipse E600 photomicroscope equipped with a high-resolution CCD camera, a motorized XYZ axis computer-controlled stage, and Neurolucida and Neuroexplorer morphometry software (Micro-BrightField, Inc., Colchester, Vt., USA). The cross-sectional areas of the region of interest (ROI) in each section was traced at low power using a 2X/4X lens and the volume of the ROI was calculated according to the Cavalieri principle (Regeur and Pakkenberg, 1989). By using this sampling strategy, approximately 20 histological sections per cerebellum were analyzed for volume measurement. Quantification was conducted by an examiner masked to treatment group.
Data Analysis
For volumetric analysis, one-way analysis of variance (ANOVA) was performed with Student-Newman-Keuls post-hoc test for multiple comparisons. The number of Purkinje cells, interneurons, preoligodendrocytes, astrocytes, and the thickness of the IGL and ML were compared using nonparametric Kruskal-Wallis analysis of variance, followed by individual Mann-Whitney rank tests. P values less than or equal to 0.05 were considered significant. All statistical analyses were performed using Graph-Pad Prism version 4.03 for Windows.
RESULTS
Degree of forebrain injury
Although animals received the same experimental procedure (H or HI) the extent of forebrain injury varied remarkably in the HI group. The median score was 2 for hypoxia alone (n=6) which was detected for both cerebral hemispheres (Fig 2). Following mild HI (mi-HI) (n=5) the median score was 5 in the ipsilateral hemisphere to electrocoagulation and 0 in the contralateral hemisphere. Moderate hypoxia-ischemia (mo-HI) had a median score of 12, range 9–16 (n=5), and severe hypoxia-ischemia (se-HI) had a median score of 21, range 17–24 (n=5) (Fig 2).
Figure 2.

Evaluation of the degree of forebrain injury at P21in right (RH) and left (LH) hemispheres of hypoxic (Hypo) and hypoxic-ischemic (HI) animals: (mi-HI), moderate, (mo-HI), severe (se-HI). Note the same median histological score in both cerebral hemispheres in Hypo animals, and the increasing histological score in RH in HI animals (from 5–21) showing the variability in the model.
Male and female rats were evenly distributed among the 5 groups, with no statistically significant difference between males and females in any of the analyses (data not shown).
Global Morphological features of the cerebellar cortex
No significant differences were found in the volume of the entire cerebellum (vermis and hemispheres) analyzed by stereology at P21 on cresyl violet stained sections (Fig. 1C). However, a smaller volume of the entire cerebellum was detected in H animals versus the sham animals and the cerebellar volume following hypoxia was slightly reduced compared to that following mild-hypoxia-ischemia.
At P21 (Fig. 1C), the thickness of the molecular layer and of the internal granular cell layer (IGL) were greatly decreased in H and HI animals compared to the sham animals (Fig. 3A–D). In the L3, 4 of the vermis, the decrease in both layers was significantly higher following hypoxia compared to hypoxia-ischemia (p<0.001) (Fig. 3A, C). It was the reverse in lobules 8, 9, where hypoxia-ischemia induced a higher decrease in thickness of both layers than following hypoxia (Fig. 3B, D). This decrease was significant for the molecular layer (p<0.01).
Figure 3.

Assessments of thickness of the molecular layer (ML) in the lobules 3-4 (L 3-4; anterior vermis), (A) and lobules 8-9 (L 8-9; posterior vermis), (B) of the internal granular layer (IGL) in the L 3-4 (C) and L 8-9 (D) vermis of sham, hypoxic (Hypo) and hypoxic-ischemic (HI) animals.
Bar represents mean density of positive cells ± s.e.m. Asterisks indicate significant difference compared to sham; *** p< 0.001, ** p< 0.01, * p< 0.05. Hash sign indicate significant difference between H compared to HI animals; ### p< 0.001, ## p< 0.01, # p< 0.05
Differential injury of neuronal cerebellar populations following hypoxia versus hypoxia-ischemia
On Nissl sections, the main abnormality was detected in the Purkinje cell layer in the vermis and the cerebellar hemispheres (Fig. 4A–F). The affected Purkinje cells (Pc) had a lighter stained cytoplasm and condensed nuclei in both H and HI animals (Fig 4D, E, F) compared to Purkinje cells in the control animals which had a regular nucleus and well-delineated cytoplasm (Fig. 4B, C). Calbindin positive Pc showed an obvious cell loss following the sagittal stripe organization described on coronal sections in the cerebellar cortex: one stripe could displayed few Purkinje pericarya whereas the contiguous stripes displayed more numerous Pc pericarya (Fig 4A, E). There was no evidence that damage occurred preferentially in the left or right hemisphere or in the vermis.
Figure 4.

Nissl staining in P21 Sham (A–C), hypoxic (Hypo) (D), and severe hypoxic-ischemic (HI) animals (E–F). Boxes in A indicated the enlargement showed in B. Note the clear staining of Purkinje cells in anterior region of the cerebellum in control (C), compared to the abnormal dense staining following hypoxia (D) and severe HI (E–F). Short arrows point to injured Purkinje cells (Pc) in D, F and long arrows the stripe in Sham (A) and severe HI (E). Arrowheads in E showed the high density of Pc in the upper stripe whereas the lower contiguous stripe showed only few Pc.
Scale bars = A: 300 μm, B, E: 100μm, C, D, F: 40μm.
Double-labeling Calbindin (green) - Pax6 (red) (G, J, M) and GFAP (green) - AP2β (red), (H, I, K, L, N, O) in Sham (G, H, I), severe HI (J, K, L) and H (M, N, O) sections. Boxes in H, K, N are enlarged in I, L, O.
(G, J, M) Note gaps with no cell bodies in the Pc layer associated with less dendrites in the molecular layer (ML) and a thin external granular layer indicated by arrow in J, M compared to that observed in G.
(H, I, K, L, N, O) Note the decrease in density of interneurons (AP2 β) in K, L, N, O compared to Sham (H, I)
The blue fluorescence is due to the nuclear counterstaining with Hoechst 33258.
Scale bars = A, B, D, E, G, H: 50 μm; C, F, I: 20μm.
In the L 3, 4 of the vermis and the hemispheres, H and HI animals had a significant decline to half the number of Pc (p< 0.001) when compared to sham (Fig 5A). In the L 8, 9 of the vermis, H animals were less susceptible to Pc loss, compared to sham (p< 0.05) and HI animals (p< 0.001) (Fig. 5B). This decrease of Pc was not different in H and all HI injured animals in the L 3, 4 of the vermis. In the hemispheres, Pc loss was more obvious in the HI group than in the H group (p<0.01), with no difference between the left and right hemispheres of each group (Fig. 5C).
Figure 5.

Purkinje cell quantification in the lobules (L) 3-4 (A) and 8-9 of the vermis (B) and right (RH) and left (LH) hemispheres (C) of Sham, hypoxic (Hypo) and hypoxic-ischemic (HI) animals. Quantification in Sham, Hypo and HI animals of interneuron (AP2b positive cells) in the L 3-4 (D), L 8-9 (E) of the vermis and both hemispheres (F); GFAP-positive cells in the L 3-4 (G), l 8-9 (H) vermis and both hemispheres (I) of Sham, Hypo and HI animals.
Bar represents mean density of positive cells ± s.e.m. Asterisks indicate significant difference from black bars; ** p< 0.01, * p< 0.05. Hash sign indicate significant difference between H compared to HI animals; ### p< 0.001, ## p< 0.01, # p< 0.05
As almost all Pax6 positive external granular cells have migrated within IGL at P21, only residual cells were detected in the EGL. These cells were so densely packed that it was not possible to assess any differences following different treatment compared to sham (Fig. 4G, J, M).
At P21, immunohistochemical detection revealed AP2β positive interneurons located mostly in the molecular layer in H and HI compared to sham (Fig. 4H, I, K, L, N,O). The assessment of these interneurons following hypoxia and hypoxia-ischemia show a similar critical decrease, which was comparable in the L 3,4 and 8, 9 of the vermis and hemispheres (p<0.001) compared to the sham (Fig 5D–F). However, this decrease of AP2b positive cells was more obvious in H animals, when compared to the HI animals (p< 0.05) in the L 3, 4 of the vermis (Fig 5D).
Cerebellar astrogliosis and microgliosis after hypoxia versus hypoxia-ischemia
Cerebellar sections were examined for the presence of astrogliosis at 19 days post-injury, as a characteristic pathologic occurrence in injured central nervous system tissue. In the molecular layer, GFAP positive glia were arranged in stripes perpendicular to the Purkinje cell layer (Fig. 4H,I,K,L,N,O). In injured sections, there was an increase in GFAP immunoreactivity in regions where Pc loss occurred, both in the Purkinje cell layer and molecular layer. Increased GFAP positive cells were present in cerebellar cortex (vermis and both hemispheres) in H and HI animals when compared to the sham group, p<0.001 (Fig. 5G, H, I). However, this increase in GFAP positive cells was more obvious in H compared to HI animals in the L 3,4 and 8, 9 of the vermis (p<0.01).
Activated microglia was observed in the vermis and the hemispheres of the cerebellum at P3, P4, P21. At P4, the Iba1-positive cells were intermediate microglia with large cell bodies. They were mainly located in the white matter fiber tracts and the deep granular layer in the anterior regions of the cerebellum (L 3,4), and were denser in H and HI injured animals than in sham (Fig. 6A, B); only sparse iba1 positive cells were detected within the Purkinje cell layer and molecular layer. No obvious differences in the phenotype of microglia were observed at P3 or P4 compared to P21 although they were less dense later in development.
Figure 6.
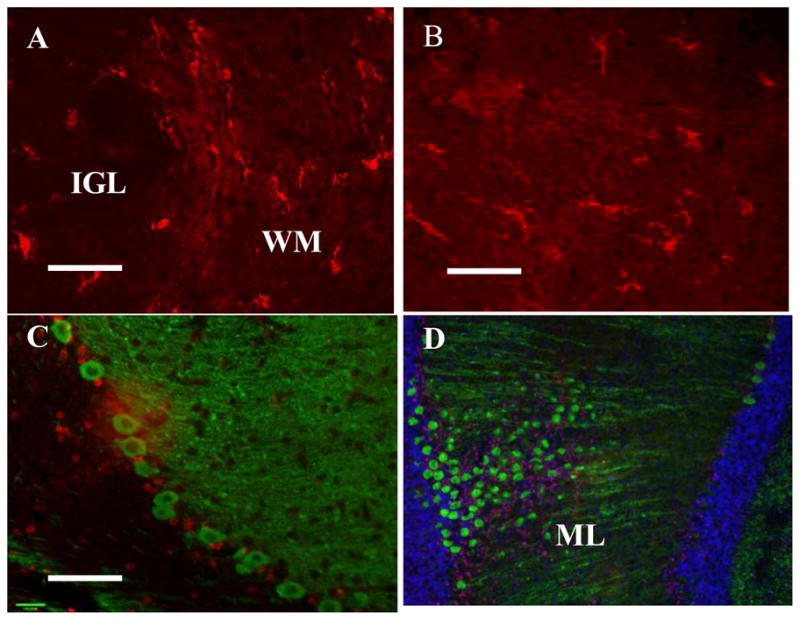
(A–B) Activated microglia (red-iba1) in the white matter fiber tracts (WM) at P3. (C–D) Following neonatal forebrain hypoxic-ischemic injury, caspase 3 activation (red) is present in the Purkinje cell layer and molecular layer (ML) but no colocalization with Purkinje cells (green-calbindin) is detected at P3.
Scale bar D: 100 μm; A, B, C: 50μm
Apoptosis of Purkinje cells occurs after hypoxia
Cleaved caspase-3 was observed in at least four sections per brain, per time point at P3, P4, P21 in the H and HI groups. There was relatively little cleaved caspase3 observed despite cell loss as described above. At one and two days post-injury, limited cleaved caspase-3 activation occurred in the Pc and granule cell layer, observed in the lobules 3, 4; however, there was no calbindin colocalization with cleaved caspase-3 in the Purkinje cells layer (Fig 6C, D). There was no immunolabeling for caspase-3 in any sections of the cerebellum examined at 21 days postinjury with the exception of positive sham forebrain tissue sections (data not shown).
Cerebellar white matter damage is seen after hypoxia versus hypoxia ischemia
At P21, the myelinated axonal pathway displayed very dense MBP reactivity in all cases (Fig. 7A–D). However, large unmyelinated vacuoles were detected in the axonal pathways of all the different cerebellar lobules of injured animals. The density of these vacuoles was increased following H compared to sham animals, whereas it was smaller in mild HI injury. Similar density was observed between H and severe HI.
Figure 7.

Myelin Binding Protein (MBP, green) and Olig2 (red) double-labeling in (A) Sham, (B) hypoxic (Hypo), (C) mild (mi-HI), (D) severe hypoxic-ischemic (se-HI) animals at P21. MBP labeling showed a severe loss of myelin and cystic features (*) in cerebellar white matter after Hypo (B) and HI (C–D). In (B) Hypo and (D) se-HI animals, all cerebellum exhibited evidence of myelination defect associated with reduced Olig-2 staining.
Scale bar: 50μm
(E) Quantification of MBP (densitometry) in the lobules (L) 3-4 of the vermis of Sham, Hypo and HI animals. Mild (mi), moderate, (mo), and severe (se) HI are evaluated.
(F) Quantification of preoligodendrocytes (Olig-2 positive cells) in the L 3-4 of the vermis of Sham, Hypo and HI animals.
Bar represents mean density of positive cells ± s.e.m. Asterisks indicate significant difference from black bars; *** p< 0.001, ** p< 0.01, * p< 0.05. Hash sign indicate significant difference between H compared to HI animals; ### p< 0.001, ## p< 0.01, # p< 0.05
Quantification showed a major myelination defect following hypoxic and mo-hypoxic- ischemic, se-hypoxic-ischemic in all regions of the cerebellum compared to sham (p< 0.001) (Fig. 7E). Interestingly, the myelination defect as visualized by MBP immunoreactivity was more severe in H cases compared to mi-HI animals (p<0.001). No difference in myelination defects was detected between male and female brains or right and left hemispheres of the cerebellum in any experimental group.
In parallel, Olig2 positive preoligodendrocytes were visualized in H and HI compared to sham (Fig 7A–D). There was a reduction in the density of Olig-2-positive cells in the H group compared to the sham in the L 3, 4 (Fig 7F), L 8, 9 of the vermis and both hemispheres (p<0.001), data not shown. This decrease in Olig-2-positive cells in the H group was more obvious when compared to the HI group in the L 3, 4, 8, 9 of the vermis (p<0.05), but not in the hemispheres.
DISCUSSION
The present study demonstrates that global hypoxic injury early after birth in rat pups produces damage in cellular morphology of the cerebellum, and that the addition of forebrain ischemia does not increase this damage. Interestingly, the defect in myelination detected following hypoxia is more severe than that following hypoxia-ischemia. The lack of volume loss indicates that there can be significant cellular injury followed by post-lesional plasticity with axonal and dendritic growth and no gross anatomical disturbance. The presence of increased density of GFAP-positive cells and microglial activation in the WM and cerebellar cortex of both H and HI injured rats supports a pathological event directly affecting the survival and/or maturation of neurons and preoligodendrocytes in the damaged cerebellar cortex. These findings may explain some neurodevelopmental abnormalities seen in preterm babies even in the absence of gross cerebellar volume reduction.
Following hypoxia-ischemia, selective vulnerability of different regions of the brain depends on its maturity and on the severity of the insult (Towfighi et al., 1997). In the P7 HI model (Vannucci model) equivalent of human injury at 32–36 weeks of gestation, the areas with higher metabolism such as the cerebral cortex, hippocampi, and deep gray nuclei suffer the most after initial ischemic injury. Histological brain damage is generally confined to the cerebral hemisphere ipsilateral to the arterial occlusion, and consists of selective cell death or infarction and delayed neurodegeneration depending on the duration of the systemic hypoxia (Geddes et al., 2001; Northington et al., 2001; Vannucci and Vannucci, 2005). Concerning the vulnerability of the cerebellum following hypoxia-ischemia at P7, only apoptosis of granule cells has been reported (Peng et al., 2005). In the present study, we chose the rat model at P2 to mimic the preterm insult in which most of human cerebellar injury is detected. At P2, the cerebellar cortex has just induced its second wave of neuronal proliferation in the external granular layer. Between birth and P5, Purkinje cells arrange in a single layer and start to elaborate their characteristic dendritic arbors with high proliferation and beginning of migration of the external granular layer cells to their final destination in the internal granule cell layer until P21 (Sotelo, 2004). Following injury at P2, we observed at P21 a significant reduction in the thickness of the molecular and granular layer in parallel with a significant decline in the number of Purkinje cells in the different lobules of the cerebellum in H as well as in HI animals compared to sham. This cerebellar damage was not dependent on the extent of forebrain injury, since the median scores of forebrain injuries were 12 for moderate HI animals, 21 for severe HI injury, and only 2 for H alone (Fig. 2). Even though the forebrain score for H was minimal, we detected critical cerebellar damage in our model, and there was a significant effect on myelination in the hypoxia group compared to the mildly affected HI group. This suggests that hypoxia alone can have longterm effects on myelination even in the absence of severe injury. The only similar model of hypoxia in preterm brain has been described in the sheep following prenatal global hypoxia. Similar neuronal loss was noticed in the cerebellar cortex with a proliferation deficit of external granule cells and Purkinje cell loss (Rees et al., 1998; Rees et al., 1997).
Interestingly, significantly smaller damage was observed for Pc following hypoxia-ischemia compared to hypoxia alone. Hypoxia-ischemia treatment was always preceded with a isoflurane anesthesia which was not present for H treatment. Isoflurane has been shown to be neuroprotective in the P7 Vannucci model (Zhao and Zuo, 2004; Zheng and Zuo, 2003) and might be neuroprotective for the contralateral forebrain lesion and/or the cerebellar Pc populations. Along the same lines, the myelination defect detected following hypoxia is significantly more severe than that following hypoxia-ischemia. The injury occurred in our model prior to the onset of myelination when oligodendrocyte progenitor cells (OPC) were present in the cerebellar white matter (Baud et al., 2004).
Other studies using perinatal HI have shown that cell death occurs in brain regions that are not directly affected by the ischemia, such as cerebellum (Meyer et al., 1993; Northington et al., 2001; Young et al., 2004) suggesting that neuronal connectivity may play a role in neurodegeneration following HI to the immature brain. Taken together, these findings may reveal the connection networks which could exist between the damaged forebrain and cerebellum in the developing brain. In non-human primates and humans, the cerebral cortical areas of the forebrain make several axonal connections with the cerebellum via the pallidum, the thalamus and the pons (Brodal, 1978; Brodal and Brodal, 1981). Possibly, mechanical or functional injury of this corticopontocerebellar pathway could affect the activity in the ipsilateral pons, and also the contralateral cerebellar cortex, a phenomenon known as crossed cerebellar diaschisis (Infeld et al., 1995). Limperopoulos et al (Limperopoulos et al., 2005c) showed that unilateral injury confined to the preterm cerebral hemisphere was associated with a significantly decreased volume of the contralateral cerebellar hemisphere, and that these effects were evident as early as term gestational age equivalent. In the rat brain, pontocerebellar projections are bilateral. The contralateral component is the largest, the ipsilateral is less massive and is formed mostly by collaterals of contralaterally projecting axons (Azizi et al., 1981), (Mihailoff, 1983; Rosina et al., 1980). In this study, we found that HI to the left forebrain and H injury induced Purkinje cell loss and white matter damage in both cerebellar hemispheres. Our results showing neuronal and white matter damage in both cerebellar hemispheres following hypoxia alone suggest that systemic hypoxia could adversely affect the developing cerebellum independent of its connections. One cannot exclude the apoptotic effects of glucocorticoids on cerebellar neuronal population (Noguchi et al., 2008). In addition, it is possible that reactive oxygen species resulting from hypoxia is responsible in part for the effects on cerebellar neurons, a topic that warrants further attention.
Clinical imaging studies have demonstrated significant and persistent reductions in total or unilateral hemisphere cerebellar volume in ex-preterm infants compared with that of term-born controls (Allin et al., 2001; Limperopoulos et al., 2005b; Messerschmidt et al., 2005; Peterson et al., 2000; Srinivasan et al., 2006) and a relatively common cerebellar pathology, including infarction and hemorrhage (Bodensteiner and Johnsen, 2005; Limperopoulos et al., 2005a; Mercuri et al., 1997). There are limited data supporting histopathological neuronal loss and white matter injury in cerebellar insults in preterm infants (Tsuru et al., 1995) and these findings cannot be correlated to specific defined preterm pathology. Our rat model of hypoxic insult shows a higher vulnerability of neurons of the anterior cerebellum (L3-4) which are less mature than the ones located in the posterior cerebellum (L8, 9) (Altman and Bayer, 1985). This model of early hypoxia at P2, comparable to very preterm infants (around 28 weeks of gestation), may correspond to cerebellar damage involving the anterior sensorimotor cerebellum rather than the cognitive/emotional posterior cerebellum (Stoodley and Stein, 2009). More studies are necessary to evaluate the spatiotemporal cerebellar damage following hypoxia and/or ischemia in the preterm brain.
Acknowledgments
This work was supported by the Journees Francophones de Recherche en Neonatologie (JFRN), Assistance Publique Hopitaux de Paris (APHP) to VB, and the National Institute of Health grant NS35902 to DMF.
The authors are most grateful to Myriam Bouslama for helpful statistical analysis and Nikita Derugin for surgery support.
Footnotes
Disclosures None.
Publisher's Disclaimer: This is a PDF file of an unedited manuscript that has been accepted for publication. As a service to our customers we are providing this early version of the manuscript. The manuscript will undergo copyediting, typesetting, and review of the resulting proof before it is published in its final citable form. Please note that during the production process errors may be discovered which could affect the content, and all legal disclaimers that apply to the journal pertain.
References
- Allin M, et al. Cognitive and motor function and the size of the cerebellum in adolescents born very pre-term. Brain. 2001;124:60–6. doi: 10.1093/brain/124.1.60. [DOI] [PubMed] [Google Scholar]
- Altman J, Bayer SA. Embryonic development of the rat cerebellum. III. Regional differences in the time of origin, migration, and settling of Purkinje cells. J Comp Neurol. 1985;231:42–65. doi: 10.1002/cne.902310105. [DOI] [PubMed] [Google Scholar]
- Azizi SA, et al. The pontocerebellar system in the rat: an HRP study. I. Posterior vermis. J Comp Neurol. 1981;197:543–8. doi: 10.1002/cne.901970402. [DOI] [PubMed] [Google Scholar]
- Baud O, et al. Gestational hypoxia induces white matter damage in neonatal rats: a new model of periventricular leukomalacia. Brain Pathol. 2004;14:1–10. doi: 10.1111/j.1750-3639.2004.tb00492.x. [DOI] [PMC free article] [PubMed] [Google Scholar]
- Berquin PC, et al. Cerebellum in attention-deficit hyperactivity disorder: a morphometric MRI study. Neurology. 1998;50:1087–93. doi: 10.1212/wnl.50.4.1087. [DOI] [PubMed] [Google Scholar]
- Bodensteiner JB, Johnsen SD. Cerebellar injury in the extremely premature infant: newly recognized but relatively common outcome. J Child Neurol. 2005;20:139–42. doi: 10.1177/08830738050200021101. [DOI] [PubMed] [Google Scholar]
- Brodal P. Principles of organization of the monkey corticopontine projection. Brain Res. 1978;148:214–8. doi: 10.1016/0006-8993(78)90392-x. [DOI] [PubMed] [Google Scholar]
- Brodal P, Brodal A. The olivocerebellar projection in the monkey. Experimental studies with the method of retrograde tracing of horseradish peroxidase. J Comp Neurol. 1981;201:375–93. doi: 10.1002/cne.902010306. [DOI] [PubMed] [Google Scholar]
- Dingman A, et al. Aminoguanidine inhibits caspase-3 and calpain activation without affecting microglial activation following neonatal transient cerebral ischemia. J Neurochem. 2006;96:1467–79. doi: 10.1111/j.1471-4159.2006.03672.x. [DOI] [PubMed] [Google Scholar]
- Geddes R, et al. Delayed cerebral atrophy following moderate hypoxia-ischemia in the immature rat. Dev Neurosci. 2001;23:180–5. doi: 10.1159/000046140. [DOI] [PubMed] [Google Scholar]
- Goyen TA, et al. Visual-motor, visual-perceptual, and fine motor outcomes in very-low-birthweight children at 5 years. Dev Med Child Neurol. 1998;40:76–81. doi: 10.1111/j.1469-8749.1998.tb15365.x. [DOI] [PubMed] [Google Scholar]
- Infeld B, et al. Crossed cerebellar diaschisis and brain recovery after stroke. Stroke. 1995;26:90–5. doi: 10.1161/01.str.26.1.90. [DOI] [PubMed] [Google Scholar]
- Levine S. Anoxic-ischemic encephalopathy in rats. Am J Pathol. 1960;36:1–17. [PMC free article] [PubMed] [Google Scholar]
- Levisohn L, et al. Neuropsychological consequences of cerebellar tumour resection in children: cerebellar cognitive affective syndrome in a paediatric population. Brain. 2000;123(Pt 5):1041–50. doi: 10.1093/brain/123.5.1041. [DOI] [PubMed] [Google Scholar]
- Limperopoulos C, et al. Does cerebellar injury in premature infants contribute to the high prevalence of long-term cognitive, learning, and behavioral disability in survivors? Pediatrics. 2007;120:584–93. doi: 10.1542/peds.2007-1041. [DOI] [PubMed] [Google Scholar]
- Limperopoulos C, et al. Cerebellar hemorrhage in the preterm infant: ultrasonographic findings and risk factors. Pediatrics. 2005a;116:717–24. doi: 10.1542/peds.2005-0556. [DOI] [PubMed] [Google Scholar]
- Limperopoulos C, et al. Late gestation cerebellar growth is rapid and impeded by premature birth. Pediatrics. 2005b;115:688–95. doi: 10.1542/peds.2004-1169. [DOI] [PubMed] [Google Scholar]
- Limperopoulos C, et al. Impaired trophic interactions between the cerebellum and the cerebrum among preterm infants. Pediatrics. 2005c;116:844–50. doi: 10.1542/peds.2004-2282. [DOI] [PubMed] [Google Scholar]
- Mercuri E, et al. Cerebellar infarction and atrophy in infants and children with a history of premature birth. Pediatr Radiol. 1997;27:139–43. doi: 10.1007/s002470050085. [DOI] [PubMed] [Google Scholar]
- Messerschmidt A, et al. Disruption of cerebellar development: potential complication of extreme prematurity. AJNR Am J Neuroradiol. 2005;26:1659–67. [PMC free article] [PubMed] [Google Scholar]
- Messerschmidt A, et al. Disrupted cerebellar development in preterm infants is associated with impaired neurodevelopmental outcome. Eur J Pediatr. 2008;167:1141–7. doi: 10.1007/s00431-007-0647-0. [DOI] [PubMed] [Google Scholar]
- Meyer JS, et al. Diaschisis. Neurol Res. 1993;15:362–6. doi: 10.1080/01616412.1993.11740164. [DOI] [PubMed] [Google Scholar]
- Mihailoff GA. Intra- and interhemispheric collateral branching in the rat pontocerebellar system, a fluorescence double-label study. Neuroscience. 1983;10:141–60. doi: 10.1016/0306-4522(83)90088-x. [DOI] [PubMed] [Google Scholar]
- Noguchi KK, et al. Acute neonatal glucocorticoid exposure produces selective and rapid cerebellar neural progenitor cell apoptotic death. Cell Death Differ. 2008;15:1582–92. doi: 10.1038/cdd.2008.97. [DOI] [PMC free article] [PubMed] [Google Scholar]
- Northington FJ, et al. Early Neurodegeneration after Hypoxia-Ischemia in Neonatal Rat Is Necrosis while Delayed Neuronal Death Is Apoptosis. Neurobiol Dis. 2001;8:207–19. doi: 10.1006/nbdi.2000.0371. [DOI] [PubMed] [Google Scholar]
- Nosarti C, et al. Grey and white matter distribution in very preterm adolescents mediates neurodevelopmental outcome. Brain. 2008;131:205–17. doi: 10.1093/brain/awm282. [DOI] [PubMed] [Google Scholar]
- Parker J, et al. Cerebellar growth and behavioural & neuropsychological outcome in preterm adolescents. Brain. 2008;131:1344–51. doi: 10.1093/brain/awn062. [DOI] [PubMed] [Google Scholar]
- Peng JH, et al. Apoptosis and necrosis in developing cerebellum and brainstem induced after focal cerebral hypoxic-ischemic injury. Brain Res Dev Brain Res. 2005;156:87–92. doi: 10.1016/j.devbrainres.2005.02.002. [DOI] [PubMed] [Google Scholar]
- Peterson BS, et al. Regional brain volume abnormalities and long-term cognitive outcome in preterm infants. Jama. 2000;284:1939–47. doi: 10.1001/jama.284.15.1939. [DOI] [PubMed] [Google Scholar]
- Pierson CR, et al. Gray matter injury associated with periventricular leukomalacia in the premature infant. Acta Neuropathol. 2007;114:619–31. doi: 10.1007/s00401-007-0295-5. [DOI] [PMC free article] [PubMed] [Google Scholar]
- Powls A, et al. Motor impairment in children 12 to 13 years old with a birthweight of less than 1250 g. Arch Dis Child Fetal Neonatal Ed. 1995;73:F62–6. doi: 10.1136/fn.73.2.f62. [DOI] [PMC free article] [PubMed] [Google Scholar]
- Rees S, et al. Fetal brain injury following prolonged hypoxemia and placental insufficiency: a review. Comp Biochem Physiol A Mol Integr Physiol. 1998;119:653–60. doi: 10.1016/s1095-6433(98)01001-0. [DOI] [PubMed] [Google Scholar]
- Rees S, et al. The vulnerability of the fetal sheep brain to hypoxemia at mid-gestation. Brain Res Dev Brain Res. 1997;103:103–18. doi: 10.1016/s0165-3806(97)81787-7. [DOI] [PubMed] [Google Scholar]
- Regeur L, Pakkenberg B. Optimizing sampling designs for volume measurements of components of human brain using a stereological method. J Microsc. 1989;155:113–21. doi: 10.1111/j.1365-2818.1989.tb04300.x. [DOI] [PubMed] [Google Scholar]
- Rice JE, 3rd, et al. The influence of immaturity on hypoxic-ischemic brain damage in the rat. Ann Neurol. 1981;9:131–41. doi: 10.1002/ana.410090206. [DOI] [PubMed] [Google Scholar]
- Rosina A, et al. Ponto-neocerebellar axonal branching as revealed by double fluorescent retrograde labeling technique. Brain Res. 1980;195:461–6. doi: 10.1016/0006-8993(80)90080-3. [DOI] [PubMed] [Google Scholar]
- Saigal S, Doyle LW. An overview of mortality and sequelae of preterm birth from infancy to adulthood. Lancet. 2008;371:261–9. doi: 10.1016/S0140-6736(08)60136-1. [DOI] [PubMed] [Google Scholar]
- Sotelo C. Cellular and genetic regulation of the development of the cerebellar system. Prog Neurobiol. 2004;72:295–339. doi: 10.1016/j.pneurobio.2004.03.004. [DOI] [PubMed] [Google Scholar]
- Srinivasan L, et al. Smaller cerebellar volumes in very preterm infants at term-equivalent age are associated with the presence of supratentorial lesions. AJNR Am J Neuroradiol. 2006;27:573–9. [PMC free article] [PubMed] [Google Scholar]
- Stoodley CJ, Stein JF. The cerebellum and dyslexia. Cortex. 2009 doi: 10.1016/j.cortex.2009.10.005. [DOI] [PubMed] [Google Scholar]
- Towfighi J, et al. Influence of age on the cerebral lesions in an immature rat model of cerebral hypoxia-ischemia: a light microscopic study. Brain Res Dev Brain Res. 1997;100:149–60. doi: 10.1016/s0165-3806(97)00036-9. [DOI] [PubMed] [Google Scholar]
- Tsuru A, et al. Cystic leukomalacia in the cerebellar folia of premature infants. Acta Neuropathol. 1995;90:400–2. doi: 10.1007/BF00315013. [DOI] [PubMed] [Google Scholar]
- Vannucci RC, Vannucci SJ. Perinatal hypoxic-ischemic brain damage: evolution of an animal model. Dev Neurosci. 2005;27:81–6. doi: 10.1159/000085978. [DOI] [PubMed] [Google Scholar]
- Volpe JJ. Cerebral white matter injury of the premature infant-more common than you think. Pediatrics. 2003;112:176–80. doi: 10.1542/peds.112.1.176. [DOI] [PubMed] [Google Scholar]
- Volpe JJ. Cerebellum of the premature infant: rapidly developing, vulnerable, clinically important. J Child Neurol. 2009;24:1085–104. doi: 10.1177/0883073809338067. [DOI] [PMC free article] [PubMed] [Google Scholar]
- Young C, et al. Excitotoxic versus apoptotic mechanisms of neuronal cell death in perinatal hypoxia/ischemia. Curr Mol Med. 2004;4:77–85. doi: 10.2174/1566524043479158. [DOI] [PubMed] [Google Scholar]
- Zhao P, Zuo Z. Isoflurane preconditioning induces neuroprotection that is inducible nitric oxide synthase-dependent in neonatal rats. Anesthesiology. 2004;101:695–703. doi: 10.1097/00000542-200409000-00018. [DOI] [PubMed] [Google Scholar]
- Zheng S, Zuo Z. Isoflurane preconditioning reduces purkinje cell death in an in vitro model of rat cerebellar ischemia. Neuroscience. 2003;118:99–106. doi: 10.1016/s0306-4522(02)00767-4. [DOI] [PubMed] [Google Scholar]