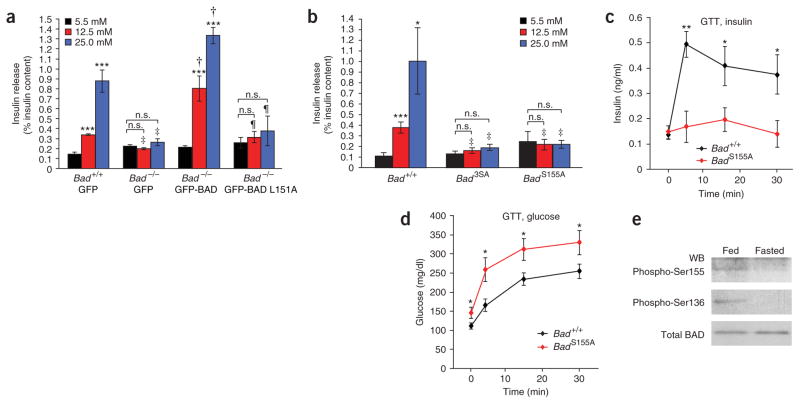
Figure 4.
Regulation of GSIS by the BAD BH3 domain and its phosphorylation status. (a) Genetic reconstitution of the GSIS defect in Bad −/− islets. Data are means ± s.e.m. of three separate experiments performed with two independent preparations of viral stocks. n.s., not significant. Asterisks compare release at 5.5 mM versus 12.5 or 25 mM glucose within each group of islets, ***P < 0.001. ‡P < 0.05, comparing Bad +/+ versus Bad −/− islets infected with control (GFP) viruses; †P < 0.001, comparing Bad −/− islets infected with control viruses versus viruses expressing wild-type BAD; ¶P < 0.05, comparing Bad −/− islets infected with viruses expressing wild-type BAD versus viruses expressing the L151A mutant. Insulin content per islet was 122.75 ± 12.34 and 127.13 ± 5.09 ng, Bad +/+ and Bad −/−, respectively. (b) GSIS in Bad +/+, Bad 3SA and Bad S155A islets. Data are means ± s.e.m. of three independent experiments. Asterisks compare release at 5.5 mM versus 12.5 or 25 mM glucose within each group of islets, *P < 0.05, ***P < 0.001. ‡P < 0.05, Bad +/+ versus Bad 3SA or Bad +/+ versus Bad S155A. Insulin content per islet was 118.74 ± 3.86, 96.46 ± 3.42 and 106.5 ± 6.24 ng, Bad +/+, Bad3SA and Bad S155A, respectively. (c,d) Blood insulin (c) and glucose (d) abundance after intraperitoneal glucose tolerance test performed on Bad +/+ (n = 10) and Bad S155A (n = 10) mice. *P < 0.05, **P < 0.01, Bad +/+ versus Bad S155A mice, Student’s t-test. (e) BAD phosphorylation status in islets isolated from fed or overnight fasted mice. The ratio of phospho-BAD to total BAD in fed versus fasted state was 0.72 versus 0.01 for Ser155 and 0.80 versus 0.03 for Ser136. WB, western blot.

