
Figure 2.
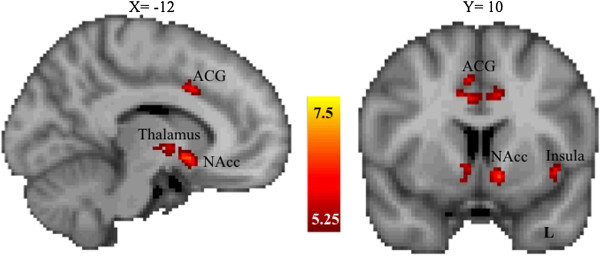
Brain regions showing significant activation for incentive versus non-incentive trials during the anticipation phase of the monetary incentive delay task across the entire sample.Z values indicate cluster thresholds. ACG, anterior cingulate gyrus; L, left; NAcc, nucleus accumbens.