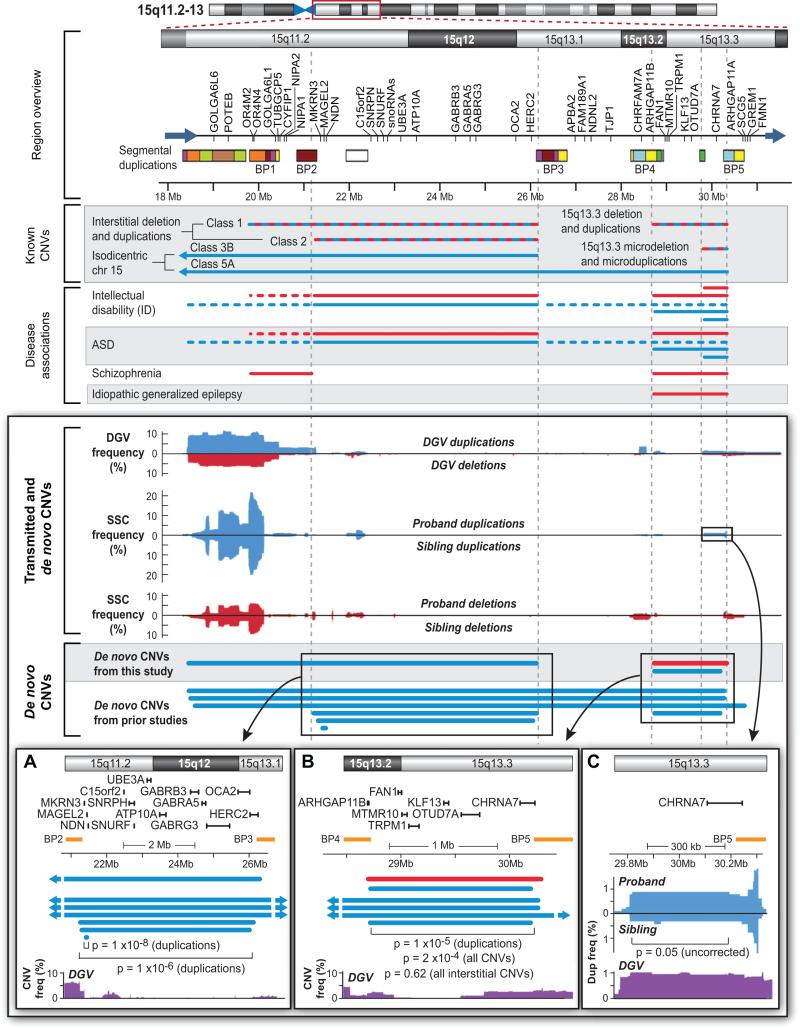
Figure 7. De novo and transmitted CNVs in 15q11.2-13.
A 13Mb region is identified by the red box on the ideogram at the top. The Region overview identifies the RefSeq genes present within the interval and multiple segmental duplications (the colors identify regions of homology (Makoff and Flomen, 2007)). 5 of these segmental duplications are commonly referred to as BP1-BP5. Known CNVs identifies duplications (blue) and deletions (red) that have been reported in the literature; the alternating red and blue colors denote both deletions and duplications. Disease associations identifies regions with reported associations to four developmental and neuropsychiatric conditions (supplementary materials). Of note, BP2-BP3 deletions lead to Prader-Willi or Angelman syndrome. Transmitted and de novo CNVs shows the frequency of duplications (blue) and deletions (red) in the DGV and SSC populations. While CNVs overlying the segmental duplications are common, CNVs between the breakpoints are generally rare. De novo CNVs shows confirmed de novo CNVs in single individuals identified in this study and prior ASD studies (Itsara et al., 2010; Marshall et al., 2008; Pinto et al., 2010; Sebat et al., 2007). A) An enlargement of BP2-3 showing the relationship of de novo CNVs, genes, and common regions in the DGV. A small atypical duplication includes the genes MAGEL2, MKRN3, NDN (Itsara et al., 2010). B) An enlargement of BP4-BP5 showing similar data and methods as A. Removing the three Class 5A isodicentric chr15 events results in a non-significant p-value (p=0.62). C) An enlargement of the CHRNA7 region showing enrichment of duplications in probands (N=10) vs. siblings (N=3). The p-value is p=0.05 (Fisher's exact test); uncorrected for 3,667 comparisons; the rate of duplications in the DGV is similar to that seen in probands (Table S7).

