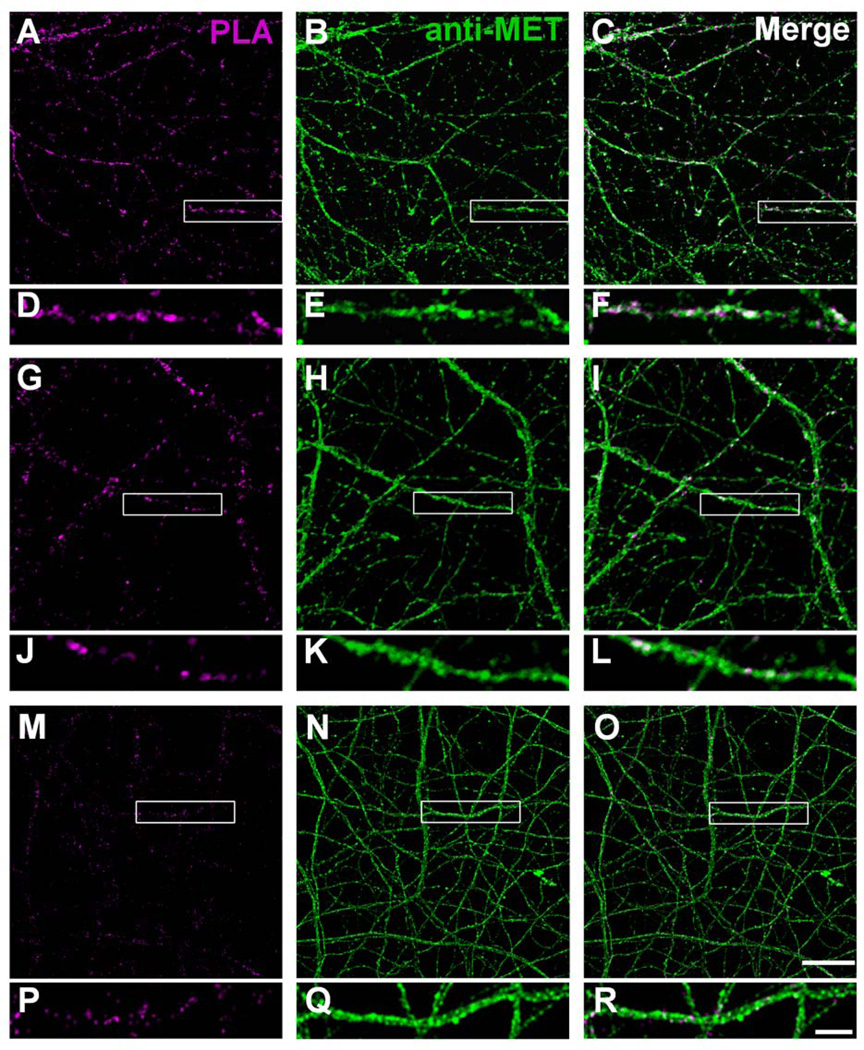
Figure 7. Representative confocal microscopy images of PLA staining in primary hippocampal neurons at 14 days in vitro.
The presynaptic compartment was labeled with synapsin 1 and neurexin 1 and the postsynaptic compartment with PSD-95. Magenta fluorescent profiles represent regions of PLA signal amplification denoting Met and synapsin 1 (A, D), Met and neurexin 1 (G, J), and Met and PSD-95 (M, P) co-localization. No PLA signal is observed in the presence of Met antibody alone (S, V). For comparison, corresponding total Met immunoreactivity in the same field is also illustrated (B, E; H, K; N, Q; T, W). The boxed regions are shown at higher magnification below each image. Bar = 20µm in U (applies to A–C, G–I, M–O, S–U), 5µm in X (applies to D–F, J–L, P–R, V–X).

