FIGURE 1.
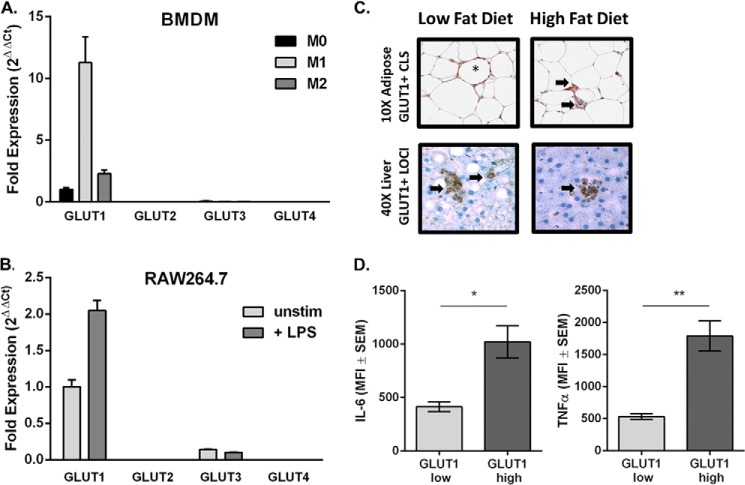
GLUT1 is the primary transporter on proinflammatory MΦ and is detected in obesity-associated crown-like structures. qPCR expression analysis of GLUT1–4 in BMDM (A) and RAW MΦs (B). A, bone marrow was isolated from wild type C57BL/6 mice. BMDMs were left as unstimulated naïve cells (M0) or polarized toward M1 or M2 phenotype. Fold expression from M0 GLUT1 was set to 1. B, RAW MΦs were plated and left unstimulated or stimulated with 100 ng/ml LPS for 24 h. Fold expression from untreated GLUT1 was set to 1. C, GLUT1+ CLS (crown-like structure) (*) and inflammatory loci (→) are indicated in low fat diet-fed lean and high fat diet-fed obese adipose (top images) and livers (bottom images). D, adipose tissue macrophages derived from mice were stained for macrophages (F4/80+), GLUT1 (myc), IL-6 (*, p = 018), and TNFα (*, p = 0.0062). n = 3. Data show the mean ± S.E. of the mean fluorescence intensity (MFI).

