

Abstract
Heme oxygenase (HO) catalyzes the O2- and NADPH-dependent conversion of heme to biliverdin, CO, and iron. The two forms of HO (HO-1 and HO-2) share similar physical properties but are differentially regulated and exhibit dissimilar physiological roles and tissue distributions. Unlike HO-1, HO-2 contains heme regulatory motifs (HRMs) (McCoubrey, W. K., Jr., Huang, T. J., and Maines, M. D. (1997) J. Biol. Chem. 272, 12568–12574). Here we describe UV-visible, EPR, and differential scanning calorimetry experiments on human HO-2 variants containing single, double, and triple mutations in the HRMs. Oxidized HO-2, which contains an intramolecular disulfide bond linking Cys265 of HRM1 and Cys282 of HRM2, binds heme tightly. Reduction of the disulfide bond increases the Kd for ferric heme from 0.03 to 0.3 μm, which is much higher than the concentration of the free heme pool in cells. Although the HRMs markedly affect the Kd for heme, they do not alter the kcat for heme degradation and do not bind additional hemes. Because HO-2 plays a key role in CO generation and heme homeostasis, reduction of the disulfide bond would be expected to increase intracellular free heme and decrease CO concentrations. Thus, we propose that the HRMs in HO-2 constitute a thiol/disulfide redox switch that regulates the myriad physiological functions of HO-2, including its involvement in the hypoxic response in the carotid body, which involves interactions with a Ca2+-activated potassium channel.
Heme oxygenase (HO2; EC 1.14.99.3) catalyzes the O2- and NADPH-dependent conversion of heme to biliverdin, CO, and iron in a reaction that is coupled to cytochrome P450 reductase (1,2): heme + 7e− + 3O2 → biliverdin + CO + Fe(II) + 3H2O. Subsequently, biliverdin reductase catalyzes the two-electron reduction of biliverdin to bilirubin. HO is present in organisms from bacteria to eukaryotes and, as the only known enzyme that can degrade heme, plays a critical role in heme and iron homeostasis. Maintaining tight control of heme levels is important because heme is toxic at concentrations > 1 μm (3); however, it is the required prosthetic group of many electron transfer proteins and redox enzymes and regulates genes involved in oxygen utilization in lower eukaryotes and prokaryotes (4 – 6). Regulation of the concentrations of the products of the HO reaction is also important. Iron deficiency is pathological because iron is the essential catalytic center for many heme and non-heme metalloenzymes, yet iron excess is also pathological (7). CO is toxic at high levels (>500 ppm), yet HO-derived CO, which is produced locally within tissues, serves a signaling function in various physiological processes, including circadian modulation of heme biosynthesis, regulation of T cell function, and modulation of caveolin-1 status in growth control (8) as well as activation of guanylate cyclase (9) and mediation of O2 sensing and the hypoxic response (10).
There are two forms of HO (HO-1 and HO-2), which share similar physical and kinetic properties, but are differentially regulated and exhibit dissimilar physiological roles and tissue distributions. HO-1, considered to be the inducible HO, is also known as the heat-shock protein HSP32 and is found in most tissues, with particularly high levels in the spleen and liver. Expression of HO-1 is regulated by heat shock and various oxidative stress conditions such as ischemia, hypoxia, hyperoxia, and alteration of glutathione levels (11,12). On the other hand, HO-2 appears to be constitutively expressed, but exhibits a narrow tissue distribution, with high levels in the brain and testes (11). HO-2 has been implicated in oxygen sensing by the carotid body (10, 13), mediating oxidative stress in neurons (14), and regulating cerebral blood flow and vascular tone in certain tissues (15).
Human HO-1 and HO-2 exhibit similar catalytic activities and share a high level of homology (55% identity and 76% similarity), including related stretches of 20 hydrophobic residues at their C termini that anchor them to the microsomal membrane (11). However, HO-1 and HO-2 diverge significantly around residue 127 and between residues 240 and 295 (HO-2 numbering throughout unless stated otherwise). Although HO-1 typically lacks Cys residues, there are three Cys-Pro sequences in regions that have been proposed to contain heme regulatory (or responsive) motifs (HRMs) centered at Cys127, Cys265, and Cys282. It has been proposed that the HRM per se can bind heme (4,16). Interactions between heme and the HRM have also been proposed to control the activity or stability of several regulatory proteins, including the iron-responsive regulator Irr (4,17,18), eukaryotic initiation factor-2α kinase (19), the mammalian transcriptional repressor Bach1 (5, 20), 5-ami-nolevulinate synthase (21), and the yeast transcription factor Hap1 (which mediates the effects of oxygen on transcription) (22, 23). In 5-aminolevulinate synthase, there are three HRMs that reverse the heme-mediated inhibition of mitochondrial import of the synthase (21), whereas in the human iron-responsive regulator IRR, heme binding to the HRMs appears to regulate protein degradation (18). In the case of HO-2, it was concluded that one heme binds to each of the two HRMs at the C terminus as well as to the active site, where it undergoes conversion to biliverdin (24).
In the work described here, we have addressed whether or not heme binds to the HRMs in HO-2 and examined the role of the HRMs by comparing the properties of wild-type HO-2 and variants generated by substituting the Cys residues (singly or in combination) with Ala. Our results demonstrate that the HRMs have no effect on the steady-state catalytic activity and stability of HO-2. However, the C-terminal HRMs appear to act as a thiol/disulfide redox switch that regulates the affinity of HO-2 for heme and the spin state of the heme iron. Our results indicate that reduction of the disulfide bond between Cys265 and Cys282 lowers the affinity of HO-2 for heme by 10-fold, thus increasing the dissociation constant from 0.03 μm (near the concentration of free heme found in cells) to 0.35 μm. This increase in the heme Kd would be expected to increase the free heme pool and thus lower CO, iron, and biliverdin levels in the cell.
Experimental Procedures
Cloning Overexpression, and Purification of Human HO-2
The human full-length HO-2 cDNA in a pGEX-4T-2 vector (Amersham Biosciences), which was graciously contributed by Dr. Mahin D. Maines (University of Rochester, School of Medicine), was transformed into Escherichia coli strain BL21. In this construct, the human HO-2 fragment is fused to glutathione S-transferase (GST) and thus can be overexpressed and purified using a glutathione affinity column.
BL21 cells carrying the pGEX-4T-2/HO-2 plasmid were cultured in 1 liter of LB medium containing 100 μg/ml ampicillin at 37 °C. When the absorbance at 600 nm reached 0.8–1.0, 60 mg of 5-aminolevulinic acid hydrochloride (Sigma) was added along with 300 μl of 1 m isopropyl β-d-thiogalactopyranoside (Gold BioTechnology, St. Louis, MO) to induce the expression of HO-2. The cells were incubated for another 15 h at 25 °C and harvested by centrifugation at 7000 rpm for 10 min at 4 °C in a Beckman J2-HS centrifuge.
The cell pellet was resuspended in 5 volumes of 1× phosphate-buffered saline (PBS; 140 mm NaCl, 2.7 mm KCl, 10 mm Na2HPO4, and 1.8 mm KH2PO4, pH 7.4), containing Triton X-100 (0.04% (v/v); Sigma), protease inhibitor (1 tablet/50 ml of extraction solution; Roche Applied Science), lysozyme (0.5 mg/ml; Sigma), and DNase I (5 units/ml; Sigma) at 4 °C. Cells were then lysed by sonication, and the suspension was centrifuged at 17,000 rpm for 1 h at 4 °C in the Beckman J2-HS centrifuge. The supernatant was loaded onto a 10-ml glutathione-Sepharose 4B column (Amersham Biosciences), which was washed with 1× PBS containing 0.04% (v/v) Triton X-100. The HO-2/GST fusion protein was eluted with buffer containing 50 mm Tris-HCl, 0.04% (v/v) Triton X-100, and 10 mm reduced glutathione, pH 7.4; and the combined fractions containing the HO-2/GST fusion protein were extensively dialyzed with 1 × PBS containing 0.04% (v/v) Triton X-100 to remove glutathione. The GST domain then was cleaved by limited proteolysis using thrombin, and HO-2 was separated from GST by chromatography on a glutathione-Sepharose 4B column. All of these steps were carried out at 4 °C.
Site-directed Mutagenesis of HO-2
As described below, the truncated HO-2 variants are more stable and soluble than the full-length protein. A number of variants were generated to determine the functional roles of the HRMs in HO-2. Two kinds of truncated HO-2 were generated: one lacking the C-terminal membrane-binding region (HO-2Δ289-316) the other lacking the two C-terminal HRMs and the membrane-binding region (HO-2Δ265–316). The C265A, C282A, C127A, C265A/C282A, and C127A/C282A variants were generated from HO-2Δ289–316, and C127A/Δ265–316 was from HO-2Δ265–316. All mutations were generated using the QuikChange site-directed mutagenesis protocol (Stratagene, La Jolla, CA). The pGEX-4T-2/HO-2 plasmid was the template for PCRs using primers from Integrated DNA Technologies (25). All of these variants were purified by the same procedure described above for the wild-type enzyme.
HO-2 Assay
The HO-2 enzymatic assay was slightly modified from that described previously (26). The 1-ml reaction mixture contained 0.1 m potassium phosphate buffer, pH 7.4, 20 μm freshly prepared hemin (from a 2 mm stock containing 0.1 m NaOH and 5% Me2SO), 0.1 mg/ml bovine serum albumin, 30 μg of NADPH-cytochrome P450 reductase, 60 μg of purified human biliverdin reductase, and 30–100 μg of HO-2. The mixture was incubated at 37 °C, and the reaction was started by the addition of 10 μl of 100 mm NADPH and monitored by following the increase in absorbance at 468 nm using a Beckman DU7400 spectrophotometer. The specific activities of the various wild-type and variant HO-2 proteins were calculated using the difference extinction coefficient between heme and bilirubin at 468 nm (43.5 mm−1 cm−1). P450 reductase was donated by Dr. Bettie Sue Masters (University of Texas Health Sciences Center, Arlington, TX). Biliverdin reductase was purified from E. coli cells containing pGEX-4T-2/BVR. The BVR gene was purchased from American Type Culture Collection (Manassas, VA) and then subcloned into the pGEX-4T-2 plasmid.
Quantification of Heme Binding by the Pyridine Hemochrome Assay
HO-2·heme complexes were prepared by incubating purified HO-2 variants with a 5-fold molar excess of Fe3+ heme from a stock that was freshly prepared in 5% Me2SO to prevent aggregation. After incubation at 4 °C for 10 min, excess free heme was removed by chromatography on a Sephadex G-15 gel filtration column (Sigma). The amount of heme bound to HO-2 was calculated using a difference extinction coefficient at 556 nm of 28.32 mm−1 cm−1 (27).
Determination of Free Thiol Groups by the 5,5′ -Dithiobis(ni-trobenzoic Acid) (DTNB) Assay
Free thiol quantification of HO-2 was conducted by the DTNB assay basically as described (28, 29). After incubation of the 1-ml reaction mixture containing HO-2,100 mm Tris-HCl, pH 8.0, and 100 μm DTNB at room temperature for 15 min, the absorbance at 412 nm was recorded, and the free thiol concentrations were calculated by reference to a standard curve generated using dithiothreitol (DTT). The DTNB titration was performed in the presence and absence of 8 m urea. When the thiol groups in DTT-reduced HO-2 were measured, the protein was extensively dialyzed in an anaerobic chamber (Vacuum Atmospheres Co., Hawthorne, CA) before the assay.
Alkylation of Cysteine Residues and Mass Spectrometric Analysis
One- and two-step alkylation reactions were performed as described previously (30). Samples (2 mg/ml) of reduced (with 10 mm DTT) and oxidized (lacking DTT) HO-2 were dissolved in 0.5 ml of 8 m urea, 50 mm Tris-HCl, pH 8.2, and 1 mm Na-EDTA. The first alkylation step was performed by the addition of 50 mm iodoacetamide (final concentration) and incubation for 30 min at room temperature. The excess iodoacetamide was removed by precipitating the protein by adding a solution containing cold acetone and 1 n HCl/H2O (98:2:10), followed by centrifugation at 5000 rpm for 10 min at 4 °C. After washing the pellet three times with the same solution, the protein was reduced by reacting with 10 mm DTT for 30 min at 37 °C, and the second alkylation step was performed by the addition of 2 μl of 9.5 m 4-vinylpyridine and incubation for 20 min at room temperature. The 4-vinylpyridine addition was repeated three times. The unbound 4-vinylpyridine was removed using the acidic acetone solution as described above. After the one- and two-step alkylation reactions, samples were digested with trypsin overnight at room temperature, and the tryptic peptides were isolated and analyzed by nano-liquid chromatography/tandem mass spectrometry using a QSTAR XL mass spectrometer (Applied Biosystems). Peptide isolation was accomplished with a C18 PepMap100 column (75 μm × 15 cm, 3 μm, 100 Å; LC Packings, Sunnyvale, CA) using a linear gradient from 0.3% formic acid in H2O to 0.3% formic acid in acetonitrile at a flow rate of 170 nl/min. The mass spectroscopic results were analyzed using the MASCOT search engine.
Spectroscopic and Analytical Methods
Protein concentration was calculated based on the rose bengal method (30) using a standard curve generated using known amounts of HO-2, the concentration of which was determined by dry weight.
The heme binding affinity of each of the HO-2 variants was determined by adding heme to the reference and sample (containing HO-2) cuvettes and measuring the difference spectrum from 350 to 750 nm in an Olis updated Cary 14 double-beam spectrophotometer. To determine the binding affinity of Fe3+ heme, freshly prepared hemin (from a stock solution of 500 μm hemin in 5% Me2SO) was added in 1–2-μl aliquots to the sample cuvette containing 8 μm HO-2 in 1 ml of 100 mm potassium phosphate buffer, pH 7.4, and to the reference cuvette containing the same buffer. The stock hemin (Fe3+ heme) solution was prepared by dissolving hemin in 0.1 m NaOH and 5% Me2SO and filtration with a 0.2-μm syringe filter (Amicon, Beverly, MA). The heme concentration was calculated using an extinction coefficient at 385 nm of 58.4 mm−1 cm−1 (31).
To determine the binding affinity of reduced HO-2 for hemin, the as-isolated protein was incubated with a 50-fold molar excess of DTT in the anaerobic chamber for 30 min. DTT was then removed by dialyzing the protein in anaerobic buffer (50 mm Tris-HCl and 50 mm KCl, pH 7.4). Titration was performed as just described for the oxidized protein, except that it was performed under anaerobic conditions in serum-stoppered cuvettes.
To determine the binding affinity of HO-2 for ferrous heme, freshly prepared sodium dithionite (2 mm final concentration) was added to a stock solution of 200 μm Fe2+ heme in 20% Me2SO in the anaerobic chamber. Titrations with the reduced protein and Fe2+ heme were performed as described above in serum-stoppered cuvettes to maintain anaerobic conditions.
The heme titration data were plotted and fit to a one-binding site model to determine the dissociation constant (Equations 1 and 2),
| (Eq. 1) |
| (Eq. 2) |
where ΔA is the absorbance difference between sample and reference cuvettes; Δ∈ is the difference extinction coefficient between bound and free heme; and EL is the concentration of the HO-2·heme complex, which is calculated using the quadratic Equation 2, in which EO is the total HO-2 concentration, LO is the total heme concentration, and Kd is the dissociation constant.
EPR measurements were performed on a Bruker ESP 300E spectrometer recently upgraded to an EMX, operating at ∼ 9.39 GHz and equipped with an Oxford ITC4 temperature controller, a Hewlett-Packard Model 5340 automatic frequency counter to monitor microwave frequency, and a Bruker gaussmeter to determine the magnetic flux density. All of the EPR samples were prepared in 50 mm phosphate buffer at pH 7.4.
Protein Stability Measured by Differential Scanning Calorimetry (DSC)
Heat-induced unfolding was performed in a DSC microcalorimeter (MicroCal, LLC, Northhampton, MA). Purified protein was dialyzed against 1 × PBS, pH 7.4, to remove the Triton X-100, and a 0.2 mg/ml protein solution was degassed for 5 min at room temperature before loading into the cells. The scan was performed at a rate of 1 °C/min from 20 to 80 °C. Thermogram analysis was performed using Origin Version 7.0 software supplied with the instrument.
Results
The major difference between HO-1 and HO-2 is the lack of cysteine residues in HO-1 and the presence of three Cys-Pro or heme regulatory motifs (HRMs) in HO-2. To determine the function of the HRMs, we compared the biochemical properties of HO-2 variants in which the cysteine residues in the three HRMs were substituted with alanine, individually and in combination (Fig. 1). We refer to the two C-terminal HRMs as HRM1 and HRM2 and the one including residue 127 as HRM3. The comparisons were made among various HO-2 variants lacking the C-terminal membrane-spanning region (HO-2Δ289–316) because the full-length protein is fairly insoluble and undergoes cleavage, whereas the truncated forms of HO-2, like HO-1 (26), are soluble and stable. To generate HO-2Δ289–316, a TAA stop codon was inserted after position 288. All of the truncated HRM variants could be obtained in yields of 15–20 mg/liter of culture. Because the sequence between residues 240 and 295 in HO-2 contributes the major difference between HO-1 and HO-2, HO-2 was further truncated at position 264 to generate HO-2Δ265–316, which lacks both C-terminal HRMs. In addition, Cys127 was substituted with Ala in HO-2Δ265–316 to generate a variant that lacks all three Cys residues (C127A/Δ265–316).
Figure 1. HO-2 variants studied.

Two truncated forms of HO-2 lacking regions 289–316 and 265–316 and several HO-2 variants were generated. The Cys-Pro (CP) motifs at positions 265, 282, and 127 are designated HRM1, HRM2, and HRM3. The C127A/Δ265–316 variant was generated in HO-2Δ265–316, whereas the other Cys variants were generated in HO-2Δ289–316.
Effect of HRMs on HO-2 Stability
Similar amounts of purified HO-2 were recovered from cells expressing wild-type protein or any of the variants. Each of the purified proteins showed predominantly a single band when analyzed by SDS-PAGE, with a purity between 91 and 96% based on densitometric analysis (Fig. 2A). In addition, DSC experiments were carried out to evaluate the influence of HRMs on HO-2 stability. The DSC profiles for the variants overlay that for the wild-type protein and fit a non-two-state model (Fig. 3) with similar melting temperatures in the range of 52.4-53.7 °C (Table 1). These results indicate that neither the HRMs nor the sequence between the HRMs at the C terminus affects protein stability.
Figure 2. HO-2 expression and activity.

A, purified HO-2 proteins were subjected to SDS-PAGE. Lane 1, molecular mass markers; lane 2, 40 μg of HO-2Δ289–316; lane 3, 40 μg of C127A; lane 4, 40 μg of C127A/C282A; lane 5, 40 μg of C282A; lane 6, 40 μg of C265A; lane 7, 40 μg of C265A/C282A; lane 8, 40 μg of HO-2 Δ265–316; lane 9, 40 μg of C127A/Δ265–316. B, heme oxygenase activity was determined by calculating the rate of bilirubin synthesis (see “Experimental Procedures”). Bar 1, human full-length HO-2; bar 2, HO-2Δ289–316; bar 3, C127A; bar 4, C265A; bar 5, C282A; bar 6, C265A/C282A; bar 7, C127A/C282A; bar 8, HO-2Δ265–316; bar 9, C127A/Δ265–316. All measurements were done in triplicate. HO-2 variants were constructed and purified as described under “Experimental Procedures.”
Figure 3. DSC experiments of HO-2 and HRM variants.

All DSC data were fit to a non-two-state model. Solid lines, experimental data; dotted lines, fit of the DSC data to a non-two-state model. Trace a, HO-2Δ289–316; trace b, C127A; trace c, C265A; trace d, C282A; trace e, C127A/C282A. The fit parameters are shown in Table 1.
Table 1. DSC experiments.
The DSC experiments were performed with 2 mg/ml freshly purified HO-2 proteins in PBS, pH 7.4. The data were fitted with a non-two-state model.
| Protein | ΔH | Tm |
|---|---|---|
| kcal/mol | °C | |
| HO-2Δ289–316 | 120.2 ± 0.1 | 53.5 ± 0.03 |
| C127A | 104.8 ± 0.6 | 52.4 ± 0.04 |
| C265A | 118.0 ± 0.6 | 53.7 ± 0.03 |
| C282A | 123.8 ± 0.9 | 53.4 ± 0.02 |
| C127A/C282A | 113.6 ± 0.5 | 52.7 ± 0.03 |
Effect of HRMs on HO-2 Activity
The steady-state enzymatic activities of the various forms of HO-2 were determined by following biliverdin formation using the assay described under “Experimental Procedures.” In all experiments, 5% Me2SO was present in the heme stock solution (0.05% in the final assay mixture) to prevent heme aggregation. We established that the addition of Me2SO in the assay mixture at concentrations up to 0.2% had no effect on HO-2 activity. As shown in Fig. 2B, both full-length HO-2 and the HO-2Δ289–316 truncation variant, which lacks the membrane-spanning region, exhibited similar activities of ∼5.2 nmol/min/mg. Therefore, because the C-terminal membrane-binding region does not affect enzymatic activity, Cys substitutions were generated in the more soluble and stable HO-2Δ289–316 truncation variant to explore the function(s) of the HRMs in HO-2 (Fig. 2B). To simplify their descriptions, we have omitted the Δ289-316 designation from the variants; thus, substitution of Cys265 with Ala in HO-2Δ289–316 generated a variant that we labeled simply C265A. All of the Cys variants, including C265A/C282A, C127A, C265A, C282A, and C127A/C282A, exhibited similar heme degradation activities in the range of 5.0–5.5 nmol/min/mg. The HO-2Δ265–316 truncation variant, lacking the entire HRM1-HRM2 region, and C127A/Δ265–316, lacking all three Cys residues, had similar enzymatic activities of 5.5 and 5.3 nmol/min/mg, respectively. These results strongly indicate that HRM1, HRM2, and HRM3 do not affect steady-state HO-2 activity.
Evaluation of Heme Binding to the HRMs in HO-2
A previous study indicated that rat HO-2 binds three hemes: one heme at the active site (coordinated by His45) plus one each at the two C-terminal HRMs (24). However, the UV-visible spectra of the Fe(III), Fe(II), and Fe(II)-CO states of all the HRM variants are identical to those of the wild-type enzyme (Fig. 4, A–C). The spectra show a Soret peak at 406 nm and four long wavelength range peaks at 503, 532, 571, and 630 nm (Fig. 4A). The Fe(II) states exhibit a Soret peak at 430 nm and a long wavelength peak at 557 nm with a shoulder at 527 nm (Fig. 4B), whereas the Fe(II)-CO adducts show a Soret peak at 422 nm and two long wavelength peaks at 541 and 572 nm (Fig. 4C). These spectra, including the extinction coefficients, are very similar to those of the Fe(III), Fe(II), and Fe(II)-CO states of human HO-1 (32) and of myoglobin (33), which bind only one heme/monomer and do not contain any HRMs, strongly indicating that HO-2 binds only one heme/monomer.
Figure 4. Absorption spectra of HO-2-heme complexes.

The HO-2 concentration was 8 μm, and the same concentration of heme solution was used as a reference. The insets are expansions of the 475–650 nm range. A, oxidized HO-2·Fe3+ heme-complex; B, HO-2·Fe2+ heme complex; C, oxidized HO-2·Fe2+ heme-CO complex. Solid lines, HO-2Δ289–316; long dashed lines, C127A; medium dashed lines, C265A; short dashed lines, C282A; dotted lines, C265A/C282A; dashed/dotted lines, C127A/C282A; dashed/dotted/dotted lines, HO-2Δ265–316; dashed/dotted/dotted/dotted lines, C127A/Δ265–316. D, reduced HO-2Δ289–316·heme complexes. Solid line, HO-2·Fe3+ heme; dashed line, HO-2·Fe2+ heme; dashed/dotted line, HO-2·Fe2+ heme-CO.
To further assess the possibility of heme binding to the HRMs, a 5-fold excess of heme was incubated with the wild-type enzyme and each of the variants; unbound heme was removed by gel filtration chromatography; and the heme content was measured by the pyridine hemochrome assay (Fig. 5). Oxidized HO-2Δ289–316 and C282A at 1.58 and 1.51 μm, respectively, were found to bind ∼1.5 μm ferric heme. The other HO-2 variants also exhibited 1:1 binding of ferric heme (supplemental Table 1). In summary, the titration and pyridine hemochrome results strongly indicate that HO-2, like HO-1, can only bind one heme/monomer and that the HRMs do not bind additional heme.
Figure 5. Fe3+ heme binding to HO-2 by the pyridine hemochrome assay.
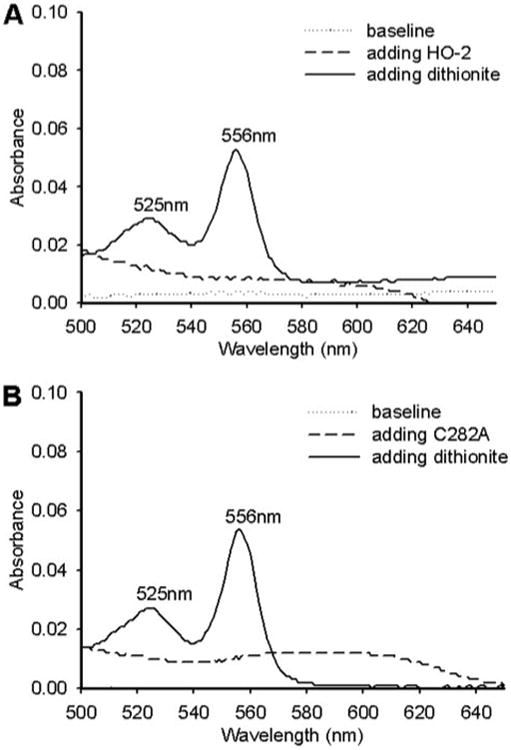
A, 1.58 μm HO-2Δ265–316; B, 1.51 μmC282A. Protein concentration was calculated by the rose bengal method. The heme concentration was determined by following the absorbance change at 556 nm (see “Experimental Procedures”).
As determined by titrations with ferric heme, DTT-reduced HO-2Δ289–316, like the oxidized protein, was saturated at a stoichiometry of 1 mol of heme/mol of monomeric protein (Fig. 6). Similarly, all other HO-2 variants exhibited saturation at a 1:1 ratio in the oxidized and DTT-reduced states (supplemental Fig. 4). Therefore, these results strongly indicate that both oxidized and reduced states of HO-2 bind only one heme.
Figure 6. Titration curves of HO-2Δ289–316 with Fe3+ and Fe2+ heme.

Titration curves were developed by monitoring the absorbance increases at 406 nm (Fe3+) and 430 nm (Fe2+). ○, 8 μm oxidized HO-2Δ289–316 titrated with Fe3+ heme in air; □, 8 μm reduced HO-2Δ289–316 titrated with Fe3+ heme under anaerobic conditions; △, 8 μm reduced HO-2Δ289–316 titrated with Fe2+ heme under anaerobic conditions. Kd values were calculated using a quadratic equation with a one-site binding model (see “Experimental Procedures”).
HRM1 and HRM2 Undergo Thiol/Disulfide Redox Interconversion
The three Cys residues at positions 256, 282, and 127 in the HO-2 sequence are part of HRM1, HRM2, and HRM3, respectively. To determine the redox state of these residues, we determined the number of free thiol groups in HO-2 and variants in their as-isolated (oxidized) and DTT-reduced states using the DTNB assay (Table 2). In all cases, DTT was removed before the DTNB assay. This assay was performed with native protein and with urea-denatured protein. In nearly all experiments, the full recovery of thiols required urea treatment, indicating that none of the Cys residues are completely accessible in the native state. For as-isolated HO-2Δ265–316, a single thiol group was detected; however, 3 thiols were measured for the DTT-reduced protein. The C127A variant was found to contain no free thiol groups in the oxidized state, but two in the DTT-reduced state. Correspondingly, HO-2Δ265–316 and the C265A/C282A variant, with only one Cys at position 127, contained one thiol group in both the oxidized and DTT-reduced states. Thus, the combined results of the DTNB titrations strongly indicate that as-isolated HO-2 contains an intramolecular disulfide bond between Cys265 and Cys282 to link HRM1 and HRM2.
Table 2. Quantification of free thiols in oxidized and reduced HO-2 by the DTNB assay.
Assays for oxidized proteins were performed in the air. Reduced proteins were generated by treatment with DTT in the anaerobic chamber, followed by removal of the excess DTT (see “Experimental Procedures”). HO-2 was incubated in the presence and absence of 8 m urea under aerobic or anaerobic conditions. All of the measurements were performed in triplicate with different amount of proteins. The average number of free thiols is summarized. NA, not applicable.
| Protein | Without DTT treatment | With DTT treatment | ||
|---|---|---|---|---|
|
|
|
|||
| −Urea | +Urea | −Urea | +Urea | |
| HO-2Δ289–316 | 0.41 ± 0.035 | 0.83 ± 0.020 | 2.11 ± 0.135 | 2.89 ± 0.295 |
| C127A | 0.08 ± 0.007 | 0.08 ± 0.008 | 1.56 ± 0.070 | 2.00 ± 0.035 |
| C265A | 0.60 ± 0.130 | 1.39 ± 0.035 | 1.57 ± 0.090 | 1.93 ± 0.030 |
| C282A | 0.93 ± 0.010 | 0.91 ± 0.08 | 1.90 ± 0.025 | 1.88 ± 0.005 |
| C265A/C282A | 0.35 ± 0.040 | 1.11 ± 0.060 | 0.63 ± 0.065 | 0.95 ± 0.055 |
| C127A/C282A | 0.04 ± 0.002 | 0.14 ± 0.085 | 0.82 ± 0.100 | 0.93 ± 0.005 |
| HO-2Δ265–316 | 0.58 ± 0.110 | 0.97 ± 0.100 | 0.53 ± 0.115 | 1.02 ± 0.020 |
| C127A/Δ265–316 | NA | NA | NA | NA |
Consistent with this conclusion, when the C265A variant was reduced with DTT, 1.93 free thiols were measured by the DTNB assay. However, the results with the oxidized C265A variant were more ambiguous, exhibiting 1.39 thiols, instead of 2.0 (Table 2), suggesting that, when HRM2 is absent, Cys282 has some ability to form a disulfide bond with Cys127. We excluded the possibility of intersubunit cross-links by performing nonreducing SDS-PAGE (supplemental Fig. 1). Even when these variants (or the wild-type protein) were treated with diamide, <5% of the protein was observed at the position of the dimer, and there was no evidence for the formation of higher oligomeric states.
The intramolecular disulfide bond formed between the C-terminal HRMs was confirmed by mass spectrometric analysis using one- and two-step alkylation protocols (supplemental Table 3). HO-2 was reacted with iodoacetamide in the first step to label the free cysteine thiols; the protein was then reduced with DTT and reacted with 4-vinylpyridine to label the cysteines that were initially linked by disulfide bonds. Samples were removed after both alkylation steps for nano-liquid chromatographic/tandem mass spectrometric analysis. After the one-step alkylation reaction, coverage of the HO-2 sequence was 73% for the oxidized protein and 81% for the reduced protein. After the two-step procedure, sequence coverage was 76%. In the first alkylation reaction, only Cys127 of oxidized HO-2 was S-carboxamidomethyl-labeled by iodoacetamide, and all three cysteines (Cys127, Cys265, and Cys282) of reduced HO-2 contained the S-carboxamidomethyl label. Correspondingly, with the two-step alkylation protocol, Cys127 was predominantly labeled by iodoacetamide, and Cys265 and Cys282 were S-4-vinylpyridylethyl-labeled by 4-vinylpyridine. Specifically, after the two-step procedure, 86% of the peptides containing Cys127 were labeled by iodoacetamide, and 94% of the peptides containing Cys265 or Cys282 were labeled by 4-vinylpyridine.
Surprisingly, for the C282A and C127A/C282A variants in the oxidized state, even in the presence of urea, the DTNB assay showed only 0.91 and0.14thiols (instead of 2.0 and 1.0), respectively (Table 2). However, after DTT treatment, 1.88 and 0.93 thiols were observed. As for the other variants, nonreducing SDS-PAGE experiments showed that <5% of these two variants were in a dimeric state. Thus, Cys265 in these oxidized HO-2 variants does not appear to be in the form of a thiolate or a disulfide because Cys282 is absent in both variants and because Cys265 is the only Cys residue in the one variant. However, the thiol state was recovered after treatment with DTT. These properties are consistent with those observed for cysteine sulfenate.
Thus, we performed experiments with 7-chloro-4-nitro-benz-2-oxa-1,3-diazole (NBD-Cl) to assess the possibility that Cys265 is present in the sulfenic acid form. Upon reaction with NBD-Cl, the oxidized C127A/C282A variant exhibited a peak at 352 nm (supplemental Fig. 2), which is characteristic of the Cys-S(O)-NBD derivative (34). Upon reduction with DTT, the 352 nm peak was markedly reduced, and a peak at 418 nm appeared, which is characteristic of the Cys-S-NBD adduct. The 418 nm peak is absent in the spectrum of the oxidized C127A/C282A variant, indicating that Cys265 is mostly oxidized. In addition, the 352 nm peak appears to be absent in the C127A/Δ265–316 variant (lacking all three Cys residues). We also have not seen evidence for a sulfenic acid derivative in variants that contain Cys282. These results indicate that, in the oxidized variant, Cys265 is present in the sulfenate form and can be reduced by DTT to the thiol. These properties are characteristic of cysteine sulfenates because the sulfinate and sulfonate are not reducible by DTT (34,35). Our results are consistent with Scheme 1, showing that, under oxidizing conditions, Cys265 can form a sulfenate that reacts with Cys282 to form the disulfide that is observed in the oxidized wild-type protein.
Scheme 1.

Proposed mechanism of intramolecular disulfide bond formation in HO-2 between HRM1 and HRM2.
Effect of Redox State of the HRMs on Heme Binding
The effect of the redox state of the HRMs on heme binding was determined. Note that “oxidized” and “reduced” will refer to the state of the disulfide bonds of the HRMs, and the oxidation state of the iron in the heme will be explicitly identified as (II) or (III). The UV-visible spectra of the oxidized Fe(III) (Fig. 4A) Fe(II) (Fig. 4B), and Fe(II)-CO (Fig. 4C) states of all of the HRM variants are identical to those of oxidized wild-type HO-2 and overlay those of the corresponding DTT-reduced proteins (supplemental Fig. 3). The extinction coefficients of HO-2 are presented in supplemental Table 2. Furthermore, the absorption spectra of the Fe(III), Fe(II), and Fe(II)-CO states of DTT-reduced HO-2Δ289–316 (Fig. 4D) are indistinguishable from those of the oxidized protein (Fig. 4, A–C). Thus, the UV-visible spectra of HO-2 in the Fe(III), Fe(II), and Fe(II)-CO states are independent of the redox state of the HRMs.
As described above, HO-2 binds only 1 mol of heme/mol of monomer in both the oxidized and reduced states. However, the titration curves of the oxidized and reduced states of HO-2 are noticeably different. The oxidized proteins showed a sharp break at the equivalence point, whereas the reduced enzymes exhibited a noticeable bend, indicating that oxidized HO-2 binds Fe3+ heme much more tightly than does the DTT-reduced protein. Thus, the dissociation constants (Kd) were measured for the oxidized and DTT-reduced states of HO-2Δ289–316 and each of the HRM variants.
Based on Fe3+ heme titrations for each of the HO-2 variants in the oxidized and reduced states (Fig. 2 and supplemental Fig. 3), Kd values were calculated based on a one-site binding model (Table 3). The Kd values of all the oxidized HO-2 proteins were very similar, varying from 0.028 to 0.050 μm. Because the Kd values were lower than the protein concentrations used in the titration, the data were analyzed by a quadratic equation routinely used in such cases in which the free and bound hemes are taken into account. To ensure that the Kd values are valid, we repeated our experiments at a 10-fold lower HO-2 concentration (1.0 μm) and obtained the same Kd values (data not shown). The hemin binding affinity of DTT-reduced HO-2Δ289–316 (Kd = 0.348 μm) was 10-fold lower than that of the oxidized protein. The oxidized C127A variant exhibited the same 10-fold change in heme affinity, with Kd values of 0.031 and 0.323 μm in the oxidized and reduced states, respectively. However, the oxidized and reduced states of HO-2Δ265–316, C127A/Δ265–316, C265A, C282A C265A/C282A, and C127A/C282A, all of which lack the intramolecular disulfide bond between HRM1 and HRM2, showed nearly equal binding affinity for ferric heme. These results strongly indicate that HRM1 and HRM2 may act as a redox switch that controls ferric heme binding to HO-2. Whether or not this switch might have physiological relevance is addressed under “Discussion.”
Table 3. Heme affinity of HO-2.
Ferric and ferrous heme titrations were performed with HO-2 proteins in oxidized and reduced states under aerobic and anaerobic conditions, respectively. A freshly prepared heme solution was added to 8 μm HO-2 solution, pH 7.4, and the absorbance spectra were recorded. The absorbance value at the Soret peak (406 nm for ferric heme titration and 430 nm for ferrous heme titration) was plotted versus heme concentration. Kd was calculated using the quadratic equation with a one-site binding model (see “Experimental Procedures”). All of the measurements were done in triplicate.
| Protein | Ferric heme titration | Ferrous heme titration reduced form Kd | |
|---|---|---|---|
|
| |||
| Oxidized form Kd | Reduced form Kd | ||
| μm | μm | ||
| HO-2Δ289–316 | 0.033 ± 0.015 | 0.348 ± 0.075 | 0.189 ± 0.051 |
| C127A | 0.031 ± 0.022 | 0.323 ± 0.097 | 0.184 ± 0.042 |
| C265A | 0.029 ± 0.020 | 0.032 ± 0.029 | 0.227 ± 0.066 |
| C282A | 0.030 ± 0.016 | 0.060 ± 0.035 | 0.347 ± 0.073 |
| C265A/C282A | 0.045 ± 0.014 | 0.040 ± 0.015 | 0.318 ± 0.038 |
| C127A/C282A | 0.033 ± 0.014 | 0.030 ± 0.016 | 0.159 ± 0.050 |
| HO-2Δ265–316 | 0.029 ± 0.014 | 0.020 ± 0.011 | 0.584 ± 0.108 |
| C127A/Δ265–316 | 0.050 ± 0.016 | 0.023 ± 0.007 | 0.506 ± 0.057 |
Because the redox potential of the Fe3+/Fe2+ heme couple is near the ambient intracellular potential (see “Discussion”) and because ferrous heme is the form that binds O2 in the HO reaction, we determined the binding affinity of the HO-2 variants for ferrous heme (Table 3). We were able to perform these titrations only with the reduced HO-2 proteins because any reductants present in the heme solution also reduce the disulfide bonds in HO-2. Surprisingly, unlike the titrations of reduced HO-2 with Fe3+ heme, all of the reduced HRM variants exhibited similar Kd values for ferrous heme within a range of 0.16 -0.58 μm. Thus, the redox state of the HRMs appears to affect the affinity of HO-2 for only ferric (but not ferrous) heme. The possible implications of these surprising results are described below.
Redox Changes in the HRMs Affect the Spin State of Ferric Heme
EPR measurements were performed to characterize the axial ligand for the ferric heme in oxidized (Fig. 7A) and reduced (Fig. 7B) HO-2 and the HRM variants. All of the EPR measurements were performed at 10 K because the low-spin heme relaxes very fast. The spectra of oxidized HO-2Δ289–316 indicate a predominantly six-coordinate high-spin state with g-values for the low-field feature of the high-spin component at 5.80 and for the low-spin component at 2.87,2.26, and 1.99 (Fig. 7A). These values are indicative of ligation by His and water (36), an in HO-1 (37). The EPR spectra of other oxidized variants are identical to those of oxidized HO-2Δ289–316.
Figure 7. EPR spectra of ferric heme complexed with oxidized and reduced HRMs.

Samples were prepared at a 1:1 ratio of Fe3+ heme and HO-2 as described under “Experimental Procedures.” EPR measurements were performed at 10 K with a microwave frequency of 9.39 GHz, a microwave power of 1 milliwatt, and a field modulation amplitude of 10.15 G at 100 kHz. A, samples of Fe3+ heme plus oxidized HO-2 prepared in air; B, samples of Fe3+ heme plus reduced HO-2 prepared under anaerobic conditions (see “Experimental Procedures”).
Compared with the EPR spectra of oxidized HO-2, those of the DTT-reduced enzyme are more complicated (Fig. 7B). Although C265A/C282A, C265A, HO-2Δ265–316, and C127A/Δ265–316 are predominantly in the high-spin state, the EPR spectra of reduced HO-2Δ289–316 and the C127A/C282A variant exhibit a mixture of high-spin heme (g-value at 5.78) and low-spin heme (g-values at 2.41, 2.26, and 1.91). The DTT-reduced forms of the C127A and C282A variants also exhibit a large proportion of low-spin Fe3+ heme, with g-values at 2.41, 2.26, and 1.91. These values are indicative of thiolate/water ligation (36). Thus, when the HRMs are in the disulfide state, the low- and high-spin ferric hemes appear to have His and water (or OH) ligands (g-values at 2.87, 2.26, and 1.99), as concluded previously on the basis of resonance Raman spectroscopy (26, 38). It is only upon reduction of the HRM that the EPR spectra of the low-spin heme switch to the values characteristic of thiol ligation (g-values at 2.41, 2.26, and 1.91).
Discussion
HO-1 and HO-2 differ in their tissue distributions and expression patterns. HO-1 is inducibly expressed in most mammalian tissues, whereas HO-2 is constitutively expressed in a narrow range of tissues, with high levels in the brain and testes (11). HO-2 has been assigned roles in oxygen sensing (10, 13), mediating oxidative stress in neurons (14), and regulating cerebral blood flow and vascular tone (15). At a protein level, HO-1 and HO-2 exhibit 76% similarity, including related C-terminal membrane-anchoring regions (11), the major difference between them being the presence of Cys residues within three HRMs in HO-2. It had been proposed that the HRMs in HO-2 (24) and other proteins serve as heme-binding sites (4,16) and control activity, protein stability, and/or mitochondrial import (4, 5,17–23). To determine what, if any, special properties the HRMs in HO-2 confer, we generated a series of HO-2 variants and compared their biochemical properties in the as-isolated (oxidized) and DTT-reduced states. Individual substitutions were made in HRM1 (C265A), HRM2 (C282A), and HRM3 (C127A), along with double mutations (C127A/C282A and C265A/C282A) and a truncation resulting in deletion of the entire sequence covering HRM1 and HRM2 (HO-2Δ265–316). Finally, a variant lacking all three HRMs (C127A/Δ265–316) was generated.
As-isolated full-length HO-2, the HO-2Δ289–316 truncation variant, and HO-2 variants with Cys-to-Ala substitutions in the HRMs exhibited similar specific activities of heme degradation at saturating heme concentrations (Fig. 2). An earlier study of Cys and Pro substitutions in HRM1 and HRM2 also concluded that the HRMs do not affect the activity of HO-2 (24). These variants also exhibited UV-visible spectra in the Fe(III), Fe(II), and Fe(II)-CO states (Fig. 4) that are undistinguishable from those of HO-1 (32, 39). Based on pyridine hemochrome experiments (Fig. 5) and heme titrations (Fig. 6 and Table 3), HO-2 and all the HRM variants saturate at a 1:1 complex with Fe3+ or Fe2+ heme.
Our results demonstrate that the HRMs do not constitute a heme-binding pocket, which contrasts with a report in which it was concluded that rat HO-2 binds three hemes, one at the active site and one each at HRM1 and HRM2 (24). This conclusion was based on three results. First, a variant in which the Cys residues in HRM1 and HRM2 were substituted with Ala was reported to bind negligible heme, indicating that heme binding (apparently even to the active site) was dependent upon the HRMs. Second, pyridine hemochrome experiments indicated binding of 3 mol of heme/mol of HO-2. Finally, the UV-visible spectrum of the wild-type protein was slightly blue-shifted relative to that of the double variant, indicating a different mode of heme binding by the HRM. However, as shown in Fig. 6 and Table 3, in their oxidized states, the wild-type protein and a series of variants in which each of the HRMs were substituted singly, doubly, and triply all bound a single heme with similar affinities and exhibited absorption spectra in the Fe(III), Fe(II), and Fe(II)-CO states that were indistinguishable from that of HO-2 with all HRMs intact (Fig. 4).
One might consider that the difference is that this study was performed with the human enzyme, whereas the previous study (24) were performed with the rat enzyme. However, the human and rat enzymes share 90% identity, including strict conservation of the nine amino acids within HRM1 (MRKCPFYAA) and the 16 residues that constitute HRM2 (CPFRTAMAVL-RKPSKQ). In summary, we agree with the conclusion of McCoubrey et al. (24) that the HRMs serve a regulatory role, but are confident that these motifs do not bind additional hemes.
As mentioned above, the HRMs in some systems influence protein stability. However, all of the HRM variants studied here could be purified with similar yields of 15–20 mg/liter of culture and exhibit similar melting curves as assessed quantitatively by DSC measurements. These experiments were performed with the apoenzyme state (lacking heme), in which the variants might be less stable than when heme is bound. Therefore, the presence or absence of any or all of the HRMs had no effect on stability (Figs. 2A and 3). Even removal of the entire sequence containing HRM1 and HRM2 did not affect stability.
Thus, the HRMs have no effect on the activity, heme stoichiometry, or stability of HO-2. However, our results indicate that the C-terminal HRMs (HRM1 and HRM2) constitute a thiol/disulfide redox switch that regulates heme affinity and spin state. The oxidized variants exhibited similar Kd values for Fe3+ heme of ∼0.03 μm irrespective of the presence or absence of any of the three HRMs, and all of the HRM variants exhibited a similar affinity for Fe2+ heme. However, the affinity for Fe3+ heme varied 17-fold among the DTT-treated HO-2 variants (Table 3). This Kd difference was confirmed by performing the titration experiments with 1 μm HO-2 proteins (data not shown). When both Cys265 of HRM1 and Cys282 of HRM2 were present, the Kd for Fe3+ heme increased from 0.03 μm in the oxidized state to ∼0.35 μm in the DTT-reduced protein. Mutation of either Cys265 or Cys282 rendered the protein redox-in-active, with a Kd of ∼0.03 μm in both the oxidized and reduced states.
We conducted several experiments to determine the origin of the redox dependence of heme binding. Based on DTNB titrations of HO-2 and variants carrying single, double, or triple mutations in the HRMs (Table 2), it is clear that human oxidized HO-2 contains an intramolecular disulfide bond between Cys265 of HRM1 and Cys282 of HRM2. This intramolecular disulfide bond was confirmed by a double labeling method in which free Cys thiolate residues are trapped in the first step and disulfide-bonded residues are captured in the second labeling step after reduction by DTT (supplemental Table 3).
Variants with substitutions at Cys265 or Cys282 could not form the disulfide cross-link and exhibited the same Kd (∼0.03 μm) for Fe3+ heme in the oxidized and reduced states. This thiol/disulfide redox switch is likely to be physiologically important because it shifts the Kd for ferric heme into a range (∼0.35 μm) that is well above the concentration of the “free” or “regulatory” heme pool. This value has been estimated at 0.1 μm or below in reticulocytes (40) and erythrocytes (41). The free heme pool maybe even lower than 0.1 μm because of the potential dissociation of heme from proteins under assay conditions (42). Based on various factors, including the regulatory properties and Fenton reactivity of heme in the cell, it has been estimated that the free heme pool in cells is likely to be in the 0.03 μm range (5). Thus, elevation of the Kd into the 0.3 μm range would be expected to impact heme homeostasis by decreasing intracellular HO-2 activity by ∼5-fold.3 We did not observe this effect in the standard HO-2 assay at saturating heme concentration (20 μm) (Fig. 2), which is well above the Kd measured here and the Km (21).
Our results provide insight into how the intramolecular disulfide bond between HRM1 and HRM2 in the C terminus of HO-2 is formed. A mechanism is proposed in Scheme 1 in which Cys265 of HRM1 is oxidized to a sulfenic acid, which undergoes nucleophilic attack by Cys282 to eliminate water and to form the disulfide bond. This scheme is based on several observations. As shown in Table 2, only 0.14 thiols were measured by DTNB titration of the C127A/C282A variant; however, after reduction with DTT, 1.0 free thiol was recovered. Experiments with NBD-Cl, which forms spectrally discrete adducts with Cys-SH (λmax = 418 nm) and Cys-SOH (λmax = 352 nm) (34), indicated that the oxidized C127A/C282A variant contained Cys265 sulfenate and that, after treatment with DTT, Cys265 -SOH was reduced to Cys265 -SH (supplemental Fig. 1). Because cysteine sulfinates and sulfonates are not reducible by DTT (35), these experiments indicate that Cys265 is stabilized quantitatively in the sulfenate form when Cys282 is absent. DTNB titrations of various HRM mutants also showed that an intramolecular disulfide bond is formed between HRM1 and HRM2 when Cys265 and Cys282 are both present. For example, oxidized C127A contained no free thiols, and the oxidized variants with all three HRMs intact contained ∼1.0 thiol. Scheme 1 also shows a bifurcation in which Cys265 -SOH can undergo further oxidation to the sulfinate and sulfonate forms. This is based on the known extreme reactivity of Cys-SOH (35) and mass spectrometric analysis of the C127A/C282A variant, in which the C-terminal peptide containing Cys265 has a mass consistent with formation of Cys265 -SO3 (supplemental Fig. 5). We suggest that Cys265 in the intact protein forms an unusually stable sulfenate and that the oxidation observed in the mass spectrometric experiments occurs during proteolysis or another step(s) in preparation of samples for mass spectroscopic analysis.
Besides affecting the Kd for Fe3+ heme, reduction of the disulfide bond between the Cys residues of HRM1 and HRM2 alters the spin state distribution for the ferric heme, as observed by low-temperature EPR. Although only the high-spin component was observed for the oxidized (containing the S–S bond) protein, the DTT -reduced enzyme exhibited a significant amount of low-spin ferric heme, with g-values at 2.41, 2.26, and 1.91. It appears that Cys265 exerts the major effect on the spin state equilibrium because only the high-spin component was observed when the C265A variant was treated with DTT or when the C-terminal HRMs were truncated. On the other hand, DTT-reduced wild-type HO-2 or any of the HRM variants in which Cys265 is intact (including C127A/C282A, in which only Cys265 is present) exhibited a large proportion of low-spin heme. This spin state change was most noticeable at low temperatures; however, we observed a longer wavelength shoulder in the UV-visible spectra that increased in intensity as the temperature was lowered from 25 to 5 °C (data not shown), perhaps reflecting the appearance of the low-spin heme.
The g-values at 2.41, 2.26, and 1.91 for the low-spin heme observed in HO-2 (with HRM1 and HRM2 reduced) are commonly accepted values for a thiol- and water (or hydroxide)-ligated heme (36,43). Because this spin state conversion was not observed in any of the variants containing C265A, we speculate that a ligand switch may occur in HO-2 in which the Cys265 thiolate can displace His45 as a heme ligand. Accordingly, the H45C variant of HO-2 exhibits similar g-values at 2.41, 2.26, and 1.91, which match those of the H25C variant of HO-1, in which thiol/heme ligation has been shown by several methods (44). One apparent difference is that the high-spin components of H25C and H45C exhibit highly rhombic g-values at 8, 4, and 2, like those of cytochrome P450 (43,45), whereas the g-values are near 6 for the high-spin component of reduced wild-type HO-2. In summary, although the spin state change upon reduction of the disulfide bond linking HRM1 and HRM2 is obvious, the assignment of thiol(ate) ligation for the reduced state of HO-2 is considered tenuous because there is no indication of thiol ligation in the room temperature UV-visible spectra in the Fe(III), Fe(II), and Fe(II)-CO states. One possibility is that the equilibrium between Cys265 -Fe3+ and His45 -Fe3+ favors only Cys ligation at low temperatures. Perhaps at some point in the oxygenation mechanism, other factors cause a shift to the thiol-ligated heme, which would be interesting because it would generate a ligation state of HO-2 that is similar to that of P450. However, further spectroscopic studies are required to assign the coordination state of the low-spin ferric heme when the HRMs are reduced.
We speculate that the disulfide bond between HRM1 and HRM2 protects and ensures reversibility of the redox switch of HO-2, protecting Cys265 against overoxidation. It appears that the redox switch is a fairly recent evolutionary development, occurring ∼250 million years ago, because HRM1 and HRM2 co-occur only in amniotes (Fig. 8). HRM1 is found in all HO-2 enzymes, which emerged with the jawed vertebrates; however, HRM2 is lacking in ray fish and amphibians, suggesting that the thiol/disulfide redox switch is present in all amniotes. Perhaps this redox switch involving HRM1 and HRM2 provided a selective advantage for amniotes that improved their ability to regulate intracellular oxygen levels as they moved from water onto dry land, where they would be exposed to higher O2 concentrations. In response, organisms would need to regulate cellular oxygen concentrations to optimize respiration rates while preventing oxidative stress. HO-2 is linked to oxygen sensing in the carotid body by influencing the activity of the BK channel, a Ca2+ -activated potassium channel (10). We speculate that the thiol redox switch contributes to the role of HO-2 as an oxygen sensor. Under hypoxic conditions, the thiol/disulfide switch could influence the activity of the BK channel in several ways. The most obvious effect is that disulfide bond reduction increases the Kd of HO-2 for heme to a value greater than the free heme pool, which would lower its heme degradation activity, causing an increase in free heme and a decrease in CO levels. The increase in the free heme pool could directly inhibit BK channel activity because the channel is strongly inhibited by Fe3+ heme (Ki ∼ 0.1 μm) (46). Furthermore, the decrease in CO levels would leave the BK channel-bound heme in a more inhibitory form because interaction of CO with the bound heme on the BK channel converts heme from an inhibitor to an activator of potassium channel function (46, 47). Inhibition of the BK channel leads to depolarization of the glomus cell membrane in the carotid body, which signals the respiratory system to increase ventilation rates. Return to normoxic conditions could regenerate the HRM1-HRM2 disulfide bond of HO-2, which would lower its Kd for heme, thus increasing heme degradation activity and elevating CO concentrations. Elevation of CO levels would to lead to activation of the BK channel, resulting in hyperpolarization of the glomus cells, signaling the respiratory system to lower ventilation rates. Another mechanism by which HO-2 could influence BK channel function relates to recent evidence supporting the involvement in hypoxia signaling of a cysteine-rich STREX (stress-regulated exon) (48) domain that is located within the C-terminal soluble portion of the BK channel α-subunit (49). The STREX domain is located <20 amino acids from the proposed heme-binding domain. Interestingly, the Cys-Ser-Cys sequence within the STREX domain is highly conserved from fish to man, like the HRMs of HO-2. Thus, we speculate that the redox-active HRMs of HO-2 may interact with the STREX domain of the BK channel. Accordingly, oxidation of Cys residues in the BK channel decreases its activity (50). One or more of the effects described above could lead to activation of the BK channel under normoxic conditions and to inhibition under hypoxic conditions. The immediate effects of hypoxia described above could be complemented by decreased expression of HO-2 in various human cell lines under hypoxic conditions (51).
Figure 8.
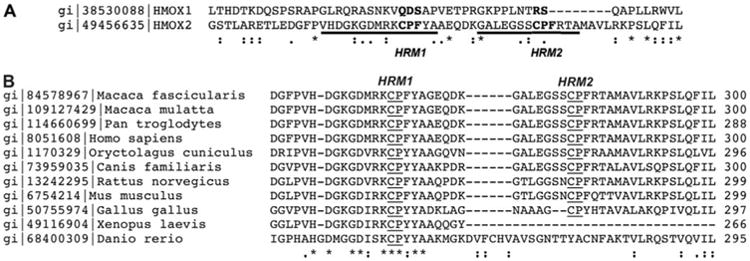
Alignment of selected HO-2 and HO-1 sequences.
Our results provide strong evidence for a thiol/disulfide switch involving HRM1 and HRM2 of HO-2 that regulates heme binding affinity. We propose that this redox-linked alteration in HO-2 heme affinity affects intracellular heme and CO levels. We speculate that the redox switch could have important physiological roles, including the ability of organisms to regulate intracellular heme and oxygen concentrations.
Supplementary Material
Acknowledgments
We thank Dr. Mahin D. Maines for donating the human full-length HO-2 cDNA in pGEX-4T-2 and Dr. Bettie Sue Masters for providing P450 reductase. We also thank Dr. Mark Wilson (University of Nebraska) for help in performing the DSC experiments and Katie Carnes for generating the C127A/C282A variant and for performing some of the heme binding experiments on this variant. We thank Ashraf Raza for help with the mass spectrometric work.
Footnotes
This work was supported by a seed grant from National Institutes of Health Center Grant 1P20RR17675 to the University of Nebraska, and the mass spectrometry and calorimetry instruments were purchased from the same Center grant. The costs of publication of this article were defrayed in part by the payment of page charges. This article must therefore be hereby marked “advertisement” in accordance with 18 U.S.C. Section 1734 solely to indicate this fact.
The on-line version of this article (available at http://www.jbc.org) contains supplemental Figs. S1-5 and Tables S1-3.
The abbreviations used are: HO, heme oxygenase; HRMs, heme regulatory motifs; GST, glutathione S-transferase; PBS, phosphate-buffered saline; DTNB, 5,5′-dithiobis(nitrobenzoic acid); DTT, dithiothreitol; DSC, differential scanning calorimetry; NBD-Cl, 7-chloro-4-nitrobenz-2-oxa-1,3-diazole.
This follows from the relationship that the fractional saturation (F) of heme by oxidized and reduced HO-2 will equal the following: F = (Kd + [heme])ox/(Kd + [heme])red = (0.03 + 0.03)/(0.3 + 0.03).
References
- 1.Maines MD. Antioxid Redox Signal. 2004;6:797–801. doi: 10.1089/ars.2004.6.797. [DOI] [PubMed] [Google Scholar]
- 2.Maines MD. Physiology (Bethesda) 2005;20:382–389. doi: 10.1152/physiol.00029.2005. [DOI] [PubMed] [Google Scholar]
- 3.Sassa S. Antioxid Redox Signal. 2006;38:138–155. [Google Scholar]
- 4.Qi Z, Hamza I, O'Brian MR. Proc Natl Acad Sci U S A. 1999;96:13056–13061. doi: 10.1073/pnas.96.23.13056. [DOI] [PMC free article] [PubMed] [Google Scholar]
- 5.Ogawa K, Sun J, Taketani S, Nakajima O, Nishitani C, Sassa S, Hayashi N, Yamamoto M, Shibahara S, Fujita H, Igarashi K. EMBO J. 2001;20:2835–2843. doi: 10.1093/emboj/20.11.2835. [DOI] [PMC free article] [PubMed] [Google Scholar]
- 6.Dioum EM, Rutter J, Tuckerman JR, Gonzalez G, Gilles-Gonzalez MA, McKnight SL. Science. 2002;298:2385–2387. doi: 10.1126/science.1078456. [DOI] [PubMed] [Google Scholar]
- 7.Baker HM, Anderson BF, Baker EN. Proc Natl Acad Sci U S A. 2003;100:3579–3583. doi: 10.1073/pnas.0637295100. [DOI] [PMC free article] [PubMed] [Google Scholar]
- 8.Kim HP, Ryter SW, Choi AM. Annu Rev Pharmacol Toxicol. 2006;46:411–449. doi: 10.1146/annurev.pharmtox.46.120604.141053. [DOI] [PubMed] [Google Scholar]
- 9.Baranano DE, Snyder SH. Proc Natl Acad Sci U S A. 2001;98:10996–11002. doi: 10.1073/pnas.191351298. [DOI] [PMC free article] [PubMed] [Google Scholar]
- 10.Williams SE, Wootton P, Mason HS, Bould J, Iles DE, Riccardi D, Peers C, Kemp PJ. Science. 2004;306:2093–2097. doi: 10.1126/science.1105010. [DOI] [PubMed] [Google Scholar]
- 11.Maines MD. Annu Rev Pharmacol Toxicol. 1997;37:517–554. doi: 10.1146/annurev.pharmtox.37.1.517. [DOI] [PubMed] [Google Scholar]
- 12.Maines MD, editor. Heme Oxygenase: In Clinical Applications and Functions. CRC Press LLC; Boca Raton, FL: 1992. [Google Scholar]
- 13.Hoshi T, Lahiri S. Science. 2004;306:2050–2051. doi: 10.1126/science.1107069. [DOI] [PubMed] [Google Scholar]
- 14.Regan RF, Chen J, Benvenisti-Zarom L. BMC Neurosci. 2004;5:34. doi: 10.1186/1471-2202-5-34. [DOI] [PMC free article] [PubMed] [Google Scholar]
- 15.Galbraith R. Proc Soc Exp Biol Med. 1999;222:299–305. doi: 10.1177/153537029922200313. [DOI] [PubMed] [Google Scholar]
- 16.Huang TJ, McCoubrey WK, Jr, Maines MD. Antioxid Redox Signal. 2001;3:685–696. doi: 10.1089/15230860152543023. [DOI] [PubMed] [Google Scholar]
- 17.Yang J, Ishimori K, O'Brian MR. J Biol Chem. 2005;280:7671–7676. doi: 10.1074/jbc.M411664200. [DOI] [PubMed] [Google Scholar]
- 18.Yang J, Panek HR, O'Brian MR. Mol Microbiol. 2006;60:209–218. doi: 10.1111/j.1365-2958.2006.05087.x. [DOI] [PubMed] [Google Scholar]
- 19.Uma S, Matts RL, Guo Y, White S, Chen JJ. Eur J Biochem. 2000;267:498–506. doi: 10.1046/j.1432-1327.2000.01021.x. [DOI] [PubMed] [Google Scholar]
- 20.Chefalo PJ, Oh J, Rafie-Kolpin M, Kan B, Chen JJ. Eur J Biochem. 1998;258:820–830. doi: 10.1046/j.1432-1327.1998.2580820.x. [DOI] [PubMed] [Google Scholar]
- 21.Munakata H, Sun JY, Yoshida K, Nakatani T, Honda E, Hayakawa S, Furuyama K, Hayashi N. J Biochem (Tokyo) 2004;136:233–238. doi: 10.1093/jb/mvh112. [DOI] [PubMed] [Google Scholar]
- 22.Hon T, Hach A, Lee HC, Cheng T, Zhang L. Biochem Biophys Res Commun. 2000;273:584–591. doi: 10.1006/bbrc.2000.2995. [DOI] [PubMed] [Google Scholar]
- 23.Lee HC, Hon T, Lan C, Zhang L. Mo Cell Biol. 2003;23:5857–5866. doi: 10.1128/MCB.23.16.5857-5866.2003. [DOI] [PMC free article] [PubMed] [Google Scholar]
- 24.McCoubrey WK, Jr, Huang TJ, Maines MD. J Biol Chem. 1997;272:12568–12574. doi: 10.1074/jbc.272.19.12568. [DOI] [PubMed] [Google Scholar]
- 25.Sambrook J, Fritsch EF, Maniatis T. Molecular Cloning: A Laboratory Manual. 2nd. Cold Spring Harbor Laboratory; Cold Spring Harbor, NY: 1989. [Google Scholar]
- 26.Ishikawa K, Matera KM, Zhou H, Fujii H, Sato M, Yoshimura T, Ikeda-Saito M, Yoshida T. J Biol Chem. 1998;273:4317–4322. doi: 10.1074/jbc.273.8.4317. [DOI] [PubMed] [Google Scholar]
- 27.Berry EA, Trumpower BL. Anal Biochem. 1987;161:1–15. doi: 10.1016/0003-2697(87)90643-9. [DOI] [PubMed] [Google Scholar]
- 28.Ellman GL. Arch Biochem Biophys. 1958;74:443–450. doi: 10.1016/0003-9861(58)90014-6. [DOI] [PubMed] [Google Scholar]
- 29.Bulaj G, Kortemme T, Goldenberg DP. Biochemistry. 1998;37:8965–8972. doi: 10.1021/bi973101r. [DOI] [PubMed] [Google Scholar]
- 30.Elliott JI, Brewer JM. Arch Biochem Biophys. 1978;190:351–357. doi: 10.1016/0003-9861(78)90285-0. [DOI] [PubMed] [Google Scholar]
- 31.Kirschner-Zilber I, Rabizadeh E, Shaklai N. Biochim Biophys Acta. 1982;690:20–30. doi: 10.1016/0005-2736(82)90234-6. [DOI] [PubMed] [Google Scholar]
- 32.Sun J, Wilks A, Ortiz de Montellano PR, Loehr TM. Biochemistry. 1993;32:14151–14157. doi: 10.1021/bi00214a012. [DOI] [PubMed] [Google Scholar]
- 33.Dou Y, Admiraal S, Ikeda-Saito M, Krzywda S, Wilkinson A, Li T, Olson J, Prince R, Pickering I, George GN. J Biol Chem. 1995;270:15993–16001. doi: 10.1074/jbc.270.27.15993. [DOI] [PubMed] [Google Scholar]
- 34.Ellis HR, Poole LB. Biochemistry. 1997;36:15013–15018. doi: 10.1021/bi972191x. [DOI] [PubMed] [Google Scholar]
- 35.Claiborne A, Mallett TC, Yeh JI, Luba J, Parsonage D. Adv Protein Chem. 2001;58:215–276. doi: 10.1016/s0065-3233(01)58006-7. [DOI] [PubMed] [Google Scholar]
- 36.Blumberg WE, Peisach J. In: Probes of Structure and Function of Macromolecules and Membranes: Probes of Enzymes and Hemoproteins. Chance B, Yonetani T, Mildvan AS, editors. Vol. 2. Academic Press Inc.; New York: 1971. pp. 215–229. [Google Scholar]
- 37.Takahashi S, Wang J, Rousseau D, Ishikawa K, Yoshida T, Host J, Ikeda-Saito M. J Biol Chem. 1995;270:1010–1014. [PubMed] [Google Scholar]
- 38.Ishikawa K, Takeuchi N, Takahashi S, Matera KM, Sato M, Shibahara S, Rousseau DL, Ikeda-Saito M, Yoshida T. J Biol Chem. 1995;270:6345–6350. doi: 10.1074/jbc.270.11.6345. [DOI] [PubMed] [Google Scholar]
- 39.Migita CT, Zhang X, Yoshida T. Eur J Biochem. 2003;270:687–698. doi: 10.1046/j.1432-1033.2003.03421.x. [DOI] [PubMed] [Google Scholar]
- 40.Garrick MD, Scott D, Kulju D, Romano MA, Dolan KG, Garrick LM. Biochim Biophys Acta. 1999;1449:125–136. doi: 10.1016/s0167-4889(99)00006-3. [DOI] [PubMed] [Google Scholar]
- 41.Liu SC, Zhai S, Palek J. Blood. 1988;71:1755–1758. [PubMed] [Google Scholar]
- 42.Sassa S. Antioxid Redox Signal. 2004;6:819–824. doi: 10.1089/ars.2004.6.819. [DOI] [PubMed] [Google Scholar]
- 43.Dawson JH, Sono M. Chem Rev. 1987;87:1255–1276. [Google Scholar]
- 44.Liu Y, Moenne-Loccoz P, Hildebrand DP, Wilks A, Loehr TM, Mauk AG, Ortiz de Montellano PR. Biochemistry. 1999;38:3733–3743. doi: 10.1021/bi982707s. [DOI] [PubMed] [Google Scholar]
- 45.LeLean JE, Moon N, Dunham WR, Coon MJ. Biochem Biophys Res Commun. 2000;276:762–766. doi: 10.1006/bbrc.2000.3539. [DOI] [PubMed] [Google Scholar]
- 46.Tang XD, Xu R, Reynolds MF, Garcia ML, Heinemann SH, Hoshi T. Nature. 2003;425:531–535. doi: 10.1038/nature02003. [DOI] [PubMed] [Google Scholar]
- 47.Jaggar JH, Li A, Parfenova H, Liu J, Umstot ES, Dopico AM, Leffler CW. Circ Res. 2005;97:805–812. doi: 10.1161/01.RES.0000186180.47148.7b. [DOI] [PMC free article] [PubMed] [Google Scholar]
- 48.Xie J, McCobb DP. Science. 1998;280:443–446. doi: 10.1126/science.280.5362.443. [DOI] [PubMed] [Google Scholar]
- 49.McCartney CE, McClafferty H, Huibant JM, Rowan EG, Shipston MJ, Rowe IC. Proc Natl Acad Sci U S A. 2005;102:17870–17876. doi: 10.1073/pnas.0505270102. [DOI] [PMC free article] [PubMed] [Google Scholar]
- 50.Zhang G, Xu R, Heinemann SH, Hoshi T. Biochem Biophys Res Commun. 2006;342:1389–1395. doi: 10.1016/j.bbrc.2006.02.079. [DOI] [PubMed] [Google Scholar]
- 51.Zhang Y, Furuyama K, Kaneko K, Ding Y, Ogawa K, Yoshizawa M, Kawamura M, Takeda K, Yoshida T, Shibahara S. FEBS J. 2006;273:3136–3147. doi: 10.1111/j.1742-4658.2006.05319.x. [DOI] [PubMed] [Google Scholar]
Associated Data
This section collects any data citations, data availability statements, or supplementary materials included in this article.