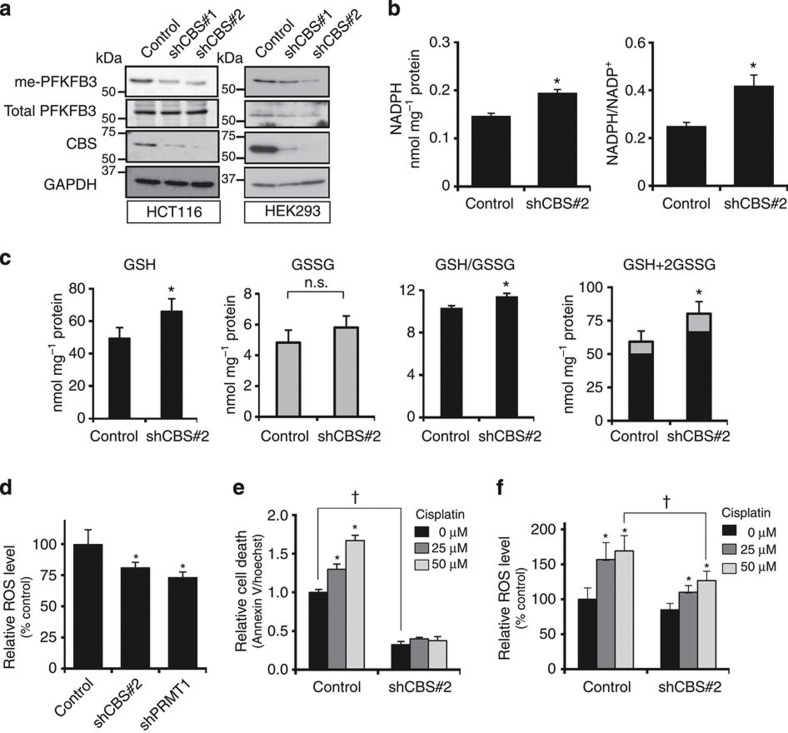
Figure 7. CBS knockdown suppresses PFKFB3 methylation to cause chemoresistance.
(a) Evaluations of non-overlapping shRNAs against human CBS (shCBS#1 and #2) on PFKFB3 R131/134 methylation in HCT116 (left) and HEK293 (right). Lysates were immunoblotted with anti-dimethyl-PFKFB3 (R131/134), anti-PFKFB3 and anti-CBS antibodies. The expression level of GAPDH was used as a loading control. (b) Intracellular NADPH contents and NADPH/NADP+ ratio in HCT116 cells expressing shCBS#2 stably. Data indicate the mean+s.d. (n=4 independent experiments with unpaired Student’s t-test). *P<0.05 versus controls. (c) Alterations in GSH, GSSG and GSH/GSSG ratio in CBS knockdown HCT116 cells. Data indicate the mean+s.d. (n=6 independent experiments; unpaired Student’s t-test). *P<0.05 versus controls. n.s., not significant. (d) Suppression of intracellular ROS level in the cells silencing of CBS or PRMT1 by shRNA. Data indicate the values of relative ROS levels (mean+s.d., n=8); *P<0.05 versus controls. (e) Effects of CBS knockdown on the toxicity of cisplatin in HCT116 cells. HCT116 cells were treated with increasing concentrations of cisplatin for 16 h. Values of relative cell death are expressed as mean+s.d. (n=4). *P<0.05 versus controls without cisplatin. †P<0.05 for shCBS#2 versus control without cisplatin. (f) Alterations in endogenous ROS levels with increasing concentrations of cisplatin in the cells carrying control or shCBS#2. Note that treatment of cisplatin upregulates intracellular ROS levels in a dose-dependent manner in the control cells, while those transfected with shCBS#2 displayed the partial suppression of cellular ROS levels. Data indicate mean+s.d. for eight separating experiments. *P<0.05 versus controls (without cisplatin). †P<0.05 for the cells transfected with shCBS#2 versus controls in the presence of 50 μM cisplatin. Statistical analysis used in (d–f) was ANOVA with Fischer’s multiple comparison test.

