

Abstract
Summary: 13C flux analysis studies have become an essential component of metabolic engineering research. The scope of these studies has gradually expanded to include both isotopically steady-state and transient labeling experiments, the latter of which are uniquely applicable to photosynthetic organisms and slow-to-label mammalian cell cultures. Isotopomer network compartmental analysis (INCA) is the first publicly available software package that can perform both steady-state metabolic flux analysis and isotopically non-stationary metabolic flux analysis. The software provides a framework for comprehensive analysis of metabolic networks using mass balances and elementary metabolite unit balances. The generation of balance equations and their computational solution is completely automated and can be performed on networks of arbitrary complexity.
Availability and implementation: MATLAB p-code files are freely available for non-commercial use and can be downloaded at http://mfa.vueinnovations.com. Commercial licenses are also available.
Contact: j.d.young@vanderbilt.edu
1 INTRODUCTION
13C metabolic flux analysis (13C MFA) has emerged over the past 20 years as an important approach to assess in vivo metabolic phenotypes (Sauer, 2006; Wiechert, 2001). It relies on least-squares regression of isotope labeling measurements and extracellular exchange rates to reconstruct comprehensive flux maps that depict the flow of carbon throughout intracellular metabolism. The models applied to the data regression comprise mass balances and isotopomer balances on all internal nodes of the metabolic network and can often involve many thousands of equations. Several publicly available software packages have been developed to facilitate model generation and computational analysis of steady-state isotope labeling experiments (ILEs): 13CFLUX2 (Weitzel et al., 2013), FiatFlux (Zamboni et al., 2005), Metran (Yoo et al., 2008), OpenFLUX (Quek et al., 2009), FIA (Srour et al., 2011) and influx_s (Sokol et al., 2012), to name a few. However, none of these packages are capable of simulating transient ILEs wherein 13C labeling measurements are collected before reaching isotopic steady state. This requires so-called isotopically non-stationary MFA (INST-MFA) methods, where the isotopomer balances are described by a system of ordinary differential equations (ODEs) rather than algebraic equations (Wiechert and Noh, 2005).
Because of the growing prevalence of INST-MFA and the lack of publicly available software tools to facilitate its application, we have developed a MATLAB-based software package called INCA (isotopomer network compartmental analysis) that is capable of both steady-state MFA and INST-MFA calculations. As the name implies, the INCA modeling approach is a natural extension of the well-known compartmental modeling approaches that have been used for many years to assess the flow of radioactive tracers within biological networks. However, unlike those previous radiotracer models, INCA is able to describe the full isotopomer distributions of measured metabolites and is therefore capable of distinguishing flux contributions from different metabolic pathways based on the atomic rearrangements they produce.
2 PROGRAM USAGE
A graphical user interface allows the user to input reaction information and experimental data to the program, while offering a variety of powerful analysis tools to design and interpret ILEs (Fig. 1). All INCA data structures can be loaded and manipulated from the MATLAB command line, and driver routines can be called directly or invoked within custom MATLAB scripts. INCA also offers built-in parallelization capabilities for running compute-intensive functions within a distributed computing environment. All program features are fully documented in a 60-page user manual, which addresses several advanced modeling topics. Two preconfigured example networks are also provided with INCA.
Fig. 1.
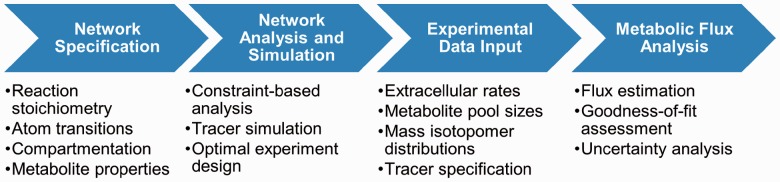
Steps in the INCA analysis workflow
3 METHODS AND IMPLEMENTATION
3.1 Network specification
INCA applies steady-state mass balances and either steady-state or transient elementary metabolite unit (EMU) balances to simulate ILEs. The balance equations for any user-specified reaction network are generated based on reaction stoichiometry, compartmentation, reversibility and atom transition information that can be supplied in a simple text format: e.g. ‘A (abc) => B (ab) + C (c)’. INCA can simultaneously trace multiple atom types (e.g. C, H) and can properly account for metabolite symmetry and atom equivalency based on user input (Antoniewicz et al., 2007). The resulting network model can be saved in binary format or exported to other text formats such as FluxML (Weitzel et al., 2013) or OpenFLUX-compatible FTBL (Quek et al., 2009). Whenever an initial flux distribution is supplied by the user or subsequently modified, INCA checks the mass balances for consistency and updates the flux values, if necessary, to preserve mass conservation.
Solution of steady-state EMU balances is accomplished using a QR decomposition of the state-transition matrix of each decoupled linear subsystem, followed by matrix inversion (Antoniewicz et al., 2007). Transient EMU balances are integrated using a custom linear ODE solver that involves computing the matrix exponential of each state-transition matrix (Young et al., 2008). Integration tolerances and time-step controls can be adjusted by the user to achieve the desired accuracy and time resolution. It is also possible to apply quasi–steady-state assumptions to selected metabolite nodes during the ODE integration. This will force the labeling at these nodes to respond instantaneously to changes in the labeling of precursor metabolites, such that local isotopic equilibrium is maintained.
3.2 Network analysis and simulation
INCA provides several analysis routines that can be used to assess metabolic network properties and to design ILEs, even before supplying experimental inputs. First, there are built-in constraint-based analysis methods that can be applied to the user-specified reaction network (Palsson, 2006): flux balance analysis, minimization of metabolic adjustment, flux variability analysis, flux coupling finder, robustness analysis and phenotype phase plane analysis. Second, INCA can perform either steady-state or transient simulations of isotopomer distributions based on user-specified tracer inputs and initial flux and pool size estimates. This is an important tool for identifying optimal tracers, measurements and sampling time points before initiating experiments. Third, INCA is capable of implementing the optimal experiment design approach of Mollney et al. (1999) to comprehensively search for tracer combinations that maximize parameter identifiability.
3.3 Experimental data input
When performing 13C MFA, fluxes are estimated by minimizing the difference between simulated and experimental measurements. This requires specification of (i) flux measurements, (ii) isotope labeling measurements and (iii) isotope tracers to the program. When performing INST-MFA, the user can also specify pool size measurements. One powerful feature of INCA is that it allows multiple experiments to be regressed simultaneously to generate a single flux map. This can be of interest when fitting several replicate experiments or parallel labeling experiments with different tracers. Currently, INCA only supports mass isotopomer distribution data or 1H-NMR fractional enrichment data. The ability to specify 13C-NMR fine spectra or tandem MS/MS data to the program is anticipated in a future release. Steady-state or transient isotopomer measurements can be entered directly to the graphical user interface, imported from an Excel spreadsheet or imported from other previously saved INCA models. INCA can accept any combination of tracer atoms, including mixtures of different tracers (e.g. 2H and 13C) or tracers with mass shifts >1 (e.g. 18O).
3.4 Metabolic flux analysis
Once the metabolic network and experimental inputs have been specified, INCA can perform MFA calculations by minimizing the sum-of-squared residuals (SSR) between simulated and experimental measurements (Wiechert, 2001). A Levenberg–Marquardt gradient-based search algorithm is applied to minimize the SSR by adjusting the free flux and pool size parameters. An active set method is applied to handle the linear inequality constraints on the adjustable parameters (Gill et al., 1981). The sensitivity equations required to estimate the Hessian matrix and gradient vector of the SSR with respect to the fitted parameters are automatically generated and solved in tandem with the EMU balances. The search can be initialized with user-specified parameter estimates, or these values can be randomized to minimize user bias. To increase the odds of finding a global optimum solution, a ‘multistart’ approach can be used to repeat the parameter search from multiple random initial guesses.
When flux estimation is completed, INCA automatically provides several statistical metrics that can be used to assess goodness-of-fit and to diagnose the source of any mismatch between simulated and experimental measurements. Local estimates of uncertainty are obtained from the diagonal elements of the parameter covariance matrix (Antoniewicz et al., 2006). To obtain a more accurate estimate of parameter uncertainties, INCA can perform either parameter continuation or Monte Carlo analysis to calculate confidence intervals. Parameter continuation is performed using a method similar to Antoniewicz et al. (2006); however, INCA applies flux coupling analysis and a predictor-corrector method to minimize computational expense. INCA is also capable of computing confidence intervals using Monte Carlo analysis as an alternative to parameter continuation.
Although there is no explicit limit on the size of the network that can be modeled using INCA, memory usage and computational run times can be considerable when performing INST-MFA with large networks. The following run times were obtained for an Escherichia coli example network (Young et al., 2008) with 92 fluxes (35 free) and 66 metabolite pools (46 free) on a Dell OptiPlex 790 computer (Rocks 6.0, Intel Core i7 2600 processor, 4 GB memory): <1 s for tracer simulation, ∼10 min for flux estimation (starting from a random initial guess) and ∼1 h/parameter for calculation of 95% confidence intervals using the continuation approach. However, INCA’s parallelization capabilities can be leveraged to minimize the total time required for multistart MFA and confidence interval calculations.
ACKNOWLEDGEMENTS
The author acknowledges many fruitful discussions with Maciek Antoniewicz, Jason Walther, Christian Metallo, Doug Allen, Veronique Beckers and members of the Young lab at Vanderbilt during the development of INCA. Several features included in INCA were originally inspired by the Metran program by Maciek Antoniewicz (Yoo et al., 2008).
Funding: The National Science Foundation [CBET-0955251, CBET-1067766, CBET-1105991, EF-1105249]; Department of Energy [DE-SC0008118]; The National Institutes of Health [CA155964, DK072856].
Conflict of Interest: none declared.
REFERENCES
- Antoniewicz MR, et al. Determination of confidence intervals of metabolic fluxes estimated from stable isotope measurements. Metab. Eng. 2006;8:324–337. doi: 10.1016/j.ymben.2006.01.004. [DOI] [PubMed] [Google Scholar]
- Antoniewicz MR, et al. Elementary metabolite units (EMU): a novel framework for modeling isotopic distributions. Metab. Eng. 2007;9:68–86. doi: 10.1016/j.ymben.2006.09.001. [DOI] [PMC free article] [PubMed] [Google Scholar]
- Gill PE, et al. Practical Optimization. New York, NY: Academic Press; 1981. [Google Scholar]
- Mollney M, et al. Bidirectional reaction steps in metabolic networks: IV. Optimal design of isotopomer labeling experiments. Biotechnol. Bioeng. 1999;66:86–103. doi: 10.1002/(sici)1097-0290(1999)66:2<86::aid-bit2>3.0.co;2-a. [DOI] [PubMed] [Google Scholar]
- Palsson B. Systems biology: properties of reconstructed networks. Cambridge, NY: Cambridge University Press; 2006. [Google Scholar]
- Quek LE, et al. OpenFLUX: efficient modelling software for 13C-based metabolic flux analysis. Microb. Cell Fact. 2009;8:25. doi: 10.1186/1475-2859-8-25. [DOI] [PMC free article] [PubMed] [Google Scholar]
- Sauer U. Metabolic networks in motion: 13C-based flux analysis. Mol. Syst. Biol. 2006;2:62. doi: 10.1038/msb4100109. [DOI] [PMC free article] [PubMed] [Google Scholar]
- Sokol S, et al. influx_s: increasing numerical stability and precision for metabolic flux analysis in isotope labelling experiments. Bioinformatics. 2012;28:687–693. doi: 10.1093/bioinformatics/btr716. [DOI] [PubMed] [Google Scholar]
- Srour O, et al. Fluxomers: a new approach for 13C metabolic flux analysis. BMC Syst. Biol. 2011;5:129. doi: 10.1186/1752-0509-5-129. [DOI] [PMC free article] [PubMed] [Google Scholar]
- Weitzel M, et al. 13CFLUX2–high-performance software suite for 13C-metabolic flux analysis. Bioinformatics. 2013;29:143–145. doi: 10.1093/bioinformatics/bts646. [DOI] [PMC free article] [PubMed] [Google Scholar]
- Wiechert W. 13C Metabolic flux analysis. Metab. Eng. 2001;3:195–206. doi: 10.1006/mben.2001.0187. [DOI] [PubMed] [Google Scholar]
- Wiechert W, Noh K. From stationary to instationary metabolic flux analysis. Adv. Biochem. Eng. Biotechnol. 2005;92:145–172. doi: 10.1007/b98921. [DOI] [PubMed] [Google Scholar]
- Yoo H, et al. Quantifying reductive carboxylation flux of glutamine to lipid in a brown adipocyte cell line. J. Biol. Chem. 2008;283:20621–20627. doi: 10.1074/jbc.M706494200. [DOI] [PMC free article] [PubMed] [Google Scholar]
- Young JD, et al. An elementary metabolite unit (EMU) based method of isotopically nonstationary flux analysis. Biotechnol. Bioeng. 2008;99:686–699. doi: 10.1002/bit.21632. [DOI] [PubMed] [Google Scholar]
- Zamboni N, et al. FiatFlux–a software for metabolic flux analysis from 13C-glucose experiments. BMC Bioinformatics. 2005;6:209. doi: 10.1186/1471-2105-6-209. [DOI] [PMC free article] [PubMed] [Google Scholar]