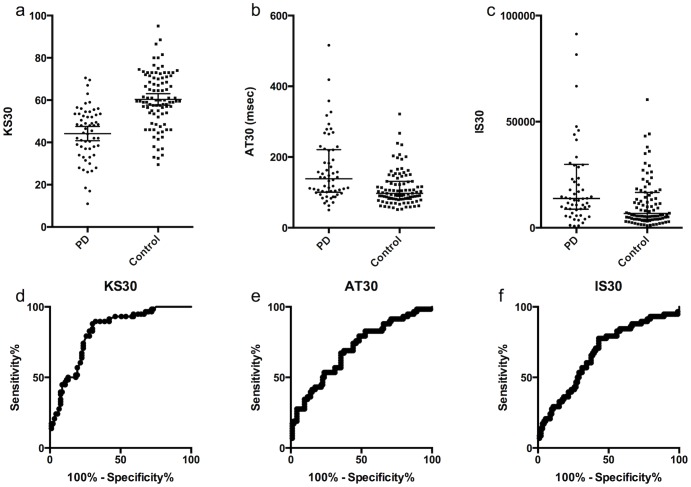
Figure 1. Comparison of KS30, AT30 and IS30 in patients with PD and controls (average of score from each hand).
Distribution of KS30 (mean and standard deviation), (b) AT30 and (c) IS30 (medians and interquartile ranges). For IS30, 7 data points were out of the axis range. Receiver operating characteristic (ROC) curves for (d) KS30, (e) AT30 and (f) IS30.

