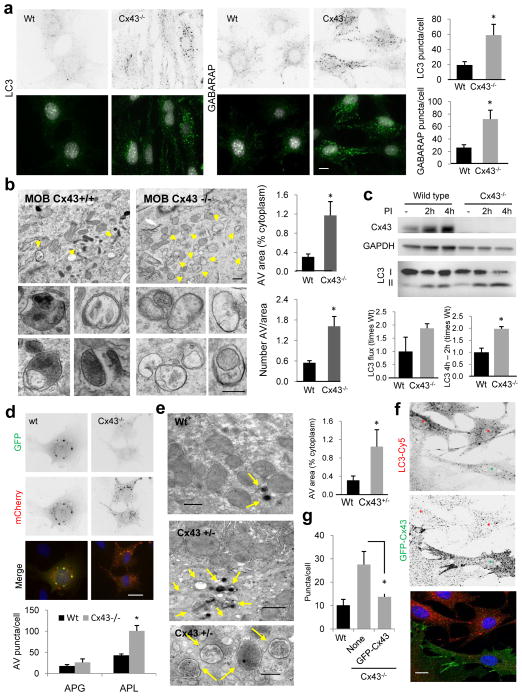
Figure 2. Autophagy is highly upregulated in cells from Cx43 knock-out mice.
(a) Immunostaining for LC3 and GABARAP in mouse osteoblasts (MOB) from wild type (Wt) or Cx43 null mice (Cx43−/−) grown in serum-supplemented media. Reverse black and white channels (top) and color images (bottom). Right: Average number of LC3 and GABARAP puncta per cell (n=3 wells, 3 independent experiments, >50 cells per experiment). (b) Electron micrographs of Wt and Cx43−/− MOB grown in serum-supplemented media. Yellow arrows: autophagic vacuoles. Insets: autophagic vacuoles (AV) at higher magnification. Right: Percentage of cytoplasm area occupied by AV (top) and number of AV per area (bottom) (n=3 mice, >10 micrographs per mice). (c) Immunoblot for LC3 of the same cells grown in serum-supplemented media untreated or treated with lysosomal protease inhibitors (PI) for 2 or 4h. Top: representative immunoblot. GAPDH is shown as loading control. Bottom: LC3 flux (left) and increase in LC3-II during lysosomal inhibition (right) (n= 3 independent experiments). (d) Representative images of the same cells transfected with the mCherry-GFP-LC3 tandem reporter and grown in serum-supplemented media. Single channel images (inverted black and white) and merged images (color). Bottom: Number of vesicles positive for GFP and mCherry (autophagosomes; APG) and only for mCherry (autophagolysosomes; APL) (n=4 wells, 4 independent experiments, >30 cells per experiment). (e) Electron micrographs of livers from Wt and Cx43+/− mice. Arrows indicate AV. Right: Percentage of cytosolic area occupied by AVs (n=3 mice, >10 micrographs per mice). (f) Immunofluorescence for LC3 in Cx43−/− MOBs expressing GFP-tagged full-length Cx43. Single channels (inverted black and white) and merged channels (color). Asterisks: transfected (green) and untransfected (red) cells. (g) LC3-positive puncta per cell in the indicated cells (n=3 wells, 3 independent experiments, >50 cells per experiment). All values are mean+s.e.m. and differences with Wt were significant for (*) p<0.01. Nuclei are highlighted with DAPI. Bars: 5 μm in fluorescence images; 1 μm and 0.1 μm in top panels and inserts of b and e. Uncropped images of blots are shown in Supplementary Fig. 9

