

Abstract
Using a derivation cohort (N=349), we developed the first warfarin dosing algorithm that includes recently discovered polymorphisms in VKORC1 and CYP2C9 associated with warfarin dose requirement in African Americans (AAs). We tested our novel algorithm in an independent cohort of 129 AAs and compared the dose prediction to the International Warfarin Pharmacogenetics Consortium (IWPC) dosing algorithms. Our algorithm explains more of the phenotypic variation (R2 = 0.27) than the IWPC pharmacogenomics (R2 = 0.15) or clinical (R2 = 0.16) algorithms. Among high dose patients, our algorithm predicted a higher proportion of patients within 20% of stable warfarin dose (45% vs. 29% and 2% in the IWPC pharmacogenomics and clinical algorithms respectively). In contrast to our novel algorithm, a significant inverse correlation between predicted dose and percent West African ancestry (WAA) was observed for the IWPC pharmacogenomics algorithm among patients requiring ≥60 mg/week (β = −2.04, p=0.02).
Keywords: warfarin, algorithm, African Americans, VKORC1, CYP2C9, polymorphisms
Introduction
Warfarin is the most widely used anticoagulant with over 33 million prescriptions dispensed in the U.S. during 2011.1 Although new oral anticoagulant drugs, such as dabigatran and rivaroxaban, were expected to supplant warfarin,2, 3 their use remains limited by cost, narrow indications, non-reversibility, gastrointestinal side effects, difficulty in monitoring anticoagulation, and concerns about serious bleeding.4, 5 Unfortunately, warfarin ranks among the top ten drug-related causes of serious adverse effects ranging from occult bleeding to death.6 While several polymorphisms have been found to be associated, the most well studied genetic variants are CPY2C9*2 (rs1799853), CYPC9*3 (rs1057910), and VKORC1 -1639 (rs9923231).7 These genetic variants have been used by many groups, with the largest effort to date by the International Warfarin Pharmacogenetics Consortium (IWPC), to develop pharmacogenomics-guided warfarin dosing algorithms which also include non-genetic factors in order to predict stable warfarin maintenance dose.8, 9 The two, publicly available, algorithms to predict dose response - the IWPC pharmacogenomics algorithm and the IWPC clinical algorithm have been investigated for the predictive power in a large cohort.9 However, the representation of African Americans (AAs) in this effort was low (<10% of the study population).9 Most pharmacogenomics algorithms (developed in largely Caucasian populations) have been predominantly associated with warfarin sensitivity and consequently are more useful in identifying subgroups of patients who require low doses of warfarin. Furthermore, the minor allele frequencies of rs1799853, rs1057910, and rs9923231 variants are much lower among AAs compared to Caucasians. This may explain why these algorithms have shown more promise in Caucasian and Asian populations, predicting approximately 55% of the variability in warfarin dose, given these two groups require lower doses of warfarin than populations of African descent. In fact, their ability to predict warfarin dose variability in AAs has been much lower, at approximately 20%.8, 10–12 Populations of recent African descent have a great amount of genetic diversity, much of which is specific to this population.13 Consequently, SNPs identified in Caucasian populations may not completely capture the genetic variation contributing to a phenotype in AAs.
Previously, we described two novel variants in VKORC1 (rs61162043) and in CYP2C9 (rs7089580) found through targeted resequencing efforts in AAs that were significantly associated with warfarin dose requirement independent of known genetic variants (rs9923231, rs1799853, rs1057910, rs28371686, rs7900194, and rs28371685).14 More importantly, rs61162043 and rs7089580 were predictive of higher warfarin dose requirement in both the discovery and validation cohorts of African American (AA) patients on stable warfarin dose.14 Through a large genome-wide association study (GWAS) in collaboration with the IWPC, we identified rs12777823, located upstream of CYP2C18, to be associated with lower warfarin dose requirement in AAs independent of rs1799853, rs1057910, and rs992323.15 In addition, no significant association was found in European and Japanese GWAS datasets.15
We first developed a novel pharmacogenomics warfarin dosing algorithm which incorporates these novel variants along with population-specific clinical variables in a derivation cohort of 349 individuals (previously described).14 In this study, we determined whether our novel AA algorithm was significantly better at predicting the maintenance dose of warfarin than the IWPC’s pharmacogenomics and clinical algorithms in an additional independent validation cohort of 149 AAs. Because of substantial variation of admixture rates among AAs, we also examined the association between percent West African ancestry (WAA) and warfarin dose prediction.16
Materials and Methods
The study design included retrospective data from the derivation cohort (N = 349) to generate our novel AA algorithm that was then tested in the validation cohort (N = 149). 14
Validation cohort
A total of 149 warfarin patients were recruited from anticoagulation clinics at the University of Chicago, the University of Illinois at Chicago, The George Washington University Medical Faculty Associates and the Veterans Affairs Hospital in Washington, DC. This validation cohort was independent of the derivation cohort from which the algorithm was generated. Inclusion criteria were patients self-described as AA, age≥18 years, and treatment with a stable dose of warfarin, defined as the same dose for at least three consecutive clinic visits that produced an international normalized ratio (INR) within the therapeutic range. INR measurements for patients were made on a ProtTime Microcoagulation System (ITC, Edison, NJ) or on Diagnostica Stago analyzers (STA-R Evolution and STA-Compact, Diagnostica Stago, Parsippany, NJ). One 10-ml blood sample was taken from each subject by venipuncture and placed in purple-top Vacutainer tubes containing ethylenediaminetetraacetic acid (EDTA) and frozen at −20 °C for DNA extraction. All protocols were approved by the institutional review boards from each participating institution. All patients provided written informed consent.
Genotyping
Genomic DNA was isolated from whole blood samples using the Puregene (Gentra Biosystems) DNA isolation kit. Patients were genotyped for rs1799853, rs1057910, rs28371686, rs7900194, rs28371685, rs9923231, rs61162043, rs7089580, and rs12777823 using previously published methods.14, 17, 18 A panel of 105 ancestry informative markers (AIMs) was genotyped for each patient to determine WAA.19 Genotyping of AIMs was performed with the MassArray 7K HT genetic analysis system (Sequenom, Inc.) as previously described.20 SNPs out of Hardy–Weinberg equilibrium (HWE) at p < 0.001and a call rate <95% were excluded. Samples with SNP call rates <90% across all SNPs were excluded.
Statistical analysis
Deviations from HWE were evaluated using the Fisher’s exact test in PLINK.21 Global individual ancestry was determined for each study participant using AIMs for European and WAA.19 Individual ancestry estimates were obtained from STRUCTURE 2.3.3 as previously described.22
For each algorithm, the predicted dose of warfarin was correlated with the observed dose by the Pearson correlation coefficient (r). Paired sample t-test was used to compare predicted mean dose for each algorithm with the observed dose. To evaluate the clinical accuracy of each algorithm, patients whose predicted dose fell within 20% of the actual stable therapeutic dose were divided into three dosing ranges according to the observed weekly dose: low dose (<40 mg/week), intermediate (40–50 mg/week), and high (>50 mg/week).
The predictive accuracy was assessed by calculating the percentage of patients correctly assigned to each dosing group for all algorithms. Accuracy of each algorithm was assessed using the mean absolute error (MAE). A two-tailed p-value was computed using McNemar’s test to determine if the difference between two models was significant. To estimate the number of patients needed to genotype (NNG) to prevent one adverse event, we used the methods previously described and as shown in Table 4.9, 23 The NNG is the inverse of the absolute risk reduction, calculated as the absolute difference between the event rates for our novel AA algorithm and the IWPC clinical algorithm. Statistical analysis was carried out using IBM SPSS Statistics version 19.0.0 package (SPSS, Inc., Chicago, IL).
Table 4.
Calculation of patients needed to be genotyped.
| Algorithm | Individuals outside 20% range |
|---|---|
| Novel African American | 53 |
| IWPC Clinical | 95 |
| Absolute risk reduction: (53/129) – (95/129) | 0.325 |
| Number needed to genotype: 1/0.325 | 3.07 |
Algorithm generation
Our pharmacogenomics dosing model was generated using clinical and genotyping retrospective data from a derivation cohort of 349 AA patients and multivariate regression (MR) analysis.14 Weekly warfarin dose was log2-transformed prior to statistical modeling to achieve an approximately normal distribution and used as the dependent variable. The p- and β values are provided, reflecting the significance and the adjusted relative weight, respectively, of each variable included in the model (Table 1). The model equation used to predict weekly warfarin dose (mg) is:
Table 1.
Contributions of individual variables identified from the derivation cohort (N=349) to the novel African American warfarin dose algorithm.
| Coefficients | β | SE | P |
|---|---|---|---|
| Intercept | 5.906 | 0.262 | < 2e-16 |
| Age† | −0.015 | 0.002 | 1.36E-10 |
| Weight† | 0.005 | 0.001 | 0.0005 |
| DVT/PE | 0.158 | 0.071 | 0.0265 |
|
* CYP2C9 Star Variant CYP2C9*2†, *3†, *5, *8, and *11 |
−0.254 | 0.086 | 0.0035 |
| VKORC1 -1639 A>G† | −0.370 | 0.081 | 8.70E-06 |
| VKORC1 -8191 A>G | −0.097 | 0.032 | 0.0024 |
| CYP2C9, rs7089580 A>T | 0.060 | 0.040 | 0.1309 |
| rs12777823 A>G | 0.104 | 0.059 | 0.0794 |
SE = standard error
Variants were combined into a single group
The model predicts the log2 (dose) in mg/week.
Shared variables between algorithms.
Age is given in years and weight in kg. Presence of deep vein thrombosis/pulmonary embolism (DVT/PE) and star variants is coded as 1 if present and 0 otherwise. Each of the SNPs (rs61162043 A/G, rs7089580 A/T, rs9923231 A/G, and rs12777823 A/G) are coded as 1 for each minor allele present (heterozygous = 1; homozygous for the minor allele = 2; and homozygous for the common allele = 0).
Results
Patients with incomplete clinical or genotypic data required to run any of the algorithms were excluded. This resulted in 129 patients remaining in the analysis. Demographic, clinical, and genetic variables for all study participants in the validation cohort are summarized on Table 2. The mean therapeutic warfarin dose was 46.9 mg/week (SD±17.2) and more than half of our patients (59.7%) were started on warfarin due to DVT/PE. We combined rs1799853, rs1057910, rs28371686, rs7900194, rs28371685,(CYP2C9*2, *3, *5, *8, and *11) into a CYP2C9 star variant group due to low frequency of the individual SNPs, each of which reduces CYP2C9 activity.14, 24 None of the SNPs showed deviations from HWE at P<0.001. The minor allele frequencies for rs1799853, rs1057910, and rs9923231 were low (0.02, 0.02, and 0.06 respectively), consistent with previous studies.10, 14, 24
Table 2.
Demographic, clinical, and genotypic characteristics of validation cohort.
| Variable | N=149 |
|---|---|
| Females | 47.3% |
| Males | 52.7% |
| Age, (mean ± SD) | 59.2 (16.3) |
| West African ancestry (mean ± SD) | 76.3% (8%) |
| Weight, kg (mean ± SD) | 96.5 (28.7) |
| Height, cm (mean ± SD) | 170.5 (11.6) |
| Warfarin dose, mg/week (mean ± SD) | 46.9 (17.2) |
| DVT/PE (%with) | 59.70% |
| Atrial Fibrillation (%with) | 16.1% |
| CYP2C9 inducers† | 1.3% |
| Amiodarone | 6.7% |
| SNP | MAF (allele) |
| CYP2C9 Star Variants | 0.14* |
| CYP2C9 18786, rs7089580 | 0.19 (T) |
| VKORC1 (−1639), rs9923231 | 0.06 (A) |
| VKORC1 (−8191), rs61162043 | 0.47 (A) |
| rs12777823 | 0.26 (A) |
SNP, single nucleotide polymorphism
MAF, minor allele frequency
Combined MAFs
Enzyme inducers considered were Carbamazapine, Rifampin, Statins, and Azole drugs
We tested the accuracy of the three algorithms in our AA validation cohort by comparing the predicted dose requirements with the actual maintenance dose for each patient. Comparisons of our novel AA algorithm to the IWPC algorithms are shown in Table 3. The mean predicted dose utilizing our novel AA algorithm was much closer to the actual mean therapeutic dose (47.6 and 46.9 mg/week, respectively) and the difference between the mean predicted dose and mean therapeutic dose was not significant (p = 0.76). The predicted mean doses for the IWPC pharmacogenomics and clinical algorithms were found to be significantly lower (p = 0.004 and p = 3.3× 10⁻²², respectively) than the mean therapeutic dose (Table 3). Furthermore, the MAE with the novel AA algorithm (10.9 [SE ±0.92]) was lower than the IWPC pharmacogenomics and clinical algorithms (12.2 [SE ±0.98], and 17.9 [SE ±1.2] mg/week, respectively). We found the correlation between the observed and the predicted dose was strongest for the novel AA algorithm (r = 0.51) and the proportion of variability in warfarin dosage explained by the variables included in the algorithm was the highest (R2 = 0.27). The correlation between predicted and observed doses for both the IWPC pharmacogenomics and clinical algorithms were similar (0.38 and 0.41, respectively) as well as the proportion of variability explained (R2 = 0.15 and 0.16, respectively), consistent with the findings by the IWPC in their AA cohort (R2 = 0.19).9
Table 3.
Performance comparison of algorithms.
| Algorithm | Warfarin dose (mean ±SD) | MAE (mean ±SE) | Pearson r | R2 | Within 20% | Accurately Predicted |
|---|---|---|---|---|---|---|
| Therapeutic Dose | 46.9 (17.2) | N/A | N/A | N/A | N/A | N/A |
| Novel African American | 47.6 (11.4) | 10.9 (0.92) | 0.51* | 0.27* | 58.9%a | 10.9%b |
| IWPC Pharmacogenomics | 42.8 (9.1)† | 12.2 (0.98) | 0.38* | 0.15* | 48.8% | 2.3%b |
| IWPC Clinical | 30.6 (7.8)† | 17.9 (1.2) | 0.41* | 0.16* | 26.4%a | 0% |
Warfarin dose is in mg/week
MAE: mean absolute error
SD, standard deviation
SE, standard error
Difference in mean dose is statistically significant from therapeutic dose.
Correlation is significant at the 0.01 level (2-tailed).
Difference is significant between novel algorithm and the IWPC clinical algorithm (p < 0.0001).
Difference is statistically significant, p = 0.02.
P-values derived using McNemar’s test
Both of the IWPC algorithms tended to under-predict warfarin doses while the novel AA algorithm over-predicted doses (Figure 1). However, approximately 38% of warfarin doses that were over-predicted by the novel AA algorithm were below 10mg/week (Figure 1A). While the IWPC pharmacogenomics algorithm over or under-predicted warfarin doses by up to 10mg/week in approximately 53% of patients (Figure 1B). The IWPC clinical algorithm under-predicted warfarin doses for the majority of patients (86.8%), with 33% being under estimated by 10–20 mg/week (Figure 1C). Our novel AA algorithm was able to predict the exact therapeutic dose in 10.9% of patients compared to 2.3% (p = 0.02) and none for the IWPC pharmacogenomics and clinical algorithms, respectively (Table 3 and Figure 1). Previous warfarin algorithms have used the target prediction range of within 20% of the observed dose to assess algorithm performance.9 We found that nearly 60% of predicted doses from our novel AA algorithm were within this 20% range compared to 48.8% and 26.4% for the IWPC pharmacogenomics and clinical algorithms, respectively (Table 3).
Figure 1. Frequency distribution of predicted warfarin dose deviation from therapeutic dose.

Panel A). Most over-predicted warfarin doses by the novel AA algorithm were below 10mg/week. Panel B). The IWPC pharmacogenomics algorithm over or under-predicted warfarin doses by up to 10mg/week in more than half of the patients. Panel C). The IWPC clinical algorithm under-predicted warfarin doses for the majority of patients. Our novel AA algorithm was able to predict the exact therapeutic dose in 10.9% of patients compared to 2.3% for the IWPC pharmacogenomics algorithms (p = 0.02).
Most of the patients who are incorrectly dosed when using standard initiation doses require low or high warfarin doses, therefore it is important to analyze the performance of the algorithms in the extreme dose subgroups.9, 25 Hence, we examined the predictive accuracy of the novel AA algorithm for patients requiring low (<40 mg/week), intermediate (40–50 mg/week), and high (>50 mg/week) dosing regimens (Figure 2). For patients requiring low doses, all three algorithms demonstrate similar predictive power. However, the MAE was lowest for the novel AA algorithm at 3.0 mg/week (SE ±0.48) compared to the IWPC pharmacogenomics (3.8 mg/week, SE ±0.58) and clinical algorithms (3.8 mg/week, SE ±0.45). Among patients in the intermediate dose group, the novel AA algorithm and the IWPC pharmacogenomics algorithm performed similarly with 82% and 84% of predicted doses within the 20% range respectively while the performance of the IWPC clinical algorithm begins to drop drastically with only 15.8% of warfarin doses predicted within the same range (Figure 2). For patients in the high dose group, the novel AA algorithm significantly out performs both of the IWPC algorithms (Figure 2). We found the novel AA algorithm was able to correctly detect the greatest percentage of high-dose patients (53%), whereas the IWPC pharmacogenomics and clinical algorithms correctly assigned 26% and 2%, respectively, of patients in this group. Overall, predicted doses derived from the novel AA algorithm were closer to the observed doses for more patients and the precision was higher as demonstrated by the consistently lower MAE. To determine the clinical benefit of incorporating our novel AA algorithm into practice versus using the IWPC clinical algorithm, we computed the NNG. In order to prevent one predicted dose from being outside of the 20% therapeutic dose range (event), it was estimated that approximately three patients would need to be genotyped (Table 4).
Figure 2. Accuracy of novel AA algorithm in predicting warfarin doses among dosing groups.
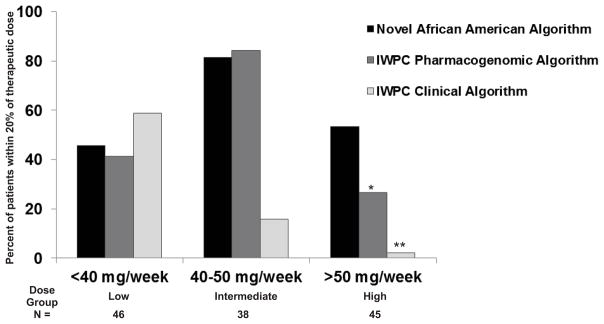
Percentage of patients whose actual warfarin dose fell within 20% of the predicted dose according to either the novel AA algorithm, IWPC pharmacogenomics algorithm, and IWPC clinical algorithm. For patients requiring low doses, all three algorithms have similar predictive dose requirements. The novel African American algorithm out performs both IWPC algorithms for patients in the high dose group (p=0.004* and p<0.0001**). Number of patients in each dose group is shown at the bottom.
Self-reported race for AAs is not a strong proxy for genetic background and the availability of AIMs has made it possible to accurately measure admixture in AAs.26–29 Therefore, we examined how well our novel AA algorithm performs given the broad range of WAA among AAs.30 Overall among the doses predicted within a 20% range, mean percent WAA was not significantly different between the algorithms. For the IWPC pharmacogenomics algorithm, however, linear regression analysis revealed a strong inverse correlation between percent WAA and predicted dose within the 20% therapeutic dose range for patients requiring doses ≥60 mg/week (β = −2.04, p = 0.02) (Table 5). The correlation is also higher compared to our novel AA algorithm (r = 0.41 and r = 0.25, respectively). As expected, our novel AA algorithm did not show association because population-specific variables are incorporated and therefore may account for WAA.
Table 5.
Correlation between West African ancestry and warfarin dose prediction for patients requiring doses ≥60 mg/week.
| Algorithm | Pearson r | R2 | β* | P |
|---|---|---|---|---|
| Novel African American | 0.25 | 0.06 | −1.8 | 0.19 |
| IWPC Pharmacogenomics | 0.41 | 0.17 | −2.04 | 0.02 |
WAA, West African ancestry
SD, standard deviation
Unstandardized
IWPC clinical algorithm was not able to predict doses within 20% of therapeutic doses ≥60 mg/week and therefore excluded.
Discussion
In this study, a novel warfarin dose prediction algorithm is presented and compared to IWPC’s clinical and pharmacogenomics algorithms for maintenance dose prediction in AAs. Our novel AA pharmacogenomics algorithm incorporates clinical and genetic information found to be specifically associated with warfarin dose in AAs resulting in a much higher percentage of predicted doses within 20% of the observed dose, decreased MAE in the predicted dose estimates, increased fraction of variability explained by these factors (R2), and a predictive power that is sensitive to within population diversity. The integration of novel SNPs associated with increased weekly warfarin dose in AAs also improves the accuracy of warfarin dose prediction in AA patients under high dose regimens. One critical clinical factor that is taken into account by our algorithm is the presence of DVT/PE, which AAs have the highest incidence and mortality rates in the U.S.31, 32 These results suggest that incorporation of our AA novel algorithm into clinical practice may benefit AA patients by predicting the warfarin starting dose that best approximates the therapeutic dose and consequently decreasing the time needed to reach a stable INR and lowering the risk of non-response to therapy.
Our algorithm correctly predicted therapeutic dose in 58.9% of the cases versus 48.8% and 26.4% predicted by the IWPC pharmacogenomics and clinical algorithms, respectively and had the lowest MAE (10.9 mg/week) (Table 3). This significant improvement in dose prediction was more pronounced among patients whose stable therapeutic dose was >50 mg/week. This is clinically relevant as these patients are the most at risk for adverse consequences of warfarin initiation from under dosing and may demonstrate the greatest benefit from pharmacogenomics dosing. We found the NNG was 3.07 when comparing our novel AA algorithm to the IWPC clinical algorithm. Meaning, one misclassification is avoided for approximately every three patients whose dose is estimated using our novel AA algorithm when compared to the IWPC clinical algorithm. This estimate is much lower than the comparison of the IWPC pharmacogenomics algorithm to the IWPC clinical algorithm at 13.2.9 Recently, a clinical study has shown that genotype-guided warfarin dosing better predicted warfarin maintenance dose and reduced out-of-range INRs compared to standard dosing.33 However, clinical implementation of pharmacogenomic algorithms is, in part, hindered by the time and the cost required to obtain genotypes utilizing traditional methods. This may be overcome through progress in genotyping technologies such as rapid-melting curve analysis which can provide results within one hour.34 With the drop in cost of genotying, we for see the development of population-specific panels of variants to become feasible. A model system designed to overcome many of the barriers associated with the translation of pharmacogenomics into clinical practice (The 1200 Patient Project) was recently implemented where the use of preemptive genotyping for a large number of variants reduces cost (<$500/patient) and an interactive informatics portal aims to improve interpretation of results into clinical action 35.
A study evaluated the performance of nine algorithms, including the IWPC pharmacogenomics algorithm, by race and found the MAE to be the highest in the AA population compared to Caucasians and Asians.36 They found the IWPC pharmacogenomics algorithm to perform better for AAs. They obtained similar results for their AA cohort as we did for our cohort when utilizing the IWPC pharmacogenomics algorithm (MAE = 12.0 mg/week, within 20% = 46.4%; MAE = 12.2 mg/week, within 20% = 48.8%, respectively).36 Recently, Ramirez et al proposed an “expanded genetic algorithm” which included CYP4F2 and CALU variants not utilized in our novel algorithm that predicted warfarin dose better in AAs and EAs compared to IWPC’s.37 However, this expanded algorithm only predicted correctly the low dose for AAs in three out of 12 cases compared to our novel AA algorithm where 21 individuals out of 46 were correctly assigned (Figure 2).37 As for the high dose group, their expanded algorithm performed similarly to IWPC’s algorithm37, whereas our novel algorithm correctly detected 27% and 51% more individuals requiring high doses compared to the IWPC pharmacogenomics and clinical algorithms respectively.
There are limitations in our study, such as the exclusion of other genetic variants and clinical factors that have been shown to be associated with warfarin dose requirements. One study found rs339097 in CALU to be associated with high warfarin doses in AAs,38 however in our derivation cohort we did not observed this association14 and consequently the SNP was excluded from our algorithm. SNPs rs7089580 and rs12777823 were not statistically significant in our initial MR analysis, but were included due to their significant association in our univariate analysis and previous strong association to warfarin dose requirement in AAs in larger population cohorts.14, 39 In the univariate analysis on the derivation cohort, rs1799853 was marginally significant (p = 0.047) and rs1057910 was not statistically significant (p = 0.11).14 The mean warfarin dose is considered high which may lead to a bias in algorithm performance. However, the mean warfarin dose in our cohort is similar to that in other published studies among AAs and therefore represents typical doses in this population. In fact, AA ethnicity has been found to be a predictor of warfarin doses ≥5 mg/day.40 Although, we have not assessed our novel algorithm’s performance in other ethnicities, the incorporation of SNPs rs61162043, rs7089580, and rs12777823 which are associated with warfarin dose response among AAs as well as clinical factors found to be more prevalent among AAs (DVT/PE, higher dose requirement) can potentially hinder its performance in other ethnic groups. Another limitation is our sample size for the validation cohort. Nonetheless, given the scarcity of AA pharmacogenomics samples, our study is still one of the largest in this population.
Because our novel AA algorithm incorporates several African specific CYP2C9 star alleles, we can better account for the effect of decreased enzyme activity on warfarin dose in this population. Therefore, our algorithm continues to perform as well as the IWPC pharmacogenomics algorithm in the prediction of low warfarin dose requirement - further demonstrating the need for population-specific algorithms. Studies have found that genetic ancestry proportions can vary significantly within individuals who self-identify as the same racial group and therefore we utilized percent WAA as an assessment tool in algorithm predictability.41, 42 This is important considering that AAs have a broad range of ancestry; for example, it has been shown that only 34% of AAs possess >90% WAA as opposed to 98% of European Americans who have >90% European ancestry.26 For the IWPC pharmacogenomics algorithm, we observed an inverse correlation between percent WAA and performance among high dose patients (Table 5). The loss of predictability found in IWPC pharmacogenomics algorithm suggests that non-population-specific algorithms lose predictability after certain genetic variance thresholds between populations are exceeded. The identification and incorporation of population-specific alleles into population-specific pharmacogenomics algorithms can simultaneously take into account genetic ancestry and help optimize warfarin doses. In addition, our findings strongly suggest that there may be other African-specific variants associated with warfarin dose requirement that have yet to be identified.
In conclusion, we have developed a novel pharmacogenomics dose algorithm that predicts the stable therapeutic dose of warfarin more effectively than either of the IWPC algorithms for AAs and the predictive power was not affected by the percentage of WAA in patients. We have incorporated SNPs previously associated with warfarin dose requirements in AAs that have not been used in any other pharmacogenomics algorithm. By focusing on population-specific clinical and genetic variables, were we able to more accurately predict warfarin dose in AAs, with the potential to address an important source of health disparities in this pharmacogenetically underserved group.
Acknowledgments
Funding: This work was funded in part by the National Heart Lung and Blood Institute (K23 HL089808-01A2) (M.A.P.), a grant from the American Heart Association Midwest Affiliate Grant-In-Aid (10GRNT3750024) (L.H.C.), and by a grant from the National Collaborative on Aging (T.J.O.).
Footnotes
Conflict-of-interest disclosure: The authors have no conflicts of interest to disclose.
References
- 1.The Use of Medicines in the United States: Review of 2011. IMS Institue for Healthcare Informatics; [Google Scholar]
- 2.Patel MR, Mahaffey KW, Garg J, Pan G, Singer DE, Hacke W, et al. Rivaroxaban versus warfarin in nonvalvular atrial fibrillation. The New England journal of medicine. 2011;365(10):883–891. doi: 10.1056/NEJMoa1009638. [DOI] [PubMed] [Google Scholar]
- 3.Connolly SJ, Ezekowitz MD, Yusuf S, Eikelboom J, Oldgren J, Parekh A, et al. Dabigatran versus warfarin in patients with atrial fibrillation. The New England journal of medicine. 2009;361(12):1139–1151. doi: 10.1056/NEJMoa0905561. [DOI] [PubMed] [Google Scholar]
- 4.Harper P, Young L, Merriman E. Bleeding risk with dabigatran in the frail elderly. The New England journal of medicine. 2012;366(9):864–866. doi: 10.1056/NEJMc1112874. [DOI] [PubMed] [Google Scholar]
- 5.Cheng CM, McCurdy MR, Wong HA, Kayser SR. Pros and cons of dabigatran. American journal of health-system pharmacy: AJHP: official journal of the American Society of Health-System Pharmacists. 2011;68(16):1495. doi: 10.2146/ajhp110178. [DOI] [PubMed] [Google Scholar]
- 6.Wysowski DK, Nourjah P, Swartz L. Bleeding complications with warfarin use: a prevalent adverse effect resulting in regulatory action. Archives of internal medicine. 2007;167(13):1414–1419. doi: 10.1001/archinte.167.13.1414. [DOI] [PubMed] [Google Scholar]
- 7.Cavallari LH, Shin J, Perera MA. Role of pharmacogenomics in the management of traditional and novel oral anticoagulants. Pharmacotherapy. 2011;31(12):1192–1207. doi: 10.1592/phco.31.12.1192. [DOI] [PMC free article] [PubMed] [Google Scholar]
- 8.Gage BF, Eby C, Johnson JA, Deych E, Rieder MJ, Ridker PM, et al. Use of pharmacogenetic and clinical factors to predict the therapeutic dose of warfarin. Clinical pharmacology and therapeutics. 2008;84(3):326–331. doi: 10.1038/clpt.2008.10. [DOI] [PMC free article] [PubMed] [Google Scholar]
- 9.Klein TE, Altman RB, Eriksson N, Gage BF, Kimmel SE, et al. International Warfarin Pharmacogenetics C. Estimation of the warfarin dose with clinical and pharmacogenetic data. The New England journal of medicine. 2009;360(8):753–764. doi: 10.1056/NEJMoa0809329. [DOI] [PMC free article] [PubMed] [Google Scholar]
- 10.Limdi NA, Beasley TM, Crowley MR, Goldstein JA, Rieder MJ, Flockhart DA, et al. VKORC1 polymorphisms, haplotypes and haplotype groups on warfarin dose among African-Americans and European-Americans. Pharmacogenomics. 2008;9(10):1445–1458. doi: 10.2217/14622416.9.10.1445. [DOI] [PMC free article] [PubMed] [Google Scholar]
- 11.Rieder MJ, Reiner AP, Gage BF, Nickerson DA, Eby CS, McLeod HL, et al. Effect of VKORC1 haplotypes on transcriptional regulation and warfarin dose. The New England journal of medicine. 2005;352(22):2285–2293. doi: 10.1056/NEJMoa044503. [DOI] [PubMed] [Google Scholar]
- 12.Wadelius M, Chen LY, Lindh JD, Eriksson N, Ghori MJ, Bumpstead S, et al. The largest prospective warfarin-treated cohort supports genetic forecasting. Blood. 2009;113(4):784–792. doi: 10.1182/blood-2008-04-149070. [DOI] [PMC free article] [PubMed] [Google Scholar]
- 13.Freimuth RR, Xiao M, Marsh S, Minton M, Addleman N, Van Booven DJ, et al. Polymorphism discovery in 51 chemotherapy pathway genes. Human molecular genetics. 2005;14(23):3595–3603. doi: 10.1093/hmg/ddi387. [DOI] [PubMed] [Google Scholar]
- 14.Perera MA, Gamazon E, Cavallari LH, Patel SR, Poindexter S, Kittles RA, et al. The missing association: sequencing-based discovery of novel SNPs in VKORC1 and CYP2C9 that affect warfarin dose in African Americans. Clinical pharmacology and therapeutics. 2011;89(3):408–415. doi: 10.1038/clpt.2010.322. [DOI] [PMC free article] [PubMed] [Google Scholar]
- 15.Perera MA, Cavallari LH, Limdi NA, Gamazon ER, Konkashbaev A, Daneshjou R, et al. Genetic variants associated with warfarin dose in African-American individuals: a genome-wide association study. Lancet. 2013 doi: 10.1016/S0140-6736(13)60681-9. [DOI] [PMC free article] [PubMed] [Google Scholar]
- 16.Zakharia F, Basu A, Absher D, Assimes TL, Go AS, Hlatky MA, et al. Characterizing the admixed African ancestry of African Americans. Genome biology. 2009;10(12):R141. doi: 10.1186/gb-2009-10-12-r141. [DOI] [PMC free article] [PubMed] [Google Scholar]
- 17.Cavallari LH, Butler C, Langaee TY, Wardak N, Patel SR, Viana MA, et al. Association of apolipoprotein E genotype with duration of time to achieve a stable warfarin dose in African-American patients. Pharmacotherapy. 2011;31(8):785–792. doi: 10.1592/phco.31.8.785. [DOI] [PubMed] [Google Scholar]
- 18.Hruska MW, Frye RF, Langaee TY. Pyrosequencing method for genotyping cytochrome P450 CYP2C8 and CYP2C9 enzymes. Clinical chemistry. 2004;50(12):2392–2395. doi: 10.1373/clinchem.2004.040071. [DOI] [PubMed] [Google Scholar]
- 19.Rosenberg NA, Li LM, Ward R, Pritchard JK. Informativeness of genetic markers for inference of ancestry. American journal of human genetics. 2003;73(6):1402–1422. doi: 10.1086/380416. [DOI] [PMC free article] [PubMed] [Google Scholar]
- 20.Murphy AB, Ukoli F, Freeman V, Bennett F, Aiken W, Tulloch T, et al. 8q24 risk alleles in West African and Caribbean men. The Prostate. 2012;72(12):1366–1373. doi: 10.1002/pros.22486. [DOI] [PMC free article] [PubMed] [Google Scholar]
- 21.Wigginton JE, Cutler DJ, Abecasis GR. A note on exact tests of Hardy-Weinberg equilibrium. American journal of human genetics. 2005;76(5):887–893. doi: 10.1086/429864. [DOI] [PMC free article] [PubMed] [Google Scholar]
- 22.Pritchard JK, Stephens M, Donnelly P. Inference of population structure using multilocus genotype data. Genetics. 2000;155(2):945–959. doi: 10.1093/genetics/155.2.945. [DOI] [PMC free article] [PubMed] [Google Scholar]
- 23.Cook RJ, Sackett DL. The number needed to treat: a clinically useful measure of treatment effect. Bmj. 1995;310(6977):452–454. doi: 10.1136/bmj.310.6977.452. [DOI] [PMC free article] [PubMed] [Google Scholar]
- 24.Cavallari LH, Langaee TY, Momary KM, Shapiro NL, Nutescu EA, Coty WA, et al. Genetic and clinical predictors of warfarin dose requirements in African Americans. Clinical pharmacology and therapeutics. 2010;87(4):459–464. doi: 10.1038/clpt.2009.223. [DOI] [PubMed] [Google Scholar]
- 25.Spreafico M, Lodigiani C, van Leeuwen Y, Pizzotti D, Rota LL, Rosendaal F, et al. Effects of CYP2C9 and VKORC1 on INR variations and dose requirements during initial phase of anticoagulant therapy. Pharmacogenomics. 2008;9(9):1237–1250. doi: 10.2217/14622416.9.9.1237. [DOI] [PubMed] [Google Scholar]
- 26.Torres JB, Kittles RA. The relationship between “race” and genetics in biomedical research. Current hypertension reports. 2007;9(3):196–201. doi: 10.1007/s11906-007-0035-1. [DOI] [PubMed] [Google Scholar]
- 27.Galanter JM, Fernandez-Lopez JC, Gignoux CR, Barnholtz-Sloan J, Fernandez-Rozadilla C, Via M, et al. Development of a panel of genome-wide ancestry informative markers to study admixture throughout the Americas. PLoS genetics. 2012;8(3):e1002554. doi: 10.1371/journal.pgen.1002554. [DOI] [PMC free article] [PubMed] [Google Scholar]
- 28.Parra EJ, Kittles RA, Argyropoulos G, Pfaff CL, Hiester K, Bonilla C, et al. Ancestral proportions and admixture dynamics in geographically defined African Americans living in South Carolina. American journal of physical anthropology. 2001;114(1):18–29. doi: 10.1002/1096-8644(200101)114:1<18::AID-AJPA1002>3.0.CO;2-2. [DOI] [PubMed] [Google Scholar]
- 29.Parra EJ, Marcini A, Akey J, Martinson J, Batzer MA, Cooper R, et al. Estimating African American admixture proportions by use of population-specific alleles. American journal of human genetics. 1998;63(6):1839–1851. doi: 10.1086/302148. [DOI] [PMC free article] [PubMed] [Google Scholar]
- 30.Kittles Rick A, ERS, Oji-Njideka Nefertiti S, Bonilla Carolina. Race, Skin Color and Genetic Ancestry: Implications for Biomedical Research on Health Disparities. California Journal of Health Promotion. 2007;5:9–23. Special Issue Health Disparities & Social Justice. [Google Scholar]
- 31.Goldhaber SZ. Risk factors for venous thromboembolism. Journal of the American College of Cardiology. 2010;56(1):1–7. doi: 10.1016/j.jacc.2010.01.057. [DOI] [PubMed] [Google Scholar]
- 32.Goldhaber SZ. Pulmonary embolism in Black Americans. American journal of hematology. 2010;85(7):465–466. doi: 10.1002/ajh.21747. [DOI] [PubMed] [Google Scholar]
- 33.Anderson JL, Horne BD, Stevens SM, Woller SC, Samuelson KM, Mansfield JW, et al. A randomized and clinical effectiveness trial comparing two pharmacogenetic algorithms and standard care for individualizing warfarin dosing (CoumaGen-II) Circulation. 2012;125(16):1997–2005. doi: 10.1161/CIRCULATIONAHA.111.070920. [DOI] [PubMed] [Google Scholar]
- 34.Carlquist JF, McKinney JT, Nicholas ZP, Clark JL, Kahn SF, Horne BD, et al. Rapid melting curve analysis for genetic variants that underlie inter-individual variability in stable warfarin dosing. Journal of thrombosis and thrombolysis. 2008;26(1):1–7. doi: 10.1007/s11239-007-0077-x. [DOI] [PubMed] [Google Scholar]
- 35.O’Donnell PH, Bush A, Spitz J, Danahey K, Saner D, Das S, et al. The 1200 patients project: creating a new medical model system for clinical implementation of pharmacogenomics. Clinical pharmacology and therapeutics. 2012;92(4):446–449. doi: 10.1038/clpt.2012.117. [DOI] [PMC free article] [PubMed] [Google Scholar]
- 36.Shin J, Cao D. Comparison of warfarin pharmacogenetic dosing algorithms in a racially diverse large cohort. Pharmacogenomics. 2011;12(1):125–134. doi: 10.2217/pgs.10.168. [DOI] [PubMed] [Google Scholar]
- 37.Ramirez AH, Shi Y, Schildcrout JS, Delaney JT, Xu H, Oetjens MT, et al. Predicting warfarin dosage in European-Americans and African-Americans using DNA samples linked to an electronic health record. Pharmacogenomics. 2012;13(4):407–418. doi: 10.2217/pgs.11.164. [DOI] [PMC free article] [PubMed] [Google Scholar]
- 38.Voora D, Koboldt DC, King CR, Lenzini PA, Eby CS, Porche-Sorbet R, et al. A polymorphism in the VKORC1 regulator calumenin predicts higher warfarin dose requirements in African Americans. Clinical pharmacology and therapeutics. 2010;87(4):445–451. doi: 10.1038/clpt.2009.291. [DOI] [PMC free article] [PubMed] [Google Scholar]
- 39.Perera M, Limdi N, Cavallari L, Gamazon E, Konkashbaev A, Pluzhnikov A, et al. Novel SNPs Associated with Warfarin Dose in a Large Multicenter Cohort of African Americans: Genome Wide Association Study and Replication Results [abstract]. In: American Heart Association. Circulation. 2011;124 [Google Scholar]
- 40.Absher RK, Moore ME, Parker MH. Patient-specific factors predictive of warfarin dosage requirements. The Annals of pharmacotherapy. 2002;36(10):1512–1517. doi: 10.1345/aph.1C025. [DOI] [PubMed] [Google Scholar]
- 41.Hoggart CJ, Parra EJ, Shriver MD, Bonilla C, Kittles RA, Clayton DG, et al. Control of confounding of genetic associations in stratified populations. American journal of human genetics. 2003;72(6):1492–1504. doi: 10.1086/375613. [DOI] [PMC free article] [PubMed] [Google Scholar]
- 42.Kittles RA, Weiss KM. Race, ancestry, and genes: implications for defining disease risk. Annual review of genomics and human genetics. 2003;4:33–67. doi: 10.1146/annurev.genom.4.070802.110356. [DOI] [PubMed] [Google Scholar]