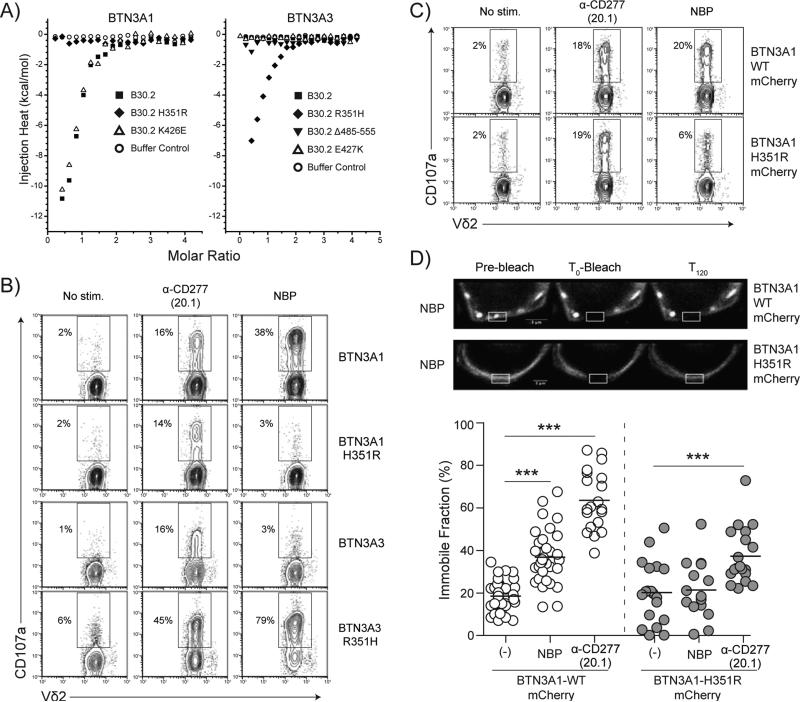
Figure 5.
A single amino acid difference mediates pAg reactivity between the BTN3A1 (pAg-responsive) and BTN3A3 (pAg-inactive) B30.2 Domains. A) ITC binding isotherms comparing the binding of cHDMAPP to the wildtype BTN3A1 B30.2 domain or mutants containing the respective BTN3A3 residue are shown at left. Binding of cHDMAPP is shown to B30.2 (filled squares), H351R (filled diamonds), K426E (open triangle), or the buffer control (open circle). At right are the ITC binding isotherms comparing the binding of cHDMAPP to the wildtype BTN3A3 B30.2 domain or mutants in which the relevant BTN3A1 residues are introduced. A BTN3A3 B30.2 domain mutant lacking the additional 70 C-terminal residues (Δ485-555) was also assessed for pAg binding. Binding of cHDMAPP is shown to B30.2 (filled squares), R351H (filled diamonds), the C-terminal truncation Δ485-555 (filled triangles), E427K (open triangle), or the buffer control (open circle). B) FACS plots showing CD107a upregulation of Vγ9Vδ2 T cells in response to treatment of wildtype and sequence swapped B30.2 domain full-length BTN3A constructs with α-CD277 agonist antibody 20.1, or in the presence of the bisphosphonate zoledronate (NBP). C) Functionality of fluorescent wildtype and mutated BTN3A1 chimeras are shown via FACS plots showing CD107a upregulation on Vγ9Vδ2 T cells (polyclonal line) after coculture with CD277shRNA#284 transduced-HEK293FT cells transiently transfected for the expression of either wildtype (WT) or H351R B30.2 domain mCherry full-length BTN3A1 constructs. Cells were treated with α-CD277 agonist antibody (clone #20.1) or the aminobisphosphonate zoledronate (NBP) before coculture. Numbers adjacent to outlined areas indicate the percentage of CD107a+ T cells. D) Top: Representative confocal images of HEK293 cells expressing mCherry-WT or –H351R BTN3A1 molecules following overnight incubation with NBP, shown before (Pre-bleach), immediately after (T0-bleach) and 120 seconds (T120) after photobleaching of regions of interest (indicated rectangular areas). Scale bars, 3 μm. Bottom: FRAP analysis of HEK293 cells expressing either wildtype or H351R B30.2 domain mCherry full-length BTN3A1 molecules, without treatment (-) or following incubation with NBP or α-CD277 agonist mAb (20.1). Data are presented as the value for the percentage of immobile fraction. FRAP was collected every 5 s. Control: no treatment, (-). BTN3A1 WT: (-), n=48; NBP, n=34; α-CD277, n=20. BTN3A1 H351R: (-), n=19; NBP, n=15; α-CD277, n=19. Bars, mean values. Student's t-test: *** p < 0.005.

