

Abstract
Drug transporter expression in tissues (in vivo) usually differs from that in cell lines used to measure transporter activity (in vitro). Therefore, quantification of transporter expression in tissues and cell lines is important to develop scaling factor for in vitro to in vivo extrapolation (IVIVE) of transporter-mediated drug disposition. Since traditional immunoquantification methods are semiquantitative, targeted proteomics is now emerging as a superior method to quantify proteins, including membrane transporters. This superiority is derived from the selectivity, precision, accuracy, and speed of analysis by liquid chromatography tandem mass spectrometry (LC-MS/MS) in multiple reaction monitoring (MRM) mode. Moreover, LC-MS/MS proteomics has broader applicability because it does not require selective antibodies for individual proteins. There are a number of recent research and review papers that discuss the use of LC-MS/MS for transporter quantification. Here, we have compiled from the literature various elements of MRM proteomics to provide a comprehensive systematic strategy to quantify drug transporters. This review emphasizes practical aspects and challenges in surrogate peptide selection, peptide qualification, peptide synthesis and characterization, membrane protein isolation, protein digestion, sample preparation, LC-MS/MS parameter optimization, method validation, and sample analysis. In particular, bioinformatic tools used in method development and sample analysis are discussed in detail. Various pre-analytical and analytical sources of variability that should be considered during transporter quantification are highlighted. All these steps are illustrated using P-glycoprotein (P-gp) as a case example. Greater use of quantitative transporter proteomics will lead to a better understanding of the role of drug transporters in drug disposition.
KEY WORDS: drug transporters, LC-MS/MS, membrane proteins, MRM proteomics, quantitative proteomics
INTRODUCTION
Drug transporters play critical role in drug absorption, distribution, metabolism, and excretion (ADME). By affecting target tissue concentration of a drug, transporters often determine drug efficacy and toxicity [1–3]. Therefore, it is important that contribution of transporters in drug disposition (i.e., including tissue distribution) is characterized. Drug transporter function can be studied in humans by imaging (e.g., positron emission tomography (PET)) using specific transporter substrates [4–6]. While this technique has the advantage of measuring drug concentrations directly in tissues, it has some limitations, i.e., (i) lack of availability of transporter-specific probes, (ii) possible interference if metabolite(s) of the probe substrate are also detected, and (iii) costs of radiochemical synthesis and instrumentation. Human hepatocytes are the only well-established primary cells that are available to predict transporter-mediated drug disposition. But this approach cannot be extended to other organs important in drug disposition, e.g., the intestine or the kidney, as the primary cells from these organs are not validated for transporter function. Moreover, primary cells cannot be used to extrapolate data from one compound to another as the net transport in these cells is driven by multiple transporters. Therefore, alternative approaches are required to quantify drug transporter function to assess their role in drug disposition in various tissues. One such potential approach is physiologically based pharmacokinetic (PBPK) modelling that incorporates information on the expression of drug transporters [7]. That is, to estimate in vivo maximum transport velocity (Vmax) of a drug by (i) first measuring the in vitro Vmax in a cell line (or in vesicles) expressing a single transporter and then (ii) scaling the in vitro Vmax value by incorporating in vitro to in vivo (tissue) transporter expression data. Using such adjusted Vmax, one can determine transporter-mediated in vivo clearance (Vmax/Km) assuming that the Km (substrate affinity) remains constant (in vitro vs. in vivo). This approach is routinely used for reliable prediction of cytochrome P450-mediated hepatic drug metabolism, i.e., inter-system extrapolation factor (ISEF) approach [8].
Although gene expression data can indicate the presence of drug transporters in tissues, these data cannot be used in PBPK modelling because of the poor correlation between mRNA and protein levels. Therefore, protein expression of transporters is the closest surrogate of transporter activity. While transporter protein quantification by Western blotting is semiquantitative, we [9–13] and others [14–24] have recently shown that liquid chromatography coupled with tandem mass spectrometry (LC-MS/MS) can be successfully used to determine protein expression in tissues with greater selectivity, speed, sensitivity, and reproducibility. MS-based protein quantification, commonly referred as multiple or selective reaction monitoring (MRM or SRM) proteomics, relies on selective quantification of surrogate peptide(s) in a digested protein sample (Fig. 1) [25, 26]. The selectivity is achieved by the MRM characteristic of triple quadrupole MS instrument. In MRM analysis, two stages of mass selection, i.e., selection of a precursor ion and monitoring of specific product ion(s) derived from the precursor, provide highest analytical specificity applicable to complex proteome analysis. Such a two-step selection allows greater signal-to-noise ratio necessary for the quantification of low-expressing transporter proteins.
Fig. 1.
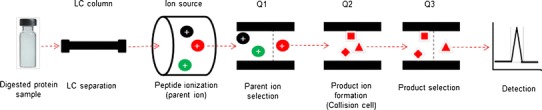
Outline of MRM analysis of a surrogate peptide after protein digestion. The most abundant parent ion is selected and then fragmented in the collision cell. The abundant product ions are selected and quantified
One can conclude from the above discussion and Fig. 1 that MRM detection of surrogate peptides is similar to that of small molecules (e.g., drug or metabolite in biological matrix). This is indeed true and any laboratory equipped with triple quadrupole MS instrument can adopt MRM proteomics for transporter quantification once a surrogate peptide is identified. However, MRM proteomics is still a new technique for transporter quantification, and there are many variables that should be taken into account for its successful implementation.
A number of research and review papers covering selective elements of transporter quantification by MRM have been published [16, 27–30]. Here, we have synthesized these elements to provide a step-by-step guide to develop reliable transporter quantification methods in tissues or cell lines with emphasis on following steps: (i) surrogate peptide selection, (ii) peptide qualification, (iii) peptide synthesis and characterization, (iv) membrane protein isolation, (v) protein digestion, (vi) sample preparation, (vii) LC-MS/MS parameter optimization, (viii) method validation, and (ix) sample analysis (Fig. 2). The variables that can affect these processes are discussed in detail. The available bioinformatic resources and their merits and applications are also discussed. All these aspects will be illustrated using P-glycoprotein (P-gp) as a case example.
Fig. 2.
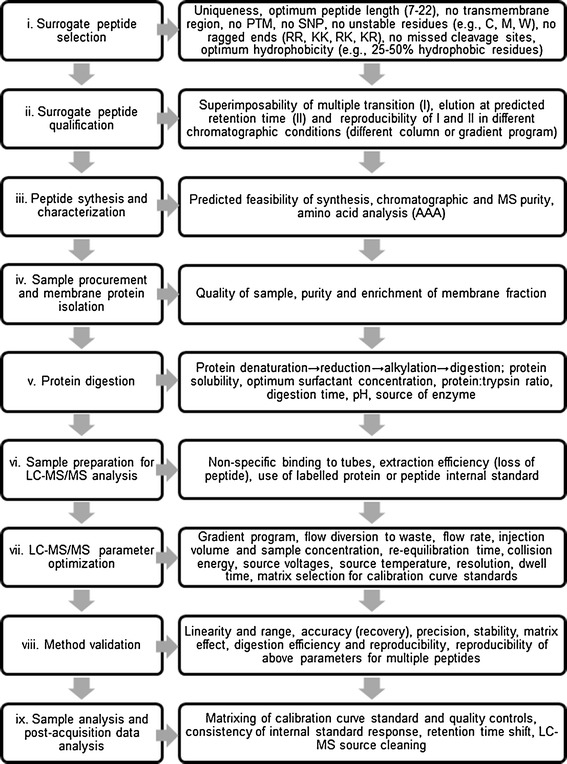
Critical steps in method development and validation of a transporter quantification assay. Variability in protein quantification can be introduced in any one of these steps
MRM PROTEOMICS VS. WESTERN BLOTTING FOR PROTEIN QUANTIFICATION
MRM proteomics has now become the gold standard for protein quantification [27, 31, 32]. MRM proteomics is superior over traditional Western blotting in several ways including selectivity, speed, ease of use, quality of data, and ability to confirm results (Table I). For example, MRM proteomics can quantify multiple proteins in a short period of time, i.e., approximately ten proteins in 20 min. Because a synthetic peptide is used as a calibrator, MRM proteomics can be used for absolute protein quantification provided that the complete protein digestion is achieved. The sensitivity of MRM method depends on the MS sensitivity of the surrogate peptide; however, at its best, the sensitivity is comparable or better than Western blotting. The sensitivity of MRM method can be substantially increased by using stable isotope standard capture with anti-peptide antibodies (SISCAPA) [33, 34]. MRM offers better precision because the sample preparation steps in MRM proteomics are simpler and can be automated. In addition, the quality of data with MRM proteomics is better because the results can be confirmed by multiple signals generated from more than one MRM transitions and if possible from multiple peptides. However, finding multiple surrogate peptides can be difficult especially for homologous proteins (e.g., Mdr1a and Mdr1b in rodents).
Table I.
| Category | Western blotting | MRM proteomics |
|---|---|---|
| Principle | Protein separation based on protein 3-D structure or the length of the polypeptide using gel electrophoresis. Then, proteins are transferred to a membrane (e.g., nitrocellulose) and stained with specific antibodies | Selective quantification of surrogate peptide(s) in a digested protein sample by LC-MS/MS |
| Selectivity | Cannot distinguish between homologous proteins | Can differentiate proteins even when they differ by a single amino acid residue |
| Sensitivity | If good antibodies are available, this method is sensitive and can detect proteins up to picomole (per mg of total protein) level | If the best peptide is used, MRM method is comparable or better in sensitivity than Western blotting |
| Number of end points | Single end-point. Poor quality control | Multiple endpoints, e.g., multiple MRM transitions of more than one surrogate peptides (if available) |
| Reproducibility | Poorer reproducibility than MRM because of the cumbersome procedure | Highly reproducible. Most of the steps are automated |
| Reagent quality | Selective antibodies are difficult to synthesize | Well-characterized synthetic peptides are readily available |
| Reagent availability | Antibodies are not always available | Peptides can be commercially procured |
| Costs | Quantification of a single protein is more economical than the MRM method | Instrument cost is high. However, it can quantify multiple proteins at a time, reducing the overall cost |
| Key advantages | Technique and expertise are routinely available in many laboratories | Selective, multiplex quantification, robust, large dynamic range |
| Major limitations | Nonselective, low dynamic range | Cost of instrument and sophisticated method development |
LC-MS/MS liquid chromatography tandem mass spectrometry, MRM multiple reaction monitoring
MRM METHOD DEVELOPMENT AND VALIDATION
Surrogate Peptide Selection
Selection of surrogate peptides for a protein is the first and most critical step in MRM proteomics. Until few years back, the surrogate peptide designing was based on experimental approach involving tedious protein fractionation by SDS-PAGE gel electrophoresis followed by capillary LC nano-electrospray ionization quadruple time-of-flight (nano-ESI-Q-TOF) or Orbitrap MS instruments [23, 24, 35]. While this approach is accurate, it is a laborious, cost-intensive procedure, and requires a protein standard with reasonable purity and amount. To overcome these shortcomings, in silico approach, first adopted by Kamiie et al. [27] for drug transporters, is preferred these days. The uniqueness, LC retention, MS response, peptide stability, quantitative reliability, and signal quality are the important aspects that are considered for surrogate peptide selection. While integrated software tools, e.g., SRMAtlas, MRMaid, or GPMDB (see below), are available for surrogate peptide design, these tools do not cover all the proteins across species. Therefore, we present below a basic generalized approach starting from finding a protein sequence to selecting a quantitatively reliable surrogate peptide for any transporter protein of interest.
Protein sequence: For targeted quantification of a transporter, first a full protein sequence is obtained from the databases such as NCBI, Ensembl, UniprotKB, or Protein knowledgebase (Table II). For example, the sequence for human P-gp (MDR1) was obtained from UniprotKB (Fig. 3) by putting protein name and species in the search box. The protein accession number for the transporter (e.g., P08183 (Uniprot) or ENSP00000265724 (Ensembl) for P-gp) can be obtained in this step for subsequent use.
In silico peptide digestion: For any protein, a list of potential peptides can be generated using in silico digestion tools listed in Table II. The parameters like protein accession number, corresponding database (e.g., Uniprot), protease type (e.g., trypsin), mass range (800–3,000), and minimum peptide length [7] are entered, and a list of potential peptides is obtained with information on the end and start amino acids and peptide molecular weights. We used Protein Prospector and Skyline (see below) to perform this task for P-gp. While these tools allow protein digestion by various proteases (e.g., trypsin, chymotrypsin, Lys-C, etc.), trypsin is commonly used in proteomics because of the following advantages. Trypsin specifically hydrolyzes peptide chains primarily at the carboxyl side of the amino acids lysine (K) or arginine (R), except when either is followed by proline (P). Trypsin forms peptides that are favorable for detection in triple quadrupole LC-MS/MS instrument (e.g., peptides with mass range of 800–3,000 and charge (typically +2)). Further, most of the publically available MS proteomic data, i.e., spectral libraries, are derived from trypsin-digested peptides.
Exclusion of regions of uncertainty: When peptides are generated by in silico prediction, it is important that only those candidates that are suitable for quantitative work are selected. Only peptides with 7–22 amino acids should be considered as this mass range is detectable in triple quadrupole MS. Also, potential (or known) transmembrane regions are excluded as they can affect protein digestion of transporter proteins. Where experimental information on the location of the transmembrane regions is not available, non-experimental methods can be used to predict these regions. For this, Uniprot marks transmembrane regions as (i) “potential regions” indicating some conclusive in silico evidence, (ii) “probable regions” with at least some experimental data, and (iii) “regions by similarity” indicating that some experimental information is available on a similar protein (or part of it). Uniprot predicted 12 transmembrane regions for MDR1, i.e., positions 45–67, 117–137, 187–208, 216–236, 293–316, 331–352, 712–732, 757–777, 833–853, 855–874, 935–957, and 974–995 (Fig. 3). Posttranslational modification (PTM) can change the mass of a peptide and hence should be avoided. When literature data on PTMs are not available, predictive tools, e.g., NetNGlyc, NetOGlyc, and NetPhos, can be used to predict such PTMs (Table II). Using such tools, amino acid residues, 91, 94, 99, and 666 in MDR1 (Fig. 3), were excluded as they are expected to be either phosphorylated or glycosylated. It is also important to avoid any peptide with possible changes in amino acid sequence due to non-synonymous single nucleotide polymorphism (SNP) or other genetic variations. For example, a common variant rs2032582 in ABCB1 [36] causes changes in amino acid S → A (position 893) which restricts the use of ELEGSGK as a quantitative surrogate peptide. While this information can be obtained from literature, useful databases exist that compile such data (Table II). Consideration of genetic polymorphism is important, but this criterion can be relaxed if the allele frequency is low (e.g., <1%) particularly in the absence of suitable alternative peptides. In general, all the peptides containing cysteine (C) and methionine (M) residues (underlined in Fig. 3) can be excluded because they are susceptible to rapid oxidation [37]. Accuracy of reported protein sequence is also important to be considered. For example, conflicting sequences can be submitted to the databases from different research groups, different types of experiments, or different biological samples, e.g., positions 23 [38] and 336 [39] in P-gp. Conflicting information on protein sequence can be sometime obtained from databases (e.g., Uniprot). Continuous sequence of arginine (R) or lysine (K) (e.g., RR, KK, RK, or KR) (ragged ends) should be excluded as it may cause incomplete trypsin digestion. While trypsin does not cleave K and R that are followed by P, this phenomenon is not always true [40]. Nevertheless, peptides containing such sequences should be excluded if other peptides are available for quantification.
Uniqueness: While specificity can be tested right after step 2 above, it can be exercised on the limited number of potential proteotypic peptides after excluding the regions of uncertainty. Specificity can be verified by using online tools like BLAST search analysis or homology analysis in Protein Prospectus (Table II). These tools can also confirm whether the peptide is conserved across species as shown for MDR1 in Table III. Use of the conserved peptides is advantageous when transporter expression is compared across species. The use of the same peptide reduces variability introduced by trypsin digestion.
Additional criteria: Amino acids that are prone to deamination (asparagine and glutamine [41, 42]) can be avoided. N-terminal glutamine and glutamic acid can form cyclic pyroglutamate under acidic conditions [43]. Aspartic acid, when paired with glycine, proline, or serine, can undergo hydrolysis and cause peptide cleavage in acidic environment [44]. Tryptophan and histidine residues are also prone to chemical degradation [45–47]. Despite these stringent selection criteria, it is sometime difficult to control modification of peptide. In that case, a combination of both unaltered and altered peptides can be selected for reliable quantification. Some peptides are difficult to synthesize. For example, it is challenging to remove asparagine N-terminal-protecting agent during peptide synthesis [48]. A peptide containing multiple serine or proline residues is also difficult to synthesize. Optimum solubility of peptide is important for LC retention as well as for solubilization of peptides during various steps (synthesis to LC-MS/MS analysis) of quantitative proteomics. The incomplete solubility of peptide might be due to hydrophobicity of peptides or due to β sheet formation [49]. It is generally difficult to dissolve a peptide if more than 50% of the amino acid residues are hydrophobic (e.g., valine, isoleucin, leucin, phenylalanine, tryptophan, or cysteine). A series of glutamine, isoleucine, leucine, phenylalanine, threonine, tyrosine, or valine can form β sheets that result in incomplete solvation [37]. These criteria are important, but if applied stringently, potential MS-sensitive peptides might be excluded. Therefore, if peptides with such red flags are selected, it is important to test their stability and solubility before using them for protein quantification.
Prediction of chromatographic (LC) parameters: Only those peptides that are retainable in the LC column should be selected for the next phase. Generally, a reverse phase column is used for peptide quantification. Software tools, e.g., SSRCalc, could be used for predicting peptide LC retention. In general, peptides with hydrophobicity index below (HI) 7 are not retained on the column, and those with HI above 50 strongly bind with reverse phase material. Such peptides should be excluded. Skyline can also predict retention time (RT) by regression equation generated from experimental data. Typical LC mobile phase conditions involve initial elution of polar interferences by high aqueous mobile phase (e.g., 98% aqueous) followed by gradually increasing organic phase (e.g., up to 60% acetonitrile). For P-gp, we predicted RT for its surrogate peptides based on peptide sequences and Skyline. Only 11 peptides that have optimum RT in conventional reversed-phase columns were considered for the next stage (Table III). Alternatively, Thermo Scientific Pierce peptide RT calibration mixture contains 15 standard peptides that can be used for RT prediction based on peptide hydrophobicity.
Prediction of relative MS response: The MRM signal intensity depends on the MS response of parent as well as product ions. Not all peptides are MS responsive and not all MS/MS fragments are equally abundant. Therefore, real spectral libraries or experimental MRM data from databases (Table II) can be used to select the best peptide and fragment ions. However, as these data are not always available for drug transporters, bioinformatic tools such as ESPPredictor, PeptideSieve and CONSeQuence can be used for this purpose. These tools typically work based on the machine learning algorithms that are taught to identify highly abundant peptides from experimental data. This is an active area of research and it is anticipated that improved bioinformatic tools, developed based on larger datasets, will be available in the future. Fragmentation pattern with relative intensities of product ions can be obtained or predicted by tools, such as PeptideART, MRMPilot, PinPoint, Skyline, and SRMAtlas (Table II). The potential high abundant fragment ions can also be generated for heavy labeled peptide at this stage using these tools. We used SRMAtlas and PeptideART to predict the most intense fragments of P-gp peptides (Table III). We found that >90% of the top five fragments predicted by both the software were similar. The collision energy and fragmentor (cone) voltage for each peptide were predicted using SRMAtlas. Typical collision energy for MRM peptides is from 10 to 30 eV, and fragmentor (cone) voltage is from 100 to 160 V in Agilent triple quadrupole instrument. These parameters generally increase with peptide length. Dwell time can be optimized to allow at least 15 data points for each peak. If multiple peptides or transitions are used, dynamic or scheduled MRM can be adopted which allows targeted data acquisition for a given transition only around the predicted RT.
Table II.
Bioinformatic Tools Used in Various Steps of MRM Proteomics Method Development
NCBI National Center for Biotechnology Information, BLAST Basic Local Alignment Search Tool, GPMDB Global Paleomagnetic Database, NIST National Institute of Standards and Technology
Fig. 3.
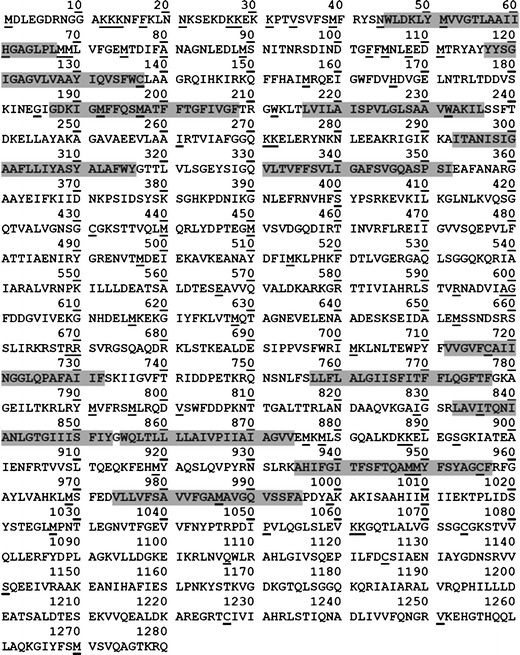
P-gp protein sequence (http://www.uniprot.org/uniprot/P08183). Residues highlighted in gray represent predicted transmembrane regions. Underlined residues represent either unstable residues, SNPs, ragged ends, or sequence conflicts
Table III.
Selected Surrogate P-gp Peptides and Their Predicted and Observed LC-MS/MS Parameters and Specificity in Human and Rodents
| Peptide | Residue position | Parent ion | Product ions | RT (min) | Fragmentor (V) | Collision energy (eV) | Specificity | SSRT | |||
|---|---|---|---|---|---|---|---|---|---|---|---|
| 1 | 2 | 3 | 4 | ||||||||
| IIGVFTR (P1) | 735–741 | 403.2 | 579.4 | 423.3 | 692.5 | 276.2 | 12.5 | 120 | 12 | hMDR1 | 26.3 |
| IIGVFTR (SIL-P1) | 409.3 | 589.4 | 433.3 | 12.5 | |||||||
| ELLAYAK (P2) | 243–249 | 404.2 | 565.3 | 452.3 | 381.2 | 338.2 | 10.7 | 120 | 12 | hMDR1 | 18.7 |
| ELLAYAK (SIL-P2) | 408.3 | 460.3 | 389.2 | 10.7 | |||||||
| GAAYEIFK (P3) | 360–367 | 449.7 | 699.5 | 536.4 | 770.5 | 407.4 | 12.5 | 125 | 13 | hMDR1 | 24.3 |
| GAAYEIF K (SIL-P3) | 453.8 | 707.5 | 544.4 | 12.5 | |||||||
| ILKGLNLK (P4) | 409–416 | 449.8 | 672.4 | 785.5 | 544.3 | 752.5 | 10.3 | 125 | 13 | hMDR1, rMdr1b, rMdr3, mMdr3 | 24.2 |
| ILKGLNLK (SIL-P4) | 453.8 | 680.4 | 793.5 | 10.3 | |||||||
| FYDPLAG K (P5) | 1,086–1,093 | 455.7 | 485.3 | 600.3 | 426.3 | 763.4 | 13.3 | 125 | 13 | hMDR1 | 21.7 |
| FYDPLAGK (SIL-P5) | 459.7 | 493.3 | 608.3 | 13.3 | |||||||
| ILSSFTDK (P6) | 235–242 | 455.8 | 684.4 | 597.4 | 510.4 | 797.5 | 10.6 | 125 | 13 | hMDR1, mMdr1a | 20.6 |
| ILSSFTDK (SIL-P6) | 459.8 | 692.4 | 719.4 | 10.6 | |||||||
| NTTGALTTR (P7) | 809–817 | 467.8 | 719.4 | 618.4 | 490.3 | 561.3 | 6.9 | 125 | 13 | hMDR1, mMdr1a, rMdr1 | 10.4 |
| NTTGALTTR (SIL-P7) | 472.5 | 729.4 | 628.4 | 6.9 | |||||||
| IAIARALVR (P8) | 539–547 | 491.8 | 685.4 | 614.4 | 458.3 | 798.5 | 14.6 | 130 | 14 | hMDR1, rMdr1, mMdr1a/b |
24.1 |
| IAIARALVR (SIL-P8) | 496.8 | 695.4 | 624.4 | 14.6 | |||||||
| TINVRFLR (P9) | 460–467 | 509.8 | 804.6 | 690.5 | 591.5 | 435.4 | 14.0 | 130 | 14 | hMDR1 | 28.5 |
| TINVRFLR (SIL-P9) | 514.8 | 814.6 | 700.5 | 14.0 | |||||||
| STVVQLLE R (P10) | 1077–1085 | 522.8 | 757.5 | 658.4 | 530.3 | 417.2 | 13.9 | 130 | 14 | hMDR1, rMdr1, mMdr1a/b | 27.1 |
| STVVQLLER (SIL-P10) | 527.8 | 767.5 | 668.4 | 13.9 | |||||||
| IATEAIENFR (P11) | 896−905 | 582.3 | 749.5 | 678.5 | 565.4 | 436.3 | 12.2 | 140 | 16 | hMDR1, rMdr1, mMdr1a/b | 25.7 |
| IATEAIENFR (SIL-P11) | 587.3 | 759.5 | 688.5 | 12.2 | |||||||
Key: Residues shown in bold letters (i.e., K and R) are labeled with 13C6 14N2-lysine and 13C6 14N4-arginine, respectively Other LC-MS/MS parameters are discussed before [11]. One missed cleavage site is present in P4, P8, and P9
RT retention time, SSRT Sequence specific retention time
While the above discussion is about theoretical criteria-based manual method of surrogate peptide selection, more advanced bioinformatic tools are emerging for this purpose. Integrated bioinformatic tools Skyline, GPMDB, PeptideAtlas, SRMAtlas, and MRMaid for surrogate peptide selection are discussed below:
Skyline
Skyline is a Windows-based MRM transition design tool developed by MacCoss Lab, University of Washington. It is installed in a local computer before use. To start, one has to first create a blank document. The protein or peptide sequence is then pasted into the document in the FASTA format. Skyline automatically transforms this information into in silico-predicted peptide ions and MRM transitions for each peptide. Thus far, this all is based on theoretical calculations without considering spectral data. However, Skyline is flexible and the users can select settings such as desired peptide size and exclusion of specific amino acid(s). An important and unique advantage of Skyline is it allows the use of spectral data from databases or MS instrument from different vendors to verify the predictions. As mentioned above, Skyline also predicts RT for peptides more accurately than SSRCalc alone based on instrument-specific data. Skyline data can be exported to create method files for direct upload into the instruments from major LC-MS/MS vendors. Quantitative data analysis can also be facilitated using Skyline. Panorama, an open-source repository server developed by the Skyline group can be used for Skyline data management and sharing.
The Global Proteome Machine Database (GPMDB)
This is a web-based proteomic tool that has a dedicated MRM database, which is supported by an experimental mass spectral library. To get the MRM data for peptides related to a given protein, Ensembl protein accession number (or protein name as keyword) and species name are entered into the search box. For example, using P-gp Ensembl accession number (ENSP00000265724), a list of MRM peptides can be predicted. While the tool gives a list of all predicted peptides, the recommended peptides are highlighted with asterisk based on peptide length, charge state, and amino acid composition. GPMDB also predicts RT. The experimentally observed MS/MS information (consensus spectrum) for each peptide can be obtained by clicking on the peptide, which then can be used to generate MRM method. GPMDB also provides information on potential interferences, i.e., it generates a list of peptides in the given species that can give at least one similar product ion. The application of GPMDB is limited to those peptides where spectral data are already available. For example, MRM transitions are available for P-gp but not for OATP1B1 in GPMDB.
PeptideAtlas
This is a web-based proteomic repository developed by the Institute for Systems Biology (ISB), Seattle (WA). To get information to generate MRM assay, one needs to put the protein name as keyword or accession number and target species in the search box. Within “Distinct Observed Peptides” panel, it shows details of real experimental data for peptides, e.g., number of times the peptide has been observed and number of samples in which the peptide is seen. On clicking “Annotated Transitions” panel, PeptideAtlas provides a list of observed transitions, i.e., peptide sequence, charge state, parent and product ions, product ion intensity, collision energy, instrument used, and RT. Similar to GPMDB, one has to download these data onto a local computer for future use. Peptide ranking is provided to help users select the best potential peptides. It also provides the information on the predicted transmembrane regions.
SRMAtlas
This is a sister software of PeptideAtlas developed by the same group. It is a database strictly designed to create MRM methods for protein quantification. The data are based on MRM experiments conducted mostly on triple quadrupole instrument, and therefore, it is a great resource for targeted proteomic method development. Though SRMAtlas is limited to few species (human, mouse, yeast, and Mycobacterium tuberculosis) to date, it provides comprehensive information on MRM transition, product ion intensity, collision energy, and predicted retention time. To retrieve a list of transitions, one needs to put the protein accession number onto the search button and select parameters such as number of peptides and transitions required and instrument type (Agilent QQQ, AB Sciex QTRAP5500/4000, Thermo TSQ or QTOF). The software can also calculate MRM transitions for heavy peptides. Batch processing can be done to collect MRM transitions for multiple proteins or peptides at a same time.
MRMaid
Similar to SRMAtlas, MRMaid is a web-based tool which was also specifically designed (by Cranfield University and Queen Mary University) for MRM method developed. The software relies on experimental data available in PRIDE database (Table II). The get the MRM information, protein name or accession number and species name are entered into the search box. A table of MRM transitions is obtained by clicking on “MRMaid Search.” Similar to SRMAtlas, one can select instrument type, number of peptides, and product ions per peptide region. The output also shows the number of times a product ion is observed in PRIDE and relative intensities of product ions. While RT is calculated based on SSRCalc algorithm, it provides option of calculating RT for a particular LC type.
Qualification of Surrogate Peptide
Once a surrogate peptide is predicted by the in silico tools, it is important to test whether this peptide works in the real sample. One can procure the synthetic surrogate peptides at this stage and tune LC-MS/MS parameters using standards. However, peptide synthesis generally takes 4–6 weeks, and sometime the selected surrogate peptide turns out to be less sensitive in MS. Therefore, an alternative approach that is independent of peptide standard can be used to facilitate method development. The latter involves screening potential quantitative surrogate peptides in the real samples (membrane fractions from tissues or cells) using generic LC and MS conditions. For transporter protein, vesicles or cells expressing transporters are preferred for qualification as they generally have higher transporter expression. For example, 11 surrogate peptides of P-gp were detected in cell expression P-gp in a single dynamic MRM method (Fig. 4). The peptide signal can be qualified by (i) superimposability of multiple product ion chromatograms and (ii) elution of peptides at predicted RT (Fig. 5). Reproducibility of (i) and (ii) with another column generally adds confidence to the results. MS sensitivity can be optimized by playing with critical MS parameters such as collision energy, resolution, and dwell time for any given set of parent to product ion. An alternative approach is to purchase crude peptide libraries for tuning LC-MS/MS parameters. Such peptide libraries are currently available from Thermo Scientific Pierce Biotechnology (PEPotec SRM Peptide libraries) as aliquots of ~0.1 mg/peptide with purity between 75 and 125%. The cost of these peptides is much lower, $15–25/peptide, than the analytical grade peptide standard (~$600/peptide). Once two to three best peptides are qualified, e.g., IATEAIENFR, and NTTGALTTR (Table III) for P-gp, these can be used for protein quantification.
Fig. 4.
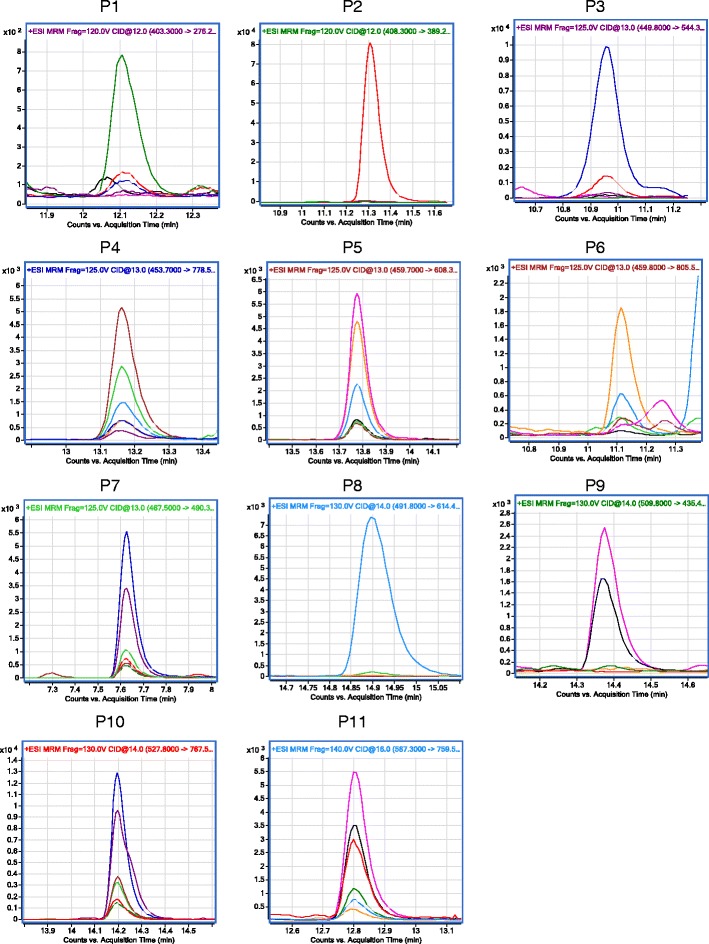
LC-MS/MS chromatograms showing superimposable peaks representing various transitions of P-gp surrogate peptides and corresponding internal standards. Peptides P4, P5, P7, P10, and P11 were detectable with high intensity
Fig. 5.
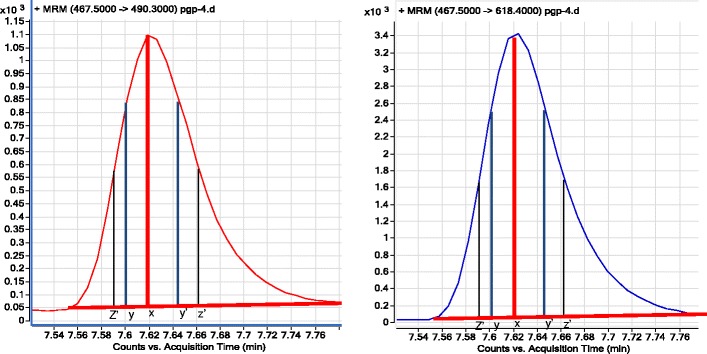
Chromatograms (two MRM transitions) of NTTGALTTR showing superimposability by comparing retention times at different peak heights at h (x), 0.75 h (y and y′), and 0.50 h (z and z′)
Peptide Synthesis and Characterization
Peptide can be procured from custom peptide synthesis companies (e.g., New England Peptides, Thermo Scientific Pierce Biotechnology, or Sigma Aldrich). The corresponding internal standard peptide that is labeled by incorporation of [13C615N2]lysine or [13C615N4]arginine can also be purchased. For absolute quantification of transporters, the purity and concentration of standard solutions are important. Amino acid analysis (AAA) is a critical test to ensure the absolute quantity of peptide standard used as calibrator. Chromatographic purity should also be established at this stage. Peptide aliquots should be stored at temperature <−20°C. New England Peptides, Thermo Scientific, and Sigma Aldrich also offer AAA for an additional cost of ~$250/peptide.
Sample Procurement and Membrane Protein Isolation
Endogenous factors such as genetic polymorphism, posttranslational modification, disease condition, and medication can affect drug transporter expression. Transporter quantification in tissues can also be affected by the quality of samples that depends on variables associated with sample procurement and storage (temperature, microbial contamination, etc.). Regarding transporter abundance in cell lines, factors such as passage number, confluency, or culture conditions can affect transporter expression. Cells grown in the presence of fetal bovine serum should be thoroughly washed if the total protein is used to normalize transporter expression.
Total transporter protein expression in the tissue homogenate or total membrane fraction (i.e., plasma membrane plus membranes from intracellular organelles) may not all be functionally active because some of it might be in the trafficking process to the membrane. Therefore, isolation of pure plasma membrane is ideal for predicting transporter function. To do so, there are a few protocols and commercially available kits that purport to isolate the plasma membrane [50, 51]. However, in our experience, these kits/methods do not yield pure plasma membrane fraction reproducibly for quantitative applications. Therefore, we and others have used total membrane transporter expression for this purpose [9, 11, 12, 19, 22, 52–54]. Although it is possible that the transporter trafficking is altered by disease condition or drug treatment [55–57], we believe that obtaining pure plasma membrane is not necessary if the ratio of expression of transporter protein in the plasma membrane relative to that in the entire cell is assessed to be similar in tissues (e.g., human livers) and in transporter-expressing cell lines. This assumption can be tested by crudely isolating various subcellular fractions from tissues and cells and comparing the expression of the transporters relative to the marker of plasma membrane (e.g., Na+K+ATPase) in these fractions. Such studies are ongoing in our laboratory and have yielded promising results.
Protein Digestion
The surrogate peptide-based absolute quantification of protein completely relies on the efficiency of protein digestion. Typical trypsin digestion process involves (i) denaturation of transporter proteins by denaturant like urea or sodium deoxycholate (DOC) and heating, (ii) reduction of cysteine residues by dithiothreitol (DTT), (iii) alkylation of thiols by iodoacetamide (IAA), and (iv) protein digestion by addition of sequencing grade trypsin. Optimization of protein/trypsin ratio, incubation time, temperature, pH, surfactant concentration, and stability of trypsin should be considered for the efficient trypsin digestion [58, 59]. Maximum digestion of transporter protein is achieved by incubating protein/trypsin in a ratio of 1:10 to 1:50 for 4–24 h at pH 7.5–8.5 and temperature 37°C. The use of surfactant is important to ensure solubilization of transporter protein. However, high concentration of surfactant can adversely affect trypsin digestion efficiency [58]. Trypsin digestion efficiency can be improved by using specialized equipment such as microwave [60], ultrasonic probe [61], and hydraulic pressure pulse activator [62]. Moreover, addition of serine protease (Lys-C) with trypsin improves digestion efficiency [63, 64]. The use of DOC is preferred over urea as a denaturant [58]. When urea is used, the temperature should not exceed 60°C as the latter results in carbamylation of proteins or peptides. Repigest is another denaturant that is becoming common in shotgun proteomics due to its compatibility with LC-MS/MS [65, 66].
Using the purified transporter protein as a calibration standard addresses the issue of less than 100% protein digestion (Table IV) [67]. For instance, based on pure P-gp protein as a quality control, we found that trypsin digestion of P-gp was close to 100% [11]. Digestion efficiency is not a problem in relative quantification if the variability in trypsin digestion is addressed. Variability can be addressed theoretically by using labeled protein (SILAC protein) as an internal standard. However, we observed that if trypsin digestion is optimized and sample-to-sample variability in the digestion is low, labeled peptide behaves equally well or better than the labeled proteins as an internal standard [13]. Alternatively, QconCAT relies on concatamers of tryptic peptides in an artificial protein as standards and therefore addresses digestion efficiency with the assumption that the rate of trypsin digestion remains similar in the sample and the artificial protein (Table IV) [68–70].
Table IV.
| Method | Principle | Advantages | Limitations |
|---|---|---|---|
| Peptide MRM | Protein is digested and surrogate peptide response is quantified in MRM mode. Synthetic peptide is used as calibration standard. Corresponding stable isotope labeled peptide is used as an internal standard | Simple, sensitive, high-throughput, reproducible, multiplexing capability | Incomplete digestion affects absolute quantification |
| SISCAPA | Combines the precision of peptide MRM with anti-peptide antibody enrichment to improve MRM sensitivity | Sensitivity, no matrix interference | Antibody production is expensive; incomplete digestion affects absolute quantification |
| QconCAT | Both light and heavy QconCAT concatamer construct are designed, expressed, and purified as standards. A known amount of the expressed, isotopically labeled QconCAT proteins are spiked into samples | Allows assessment of digestion efficiency and completeness by including an internal protein standard of a concatamer | Labor-intensive procedure; differences in the digestion of the standard and analyte proteins |
| Protein standard accurate quantification (PSAQ) | Purified intact protein standards (both light and heavy) are produced. A known amount of the purified proteins is spiked into samples | Allows assessment of digestion efficiency and completeness | Labor-intensive and expensive procedure; purification of transmembrane proteins is challenging |
| Conventional SILAC proteomics | Metabolic labelling using heavy amino acids is done in cell culture or in vivo for relative proteomic quantitation | Minimum bias due to handling errors in relative quantification | Generally suitable only for relative quantification |
MRM multiple reaction monitoring, SISCAPA stable isotope standard capture with anti-peptide antibodies, SILAC stable isotope labeling with amino acids in cell culture
To increase confidence in protein quantification, one can use multiple peptides (whenever available). Here, we should note that despite superior precision of the MRM technique, it might be misleading to use the term “absolute” quantification because the latter depends on the degree of protein digestion. Irrespective of the latter, if protein quantification is performed using the same peptide(s) and similar conditions to achieve maximum protein digestion, such data can be used to derive scaling factors for IVIVE from cell lines to human tissues. However, this is only possible if the ratio of intracellular to plasma membrane expression of transporter is similar in tissues and cells.
Sample Preparation for Analysis
Sample cleanup is important for reliable MS signal. Protein or peptides can be enriched by using ultrafiltration, solid phase extraction, or chloroform/methanol extraction described elsewhere [71–73]. If enrichment methods are used, recovery should be evaluated. To do so, an endogenous marker (Na+K+ATPase) or a spiked labeled protein can be used as an enrichment marker. Labeled peptide as an internal standard can be used to address variability in post-digestion steps (e.g., matrix effect). Nonspecific binding to sample container and LC-MS/MS tubing should also be taken into consideration. It is generally preferred to use glass vials or LoBind plastic tubes to store samples and standards.
LC-MS/MS Parameter Optimization
LC separation is critical in MRM proteomics because of the complexity of tissue/cell protein sample. While nano-LC-MS/MS can be used for transporter quantification [14], our discussion is focused on conventional LC-MS/MS. A typical LC run is 15–60 min long in a reverse phase UHPLC column (e.g., 100 × 2.1 mm, particle size <2 μ). The initial mobile phase conditions are low organic solvents (e.g., 0–5% acetonitrile and 100–95% of water with 0.1% formic acid) for the first 3–5 min. This initial step washes polar interferences from the sample. During this step, the flow can be diverted to the waste to avoid MS source contamination and matrix effect. Mobile phase compatibility with the sample should be taken into consideration particularly if the analyte peptides are very polar. The organic phase can be gradually increased, and the slope of the gradient can be adjusted based on the hydrophobicity of the surrogate peptides. The predicted MRM parameters can be systematically tuned using the peptide standard similar to small molecules. Parent and product ions, collision energy, voltage, resolution, and dwell time are the key parameters that should be tuned using the standard.
Method Validation
US FDA bioanalytical method validation guidance can be adopted for LC-MS/MS protein quantification method (http://www.fda.gov/downloads/Drugs/GuidanceComplianceRegulatoryInformation/Guidances/UCM368107.pdf). The validation should include demonstration of parameters such as selectivity, accuracy, precision, recovery, calibration curve, sensitivity, reproducibility, and stability. While MRM methods are generally selective, it is not surprising to observe multiple peaks due to similar parent-product pairs from tryptic digest. Therefore, it is important that a longer LC method and multiple transitions are used to confirm the target peptide signal. Nonavailability of a blank matrix is an important concern in the bioanalysis of endogenous proteins, including transporters. The potential interferences in a trypsin digest not only include other peptides but also include endogenous small molecules and xenobiotics. Therefore, fragments from each parent ion in the actual processed tissue samples (typically from multiple donors, e.g., n = 6) should be used to demonstrate the selectivity. Accuracy can be demonstrated by spiking standard peptide into the processed tissue samples. Within-run and between-run precision should be performed using processed tissue sample with and without adding synthetic standard. Considering the higher variability in protein quantification as compared to small molecules, acceptance criteria of ±25% for accuracy and precision can be used. Sensitivity can be demonstrated by measuring lowest analyte concentration (in sample buffer) that can be measured with acceptable accuracy and precision. It should be noted that the latter is not the actual lower limit of quantification (LLOQ) as the sample matrix does not represent the tissue sample. Therefore, if possible, a sample can be identified that lacks analyte protein (e.g., due to genetic polymorphism or mutation), and LLOQ standard can be spiked into such blank sample to measure the real sensitivity of the method. Effect of freeze and thaw cycles, longer storage, and bench-top exposure on peptide stability should be established. The effect of the above conditions on protein quality can be demonstrated because the quality of protein can alter trypsin digestion. Processed sample stability in auto-sampler should be studied.
Sample Analysis
The ratio of analyte and internal standard response is calculated and plotted against concentration for a given peptide. The calibration equation is then used to calculate concentration in the actual sample. Assessment of peak quality is important as multiple interfering peaks can be observed in the biological sample. One way to assure quality of peaks is by calculating correlation between peptides (or fragments). Vendor-specific software are available for high-throughput post-acquisition data analysis. Tools such as Skyline, AuDIT, and SRMCollider are also helpful in the analysis of large sample size.
While the above discussion mainly focuses on the peptide MRM proteomics, the proposed approach can be extended to other MRM protein assays summarized in Table IV [67–70, 74–79].
P-gp Protein Quantification in Human Liver Tissue, Hepatocytes, and Cell Lines
We selected two surrogate peptides for P-gp quantification, NTTGALTTR and IATEAIENFR, based on the above-discussed approaches (Table III). P-gp protein expression was quantified in the School of Pharmacy, University of Washington human liver bank, hepatocytes, and LLCPKII cells (Fig. 6) using a validated method [11]. The cell line expressed ~120-fold higher P-gp protein than that expressed in the hepatocytes or human liver. NTTGALTTR was used for this quantification because it resulted in ~1.4-fold higher yield than IATEAIENFR perhaps due to the better trypsin digestion efficiency of the former.
Fig. 6.
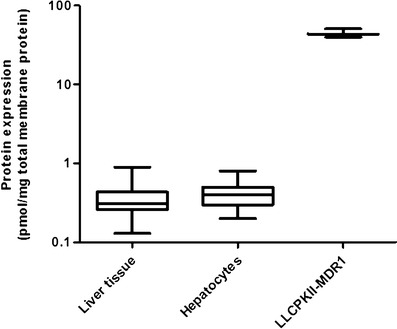
P-gp protein expression in human liver tissue (n = 64), human hepatocytes [11], and human P-gp-expressing LLCPKII cells (n = 3; passage number—approximately 45). Horizontal line, median; plus sign, mean; boxes, 25th–75th percentiles; whiskers, non-outlier range
CONCLUSION
MRM proteomics has emerged as the gold standard for transporter protein quantification [14, 16, 27, 31]. For successful application of this technique, selection of the surrogate peptide(s) is a critical step in assay development. Selection of the peptide(s) can be facilitated using bioinformatic tools. A critical assumption in peptide MRM proteomics is that the protein digestion is considered complete. Although the term absolute quantification is commonly used in the field, it can be used only when complete digestion efficiency is assured. Such assurance can be obtained only when the pure protein standard is available. However, if the same peptide and similar digestion conditions are used for transporter quantification in cells and tissues, such relative quantification can still be used for IVIVE. Such an IVIVE approach is not limited to a particular organ (e.g., liver), but it can be used to extrapolate drug disposition to any tissue. Taken together, the emergence of MRM transporter proteomic approach is an important milestone in systems pharmacology to better predict drug disposition and drug response/toxicity.
Acknowledgments
This study was supported in part by The University of Washington Research Affiliate program on Transporters (UWRAPT).
References
- 1.Giacomini KM, Huang SM, Tweedie DJ, Benet LZ, Brouwer KL, Chu X, et al. Membrane transporters in drug development. Nat Rev Drug Discov. 2010;9(3):215–236. doi: 10.1038/nrd3028. [DOI] [PMC free article] [PubMed] [Google Scholar]
- 2.Keogh JP. Membrane transporters in drug development. Adv Pharmacol. 2012;63:1–42. doi: 10.1016/B978-0-12-398339-8.00001-X. [DOI] [PubMed] [Google Scholar]
- 3.Yan Q. Membrane transporters and drug development: relevance to pharmacogenomics, nutrigenomics, epigenetics, and systems biology. Methods Mol Biol. 2010;637:1–21. doi: 10.1007/978-1-60761-700-6_1. [DOI] [PubMed] [Google Scholar]
- 4.Eyal S, Chung FS, Muzi M, Link JM, Mankoff DA, Kaddoumi A, et al. Simultaneous PET imaging of P-glycoprotein inhibition in multiple tissues in the pregnant nonhuman primate. J Nucl Med. 2009;50(5):798–806. doi: 10.2967/jnumed.108.059360. [DOI] [PMC free article] [PubMed] [Google Scholar]
- 5.Eyal S, Ke B, Muzi M, Link JM, Mankoff DA, Collier AC, et al. Regional P-glycoprotein activity and inhibition at the human blood–brain barrier as imaged by positron emission tomography. Clin Pharmacol Ther. 2010;87(5):579–585. doi: 10.1038/clpt.2010.11. [DOI] [PMC free article] [PubMed] [Google Scholar]
- 6.Muzi M, Mankoff DA, Link JM, Shoner S, Collier AC, Sasongko L, et al. Imaging of cyclosporine inhibition of P-glycoprotein activity using 11C-verapamil in the brain: studies of healthy humans. J Nucl Med. 2009;50(8):1267–1275. doi: 10.2967/jnumed.108.059162. [DOI] [PMC free article] [PubMed] [Google Scholar]
- 7.Harwood MD, Neuhoff S, Carlson GL, Warhurst G, Rostami-Hodjegan A. Absolute abundance and function of intestinal drug transporters: a prerequisite for fully mechanistic in vitro-in vivo extrapolation of oral drug absorption. Biopharm Drug Dispos. 2012;34(1):2–28. doi: 10.1002/bdd.1810. [DOI] [PubMed] [Google Scholar]
- 8.Proctor NJ, Tucker GT, Rostami-Hodjegan A. Predicting drug clearance from recombinantly expressed CYPs: intersystem extrapolation factors. Xenobiotica. 2004;34(2):151–178. doi: 10.1080/00498250310001646353. [DOI] [PubMed] [Google Scholar]
- 9.Deo AK, Prasad B, Balogh L, Lai Y, Unadkat JD. Interindividual variability in hepatic expression of the multidrug resistance-associated protein 2 (MRP2/ABCC2): quantification by liquid chromatography/tandem mass spectrometry. Drug Metab Dispos. 2012;40(5):852–855. doi: 10.1124/dmd.111.043810. [DOI] [PMC free article] [PubMed] [Google Scholar]
- 10.Lee N, Hebert MF, Prasad B, Easterling TR, Kelly EJ, Unadkat JD, et al. Effect of gestational age on mRNA and protein expression of polyspecific organic cation transporters during pregnancy. Drug Metab Dispos. 2013. [DOI] [PMC free article] [PubMed]
- 11.Prasad B, Evers R, Gupta A, Hop CE, Salphati L, Shukla S, et al. Interindividual variability in hepatic organic anion-transporting polypeptides and P-glycoprotein (ABCB1) protein expression: quantification by liquid chromatography tandem mass spectroscopy and influence of genotype, age, and sex. Drug Metab Dispos. 2013. [DOI] [PMC free article] [PubMed]
- 12.Prasad B, Lai Y, Lin Y, Unadkat JD. Interindividual variability in the hepatic expression of the human breast cancer resistance protein (BCRP/ABCG2): effect of age, sex, and genotype. J Pharm Sci. 2013;102(3):787–793. doi: 10.1002/jps.23436. [DOI] [PubMed] [Google Scholar]
- 13.Prasad B, Unadkat J. Comparison of heavy labeled (SIL) peptide vs. SILAC protein internal standards for LC-MS/MS quantification of hepatic drug transporters. Int J Proteomics. 2014;2014:1–11. doi: 10.1155/2014/451510. [DOI] [PMC free article] [PubMed] [Google Scholar]
- 14.Ohtsuki S, Schaefer O, Kawakami H, Inoue T, Liehner S, Saito A, et al. Simultaneous absolute protein quantification of transporters, cytochromes P450, and UDP-glucuronosyltransferases as a novel approach for the characterization of individual human liver: comparison with mRNA levels and activities. Drug Metab Dispos. 2011;40(1):83–92. doi: 10.1124/dmd.111.042259. [DOI] [PubMed] [Google Scholar]
- 15.Agarwal S, Uchida Y, Mittapalli RK, Sane R, Terasaki T, Elmquist WF. Quantitative proteomics of transporter expression in brain capillary endothelial cells isolated from P-glycoprotein (P-gp), breast cancer resistance protein (Bcrp), and P-gp/Bcrp knockout mice. Drug Metab Dispos. 2012;40(6):1164–1169. doi: 10.1124/dmd.112.044719. [DOI] [PMC free article] [PubMed] [Google Scholar]
- 16.Ohtsuki S, Uchida Y, Kubo Y, Terasaki T. Quantitative targeted absolute proteomics-based ADME research as a new path to drug discovery and development: methodology, advantages, strategy, and prospects. J Pharm Sci. 2011;100(9):3547–3559. doi: 10.1002/jps.22612. [DOI] [PubMed] [Google Scholar]
- 17.Uchida Y, Ohtsuki S, Katsukura Y, Ikeda C, Suzuki T, Kamiie J, et al. Quantitative targeted absolute proteomics of human blood–brain barrier transporters and receptors. J Neurochem. 2011;117(2):333–345. doi: 10.1111/j.1471-4159.2011.07208.x. [DOI] [PubMed] [Google Scholar]
- 18.Uchida Y, Tachikawa M, Obuchi W, Hoshi Y, Tomioka Y, Ohtsuki S, et al. A study protocol for quantitative targeted absolute proteomics (QTAP) by LC-MS/MS: application for inter-strain differences in protein expression levels of transporters, receptors, claudin-5, and marker proteins at the blood–brain barrier in ddY, FVB, and C57BL/6 J mice. Fluids Barriers CNS. 2013;10(1):21. doi: 10.1186/2045-8118-10-21. [DOI] [PMC free article] [PubMed] [Google Scholar]
- 19.Groer C, Bruck S, Lai Y, Paulick A, Busemann A, Heidecke CD, et al. LC-MS/MS-based quantification of clinically relevant intestinal uptake and efflux transporter proteins. J Pharm Biomed Anal. 2013;85:253–261. doi: 10.1016/j.jpba.2013.07.031. [DOI] [PubMed] [Google Scholar]
- 20.Qiu X, Bi YA, Balogh LM, Lai Y. Absolute measurement of species differences in sodium taurocholate cotransporting polypeptide (NTCP/Ntcp) and its modulation in cultured hepatocytes. J Pharm Sci. 2013;102(9):3252–3263. doi: 10.1002/jps.23582. [DOI] [PubMed] [Google Scholar]
- 21.Zhang Y, Li N, Brown PW, Ozer JS, Lai Y. Liquid chromatography/tandem mass spectrometry based targeted proteomics quantification of P-glycoprotein in various biological samples. Rapid Commun Mass Spectrom. 2011;25(12):1715–1724. doi: 10.1002/rcm.5026. [DOI] [PubMed] [Google Scholar]
- 22.Li N, Singh P, Mandrell KM, Lai Y. Improved extrapolation of hepatobiliary clearance from in vitro sandwich cultured rat hepatocytes through absolute quantification of hepatobiliary transporters. Mol Pharm. 2010;7(3):630–641. doi: 10.1021/mp9001574. [DOI] [PubMed] [Google Scholar]
- 23.Li N, Palandra J, Nemirovskiy OV, Lai Y. LC-MS/MS mediated absolute quantification and comparison of bile salt export pump and breast cancer resistance protein in livers and hepatocytes across species. Anal Chem. 2009;81(6):2251–2259. doi: 10.1021/ac8024009. [DOI] [PubMed] [Google Scholar]
- 24.Li N, Nemirovskiy OV, Zhang Y, Yuan H, Mo J, Ji C, et al. Absolute quantification of multidrug resistance-associated protein 2 (MRP2/ABCC2) using liquid chromatography tandem mass spectrometry. Anal Biochem. 2008;380(2):211–222. doi: 10.1016/j.ab.2008.05.032. [DOI] [PubMed] [Google Scholar]
- 25.Maiolica A, Junger MA, Ezkurdia I, Aebersold R. Targeted proteome investigation via selected reaction monitoring mass spectrometry. J Proteome. 2012;75(12):3495–3513. doi: 10.1016/j.jprot.2012.04.048. [DOI] [PubMed] [Google Scholar]
- 26.Picotti P, Aebersold R. Selected reaction monitoring-based proteomics: workflows, potential, pitfalls and future directions. Nat Methods. 2013;9(6):555–566. doi: 10.1038/nmeth.2015. [DOI] [PubMed] [Google Scholar]
- 27.Kamiie J, Ohtsuki S, Iwase R, Ohmine K, Katsukura Y, Yanai K, et al. Quantitative atlas of membrane transporter proteins: development and application of a highly sensitive simultaneous LC/MS/MS method combined with novel in-silico peptide selection criteria. Pharm Res. 2008;25(6):1469–1483. doi: 10.1007/s11095-008-9532-4. [DOI] [PubMed] [Google Scholar]
- 28.Oswald S, Groer C, Drozdzik M, Siegmund W. Mass spectrometry-based targeted proteomics as a tool to elucidate the expression and function of intestinal drug transporters. AAPS J. 2013;15(4):1128–1140. doi: 10.1208/s12248-013-9521-3. [DOI] [PMC free article] [PubMed] [Google Scholar]
- 29.Vuckovic D, Dagley LF, Purcell AW, Emili A. Membrane proteomics by high performance liquid chromatography-tandem mass spectrometry: analytical approaches and challenges. Proteomics. 2013;13(3–4):404–423. doi: 10.1002/pmic.201200340. [DOI] [PubMed] [Google Scholar]
- 30.Shukla HD, Vaitiekunas P, Cotter RJ. Advances in membrane proteomics and cancer biomarker discovery: current status and future perspective. Proteomics. 2012;12(19–20):3085–3104. doi: 10.1002/pmic.201100519. [DOI] [PubMed] [Google Scholar]
- 31.Aebersold R, Burlingame AL, Bradshaw RA. Western blots versus selected reaction monitoring assays: time to turn the tables? Mol Cell Proteomics. 2013;12(9):2381–2382. doi: 10.1074/mcp.E113.031658. [DOI] [PMC free article] [PubMed] [Google Scholar]
- 32.Hoofnagle AN, Wener MH. The fundamental flaws of immunoassays and potential solutions using tandem mass spectrometry. J Immunol Methods. 2009;347(1–2):3–11. doi: 10.1016/j.jim.2009.06.003. [DOI] [PMC free article] [PubMed] [Google Scholar]
- 33.Razavi M, Frick LE, LaMarr WA, Pope ME, Miller CA, Anderson NL, et al. High-throughput SISCAPA quantitation of peptides from human plasma digests by ultrafast, liquid chromatography-free mass spectrometry. J Proteome Res. 2012;11(12):5642–5649. doi: 10.1021/pr300652v. [DOI] [PubMed] [Google Scholar]
- 34.Anderson L, Hunter CL. Quantitative mass spectrometric multiple reaction monitoring assays for major plasma proteins. Mol Cell Proteomics. 2006;5(4):573–588. doi: 10.1074/mcp.M500331-MCP200. [DOI] [PubMed] [Google Scholar]
- 35.Schmidt C, Lenz C, Grote M, Luhrmann R, Urlaub H. Determination of protein stoichiometry within protein complexes using absolute quantification and multiple reaction monitoring. Anal Chem. 2010;82(7):2784–2796. doi: 10.1021/ac902710k. [DOI] [PubMed] [Google Scholar]
- 36.Brant SR, Panhuysen CI, Nicolae D, Reddy DM, Bonen DK, Karaliukas R, et al. MDR1 Ala893 polymorphism is associated with inflammatory bowel disease. Am J Hum Genet. 2003;73(6):1282–1292. doi: 10.1086/379927. [DOI] [PMC free article] [PubMed] [Google Scholar]
- 37.Kuzyk MA, Parker CE, Domanski D, Borchers CH. Development of MRM-based assays for the absolute quantitation of plasma proteins. Methods Mol Biol. 2013;1023:53–82. doi: 10.1007/978-1-4614-7209-4_4. [DOI] [PubMed] [Google Scholar]
- 38.Kioka N, Tsubota J, Kakehi Y, Komano T, Gottesman MM, Pastan I, et al. P-glycoprotein gene (MDR1) cDNA from human adrenal: normal P-glycoprotein carries Gly185 with an altered pattern of multidrug resistance. Biochem Biophys Res Commun. 1989;162(1):224–231. doi: 10.1016/0006-291X(89)91985-2. [DOI] [PubMed] [Google Scholar]
- 39.Chen G, Duran GE, Steger KA, Lacayo NJ, Jaffrezou JP, Dumontet C, et al. Multidrug-resistant human sarcoma cells with a mutant P-glycoprotein, altered phenotype, and resistance to cyclosporins. J Biol Chem. 1997;272(9):5974–5982. doi: 10.1074/jbc.272.9.5974. [DOI] [PubMed] [Google Scholar]
- 40.Rodriguez J, Gupta N, Smith RD, Pevzner PA. Does trypsin cut before proline? J Proteome Res. 2008;7(1):300–305. doi: 10.1021/pr0705035. [DOI] [PubMed] [Google Scholar]
- 41.Lai M, Skanchy D, Stobaugh J, Topp E. Capillary electrophoresis separation of an asparagine containing hexapeptide and its deamidation products. J Pharm Biomed Anal. 1998;18(3):421–427. doi: 10.1016/S0731-7085(98)00049-1. [DOI] [PubMed] [Google Scholar]
- 42.Neta P, Pu QL, Kilpatrick L, Yang X, Stein SE. Dehydration versus deamination of N-terminal glutamine in collision-induced dissociation of protonated peptides. J Am Soc Mass Spectrom. 2007;18(1):27–36. doi: 10.1016/j.jasms.2006.08.016. [DOI] [PubMed] [Google Scholar]
- 43.Suzuki Y, Motoi H, Sato K. Quantitative analysis of pyroglutamic acid in peptides. J Agric Food Chem. 1999;47(8):3248–3251. doi: 10.1021/jf990003z. [DOI] [PubMed] [Google Scholar]
- 44.Crimmins DL, Mische SM, Denslow ND. Chemical cleavage of proteins in solution. Curr Protoc Protein Sci. 2005;Chapter 11:Unit 11 4. [DOI] [PubMed]
- 45.Lange V, Picotti P, Domon B, Aebersold R. Selected reaction monitoring for quantitative proteomics: a tutorial. Mol Syst Biol. 2008;4:222. doi: 10.1038/msb.2008.61. [DOI] [PMC free article] [PubMed] [Google Scholar]
- 46.Sprung RW, Martinez MA, Carpenter KL, Ham AJ, Washington MK, Arteaga CL, et al. Precision of multiple reaction monitoring mass spectrometry analysis of formalin-fixed, paraffin-embedded tissue. J Proteome Res. 2012. [DOI] [PMC free article] [PubMed]
- 47.Li S, Schoneich C, Borchardt RT. Chemical instability of protein pharmaceuticals: mechanisms of oxidation and strategies for stabilization. Biotechnol Bioeng. 1995;48(5):490–500. doi: 10.1002/bit.260480511. [DOI] [PubMed] [Google Scholar]
- 48.Isidro-Llobet A, Alvarez M, Albericio F. Amino acid-protecting groups. Chem Rev. 2009;109(6):2455–2504. doi: 10.1021/cr800323s. [DOI] [PubMed] [Google Scholar]
- 49.Krchnak V, Flegelova Z, Vagner J. Aggregation of resin-bound peptides during solid-phase peptide synthesis. Prediction of difficult sequences. Int J Pept Protein Res. 1993;42(5):450–454. doi: 10.1111/j.1399-3011.1993.tb00153.x. [DOI] [PubMed] [Google Scholar]
- 50.Orsburn BC, Stockwin LH, Newton DL. Challenges in plasma membrane phosphoproteomics. Exp Rev Proteome. 2011;8(4):483–494. doi: 10.1586/epr.11.40. [DOI] [PMC free article] [PubMed] [Google Scholar]
- 51.Wang Z, Fu M, Wang L, Liu J, Li Y, Brakebusch C, et al. p21-Activated kinase 1 (PAK1) can promote ERK activation in a kinase-independent manner. J Biol Chem. 2013;288(27):20093–20099. doi: 10.1074/jbc.M112.426023. [DOI] [PMC free article] [PubMed] [Google Scholar]
- 52.Bi YA, Qiu X, Rotter CJ, Kimoto E, Piotrowski M, Varma MV, et al. Quantitative assessment of the contribution of sodium-dependent taurocholate co-transporting polypeptide (NTCP) to the hepatic uptake of rosuvastatin, pitavastatin and fluvastatin. Biopharm Drug Dispos. 2013;34(8):452–461. doi: 10.1002/bdd.1861. [DOI] [PubMed] [Google Scholar]
- 53.Li N, Bi YA, Duignan DB, Lai Y. Quantitative expression profile of hepatobiliary transporters in sandwich cultured rat and human hepatocytes. Mol Pharm. 2009;6(4):1180–1189. doi: 10.1021/mp900044x. [DOI] [PubMed] [Google Scholar]
- 54.Li M, Yuan H, Li N, Song G, Zheng Y, Baratta M, et al. Identification of interspecies difference in efflux transporters of hepatocytes from dog, rat, monkey and human. Eur J Pharm Sci. 2008;35(1–2):114–126. doi: 10.1016/j.ejps.2008.06.008. [DOI] [PubMed] [Google Scholar]
- 55.Noack A, Noack S, Hoffmann A, Maalouf K, Buettner M, Couraud PO, et al. Drug-induced trafficking of p-glycoprotein in human brain capillary endothelial cells as demonstrated by exposure to mitomycin C. PLoS ONE. 2014;9(2):e88154. doi: 10.1371/journal.pone.0088154. [DOI] [PMC free article] [PubMed] [Google Scholar]
- 56.Howell GJ, Holloway ZG, Cobbold C, Monaco AP, Ponnambalam S. Cell biology of membrane trafficking in human disease. Int Rev Cytol. 2006;252:1–69. doi: 10.1016/S0074-7696(06)52005-4. [DOI] [PMC free article] [PubMed] [Google Scholar]
- 57.Ameen N, Silvis M, Bradbury NA. Endocytic trafficking of CFTR in health and disease. J Cyst Fibros. 2007;6(1):1–14. doi: 10.1016/j.jcf.2006.09.002. [DOI] [PMC free article] [PubMed] [Google Scholar]
- 58.Proc JL, Kuzyk MA, Hardie DB, Yang J, Smith DS, Jackson AM, et al. A quantitative study of the effects of chaotropic agents, surfactants, and solvents on the digestion efficiency of human plasma proteins by trypsin. J Proteome Res. 2010;9(10):5422–5437. doi: 10.1021/pr100656u. [DOI] [PMC free article] [PubMed] [Google Scholar]
- 59.Burkhart JM, Schumbrutzki C, Wortelkamp S, Sickmann A, Zahedi RP. Systematic and quantitative comparison of digest efficiency and specificity reveals the impact of trypsin quality on MS-based proteomics. J Proteome. 2011;75(4):1454–1462. doi: 10.1016/j.jprot.2011.11.016. [DOI] [PubMed] [Google Scholar]
- 60.Ye X, Li L. Microwave-assisted protein solubilization for mass spectrometry-based shotgun proteome analysis. Anal Chem. 2012;84(14):6181–6191. doi: 10.1021/ac301169q. [DOI] [PubMed] [Google Scholar]
- 61.Rial-Otero R, Carreira RJ, Cordeiro FM, Moro AJ, Santos HM, Vale G, et al. Ultrasonic assisted protein enzymatic digestion for fast protein identification by matrix-assisted laser desorption/ionization time-of-flight mass spectrometry. Sonoreactor versus ultrasonic probe. J Chromatogr A. 2007;1166(1–2):101–107. doi: 10.1016/j.chroma.2007.08.013. [DOI] [PubMed] [Google Scholar]
- 62.Lopez-Ferrer D, Petritis K, Hixson KK, Heibeck TH, Moore RJ, Belov ME, et al. Application of pressurized solvents for ultrafast trypsin hydrolysis in proteomics: proteomics on the fly. J Proteome Res. 2008;7(8):3276–3281. doi: 10.1021/pr7008077. [DOI] [PMC free article] [PubMed] [Google Scholar]
- 63.Krenkova J, Lacher NA, Svec F. Highly efficient enzyme reactors containing trypsin and endoproteinase LysC immobilized on porous polymer monolith coupled to MS suitable for analysis of antibodies. Anal Chem. 2009;81(5):2004–2012. doi: 10.1021/ac8026564. [DOI] [PubMed] [Google Scholar]
- 64.Saveliev S, Bratz M, Zubarev R, Szapacs M, Budamgunta H, Urh M. Trypsin/Lys-C protease mix for enhanced protein mass spectrometry analysis. Nature Methods. 2013;10.
- 65.Leon IR, Schwammle V, Jensen ON, Sprenger RR. Quantitative assessment of in-solution digestion efficiency identifies optimal protocols for unbiased protein analysis. Mol Cell Proteomics. 2013;12(10):2992–3005. doi: 10.1074/mcp.M112.025585. [DOI] [PMC free article] [PubMed] [Google Scholar]
- 66.Tanca A, Biosa G, Pagnozzi D, Addis MF, Uzzau S. Comparison of detergent-based sample preparation workflows for LTQ-Orbitrap analysis of the Escherichia coli proteome. Proteomics. 2013;13(17):2597–2607. doi: 10.1002/pmic.201200478. [DOI] [PubMed] [Google Scholar]
- 67.Adrait A, Lebert D, Trauchessec M, Dupuis A, Louwagie M, Masselon C, et al. Development of a Protein Standard Absolute Quantification (PSAQ) assay for the quantification of Staphylococcus aureus enterotoxin A in serum. J Proteome. 2011;75(10):3041–3049. doi: 10.1016/j.jprot.2011.11.031. [DOI] [PubMed] [Google Scholar]
- 68.Brownridge PJ, Harman VM, Simpson DM, Beynon RJ. Absolute multiplexed protein quantification using QconCAT technology. Methods Mol Biol. 2012;893:267–293. doi: 10.1007/978-1-61779-885-6_18. [DOI] [PubMed] [Google Scholar]
- 69.Castro-Borges W, Simpson DM, Dowle A, Curwen RS, Thomas-Oates J, Beynon RJ, et al. Abundance of tegument surface proteins in the human blood fluke Schistosoma mansoni determined by QconCAT proteomics. J Proteome. 2011;74(9):1519–1533. doi: 10.1016/j.jprot.2011.06.011. [DOI] [PubMed] [Google Scholar]
- 70.Russell MR, Achour B, McKenzie EA, Lopez R, Harwood MD, Rostami-Hodjegan A, et al. Alternative fusion protein strategies to express recalcitrant QconCAT proteins for quantitative proteomics of human drug metabolizing enzymes and transporters. J Proteome Res. 2013;12(12):5934–5942. doi: 10.1021/pr400279u. [DOI] [PubMed] [Google Scholar]
- 71.Vertommen A, Panis B, Swennen R, Carpentier SC. Evaluation of chloroform/methanol extraction to facilitate the study of membrane proteins of non-model plants. Planta. 2010;231(5):1113–1125. doi: 10.1007/s00425-010-1121-1. [DOI] [PMC free article] [PubMed] [Google Scholar]
- 72.Chernokalskaya E, Gutierrez S, Pitt AM, Leonard JT. Ultrafiltration for proteomic sample preparation. Electrophoresis. 2004;25(15):2461–2468. doi: 10.1002/elps.200405998. [DOI] [PubMed] [Google Scholar]
- 73.Wang H, Qian WJ, Mottaz HM, Clauss TR, Anderson DJ, Moore RJ, et al. Development and evaluation of a micro- and nanoscale proteomic sample preparation method. J Proteome Res. 2005;4(6):2397–2403. doi: 10.1021/pr050160f. [DOI] [PMC free article] [PubMed] [Google Scholar]
- 74.Amelina H, Sjodin MO, Bergquist J, Cristobal S. Quantitative subproteomic analysis of age-related changes in mouse liver peroxisomes by iTRAQ LC-MS/MS. J Chromatogr B Anal Technol Biomed Life Sci. 2011;879(30):3393–3400. doi: 10.1016/j.jchromb.2011.08.044. [DOI] [PubMed] [Google Scholar]
- 75.Bergmann U, Ahrends R, Neumann B, Scheler C, Linscheid MW. Application of metal-coded affinity tags (MeCAT): absolute protein quantification with top-down and bottom-up workflows by metal-coded tagging. Anal Chem. 2012;84(12):5268–5275. doi: 10.1021/ac203460b. [DOI] [PubMed] [Google Scholar]
- 76.Bettmer J. Application of isotope dilution ICP-MS techniques to quantitative proteomics. Anal Bioanal Chem. 2010;397(8):3495–3502. doi: 10.1007/s00216-010-3861-y. [DOI] [PubMed] [Google Scholar]
- 77.Butler GS, Dean RA, Morrison CJ, Overall CM. Identification of cellular MMP substrates using quantitative proteomics: isotope-coded affinity tags (ICAT) and isobaric tags for relative and absolute quantification (iTRAQ) Methods Mol Biol. 2010;622:451–470. doi: 10.1007/978-1-60327-299-5_26. [DOI] [PubMed] [Google Scholar]
- 78.Chen Z, Wang Q, Lin L, Tang Q, Edwards JL, Li S, et al. Comparative evaluation of two isobaric labeling tags, DiART and iTRAQ. Anal Chem. 2012;84(6):2908–2915. doi: 10.1021/ac203467q. [DOI] [PubMed] [Google Scholar]
- 79.Colaert N, Gevaert K, Martens L. RIBAR and xRIBAR: methods for reproducible relative MS/MS-based label-free protein quantification. J Proteome Res. 2011;10(7):3183–3189. doi: 10.1021/pr200219x. [DOI] [PubMed] [Google Scholar]
- 80.Anderson NL, Jackson A, Smith D, Hardie D, Borchers C, Pearson TW. SISCAPA peptide enrichment on magnetic beads using an in-line bead trap device. Mol Cell Proteomics. 2009;8(5):995–1005. doi: 10.1074/mcp.M800446-MCP200. [DOI] [PMC free article] [PubMed] [Google Scholar]
- 81.Anderson NL, Anderson NG, Haines LR, Hardie DB, Olafson RW, Pearson TW. Mass spectrometric quantitation of peptides and proteins using Stable Isotope Standards and Capture by Anti-Peptide Antibodies (SISCAPA) J Proteome Res. 2004;3(2):235–244. doi: 10.1021/pr034086h. [DOI] [PubMed] [Google Scholar]
- 82.Ong SE, Blagoev B, Kratchmarova I, Kristensen DB, Steen H, Pandey A, et al. Stable isotope labeling by amino acids in cell culture, SILAC, as a simple and accurate approach to expression proteomics. Mol Cell Proteomics. 2002;1(5):376–386. doi: 10.1074/mcp.M200025-MCP200. [DOI] [PubMed] [Google Scholar]