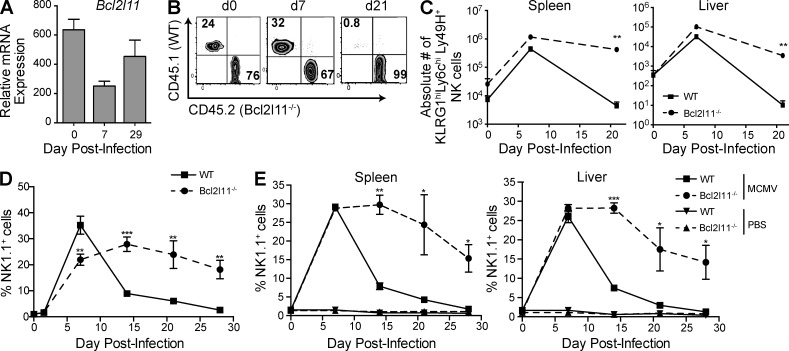
Figure 1.
Bcl2l11−/− Ly49H+ NK cells expand normally but demonstrate impaired contraction. (A) Levels of Bim mRNA are shown as relative levels for Ly49H+ NK cells after MCMV infection. (B) Plots show ratios of Bcl2l11−/− and WT Ly49H+ cells in the spleen of mixed BM chimeric mice after MCMV infection (days 0, 7, and 21) of representative mice. (C) Absolute numbers of the WT and Bcl2l11−/− KLRG1+Ly6ChiLy49H+ cells are plotted. (D) Adoptively transferred Bcl2l11−/− (CD45.2) and WT (CD45.1) Ly49H+ NK cells in peripheral blood were analyzed at days 1.5, 5, 7, 14, 21, and 28 after MCMV and are expressed as a percentage of NK1.1+TCRβ− NK cells. (E) Tissue lymphocytes were analyzed at days 7, 21, and 28; graph shows Bcl2l11−/− and WT Ly49H+ cells expressed as a percentage of NK1.1+TCRβ− NK cells. For all panels, n = 3 mice per time point, and data are representative of two to three independent experiments. Error bars signify the standard error of the mean. ***, P < 0.0005; **, P < 0.005; *, P < 0.05 (paired Student’s t test).

