Figure 2.
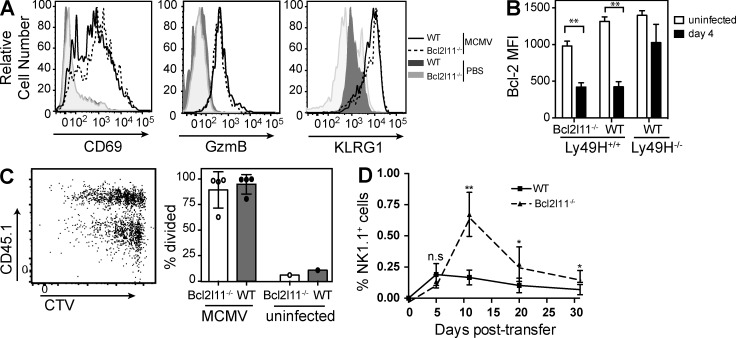
Bcl2l11−/− Ly49H+ NK cells respond normally to MCMV and proliferate similarly to WT NK cells. (A–D) Adoptively transferred Bcl2l11−/− and WT Ly49H+ NK cells were analyzed at days 3 (B) and 4 (A, C, and D) after MCMV. Splenocytes were gated on NK1.1+TCRβ−Ly49H+ cells. (A) Representative histogram of the expression of CD69, GzmB, and KLRG1 on Bcl2l11−/− (dashed lines) and WT (solid lines) NK cells, with uninfected mice shown as control (shaded). (B) Bar graphs depict median fluorescence intensity (MFI) of intracellular Bcl-2 levels in Bcl2l11−/− and WT Ly49H+ and Ly49H− NK cells at day 4 p.i. compared with uninfected controls. n = 4 mice per group. (C) Cell division was analyzed using dilution of CellTrace violet. A representative dot plot (left) and bar graph (right) are shown (n = 4 mice). (D) Bcl2l11−/− and WT cells (1:1) NK cells transferred into Rag2−/−Il2rg−/− mice were tracked in peripheral blood and plotted as a percentage of NK1.1+TCRβ− NK cells (n = 3 mice per time point). Data in each panel are representative of two independent experiments. Error bars signify the standard error of the mean. **, P < 0.005; *, P < 0.05.

