Figure 3.
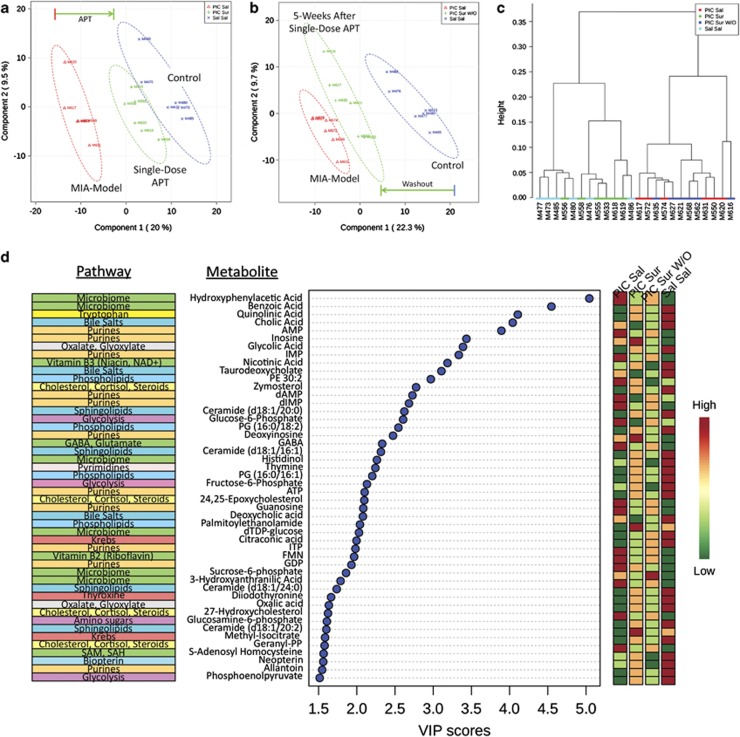
Metabolomic analysis. (a) APT rescues widespread metabolic abnormalities. Plasma samples were collected 2 days after a single dose of suramin (20 mg kg−1 i.p.) or saline (5 μl g−1 i.p.). This analysis shows that a single dose of suramin (PIC-Sur; green) drives the metabolism of MIA animals (PIC-Sal; red) strongly in the direction of controls (Sal-Sal; blue). Metabolomic profiles consisted of 478 metabolites from 44 biochemical pathways measured with LC-MS/MS. N=6, 6.5-month-old males per group. (b) Metabolic memory preserves metabolic rescue by APT. This analysis shows that 5 weeks after a single dose of suramin (PIC-Sur W/O; green) the metabolism of treated animals has drifted back toward that of untreated, MIA animals (PIC-Sal; red; N=6 males per group). (c) Hierarchical clustering of suramin-treated and suramin-washout metabotypes. This analysis illustrates the metabolic similarity of control (Sal-Sal; light blue) and MIA animals treated with one dose of suramin (PIC-Sur; green) compared with saline-treated MIA animals (PIC-Sal; red) and ASD-like animals tested 5 weeks after suramin washout (PIC-Sur W/O; dark blue). The numbers listed along the x axis are animal ID numbers. (d) Rank Order of metabolites disturbed in the MIA model. Multivariate analysis across the four treatment groups (PIC-Sal=MIA; PIC-Sur=acute suramin treatment; PIC-Sur w/o=5 weeks post-suramin washout; Sal-Sal=Controls). Biochemical pathway assignments are listed on the left. Relative magnitudes of each metabolite disturbance are listed on the right as high (red), intermediate (yellow or light green) and low (dark green). Variable importance in projection (VIP) scores are a multivariate statistic that reflects the impact of each metabolite on the partial least squares discriminant analysis model. VIP scores above 1.5 are significant.

