

Abstract
The possibility of a large-scale acute radiation exposure necessitates the development of new methods that could provide rapid individual dose estimates with high sample throughput. The focus of the study was an intercomparison of laboratories’ dose-assessment performances using gene expression assays. Lithium-heparinized whole blood from one healthy donor was irradiated (240 kVp, 1 Gy/min) immediately after venipuncture at approximately 37°C using single X-ray doses. Blood samples to establish calibration curves (0.25–4 Gy) as well as 10 blinded test samples (0.1–6.4 Gy) were incubated for 24 h at 37°C supplemented with an equal volume of medium and 10% fetal calf serum. For quantitative reverse transcription polymerase chain reaction (qRT-PCR), samples were lysed, stored at −20°C and shipped on ice. For the Chemical Ligation Dependent Probe Amplification methodology (CLPA), aliquots were incubated in 2 ml CLPA reaction buffer (DxTerity), mixed and shipped at room temperature. Assays were run in each laboratory according to locally established protocols. The mean absolute difference (MAD) of estimated doses relative to the true doses (in Gy) was calculated. We also merged doses into binary categories reflecting aspects of clinical/diagnostic relevance and examined accuracy, sensitivity and specificity. The earliest reported time on dose estimates was <8 h. The standard deviation of technical replicate measurements in 75% of all measurements was below 11%. MAD values of 0.3–0.5 Gy and 0.8–1.3 Gy divided the laboratories contributions into two groups. These fourfold differences in accuracy could be primarily explained by unexpected variances of the housekeeping gene (P =0.0008) and performance differences in processing of calibration and blinded test samples by half of the contributing laboratories. Reported gene expression dose estimates aggregated into binary categories in general showed an accuracies and sensitivities of 93–100% and 76–100% for the groups, with low MAD and high MAD, respectively. In conclusion, gene expression-based dose estimates were reported quickly, and for laboratories with MAD between 0.3–0.5 Gy binary dose categories of clinical significance could be discriminated with an accuracy and sensitivity comparable to established cytogenetic assays.
INTRODUCTION
Exposures to the environmental ionizing radiation (IR) are usually low but radiation accidents and incidents can result in significant exposures. In the case of a large-scale radiological emergency, an initial “triage” of exposed individuals based on a rapid assessment of the doses received would be necessary to evaluate the extent of radiation injuries and appropriate treatment (1).
Current methods for biological dosimetry such as the scoring of chromosome damage, particularly dicentric chromosomes, are reliable and sensitive (2) but would be inadequate for mass screening after an accident or incident due to limited capacity (3). In addition, the techniques available today for biodosimetry purposes are not fully adapted to rapid high-throughput measurements of the doses in large numbers of individuals. Therefore, new minimally invasive methods that could rapidly provide individual dose estimates with greater sample throughput are sought and would be of great value in incident management.
While other established cytogenetic techniques such as micronuclei (4) or premature chromosome condensation could be potentially used (5), more recently, protein techniques have shown some potential, for biological dosimetry, and early data on protein biomarkers such as histone phosphorylation (γ-H2AX) (6) or global proteomics approaches (7) are promising. Another emerging technique for biodosimetry is based on gene expression analysis: Exposure of cells to IR activates multiple signal transduction pathways and there are a number of genes whose expression is modified in a dose-dependent manner after IR exposure (8). These radiation responsive genes can be used as biomarkers of exposure to radiation (9) and gene expression could therefore be potentially be used for high-throughput minimally invasive radiation biodosimetry (10–12).
To our knowledge, there have been no systematic studies to characterize the attributes and limitations of this assay in comparison with established cytogenetic techniques (dicentric chromosome scoring and cytokinesis block micronucleus assay). In an attempt to examine the reliability of gene expression or histone phosphorylation for biodosimetry and radiation injury assessment, a NATO exercise was organized by the NATO Research Task Group RTG-033 “Radiation Bioeffects and Countermeasures”. This exercise allowed intercomparison of different assays applied by the same or different institutions in terms of both the time needed to provide dosimetric results and the reliability of dose estimates. From the dosimetry point of view and for long-term epidemiological follow-up it is desirable to estimate doses as accurately as possible, however from the clinical point of view dose ranges often provide sufficient information to address urgent clinical or diagnostic needs. In this study we will investigate the ability of gene expression measurements to discriminate binary dose categories representing clinically relevant treatment groups of various radiation exposed individuals. Gene expression analyses were carried out with human peripheral blood from one donor that was irradiated for calibration purposes with doses of 0.25–4 Gy and for test purposes with doses of 0.1–6.4 Gy. The goal of the study is a comparison of each laboratory’s ability to perform dose assessment using gene expression assays employing qRT-PCR (quantitative reverse transcription polymerase chain reaction) and CLPA (chemical ligation dependent probe amplification) methodologies. For this analysis we focused on the amount of times to report dose estimates and the accuracy of dose estimates relative to the true dose for each laboratory. We also merged doses into binary categories of clinical or diagnostic relevance and examined accuracy, sensitivity and specificity.
MATERIALS AND METHODS
Procedures Common for All Assays
Blood samples of 2–3 ml whole blood from one healthy male individual were collected in heparinized tubes and irradiated with X rays. The samples of calibration and test samples where then distributed to participating laboratories along with data collection sheets, which requested information and statistical analysis from our participants such as: MAD calculations, impact of questionnaire information on MAD and binary categories of clinical significance. To assess the quality of binary dose assignments, the factors for sensitivity, specificity and accuracy were used. Comparison between groups of participants was done descriptively with help of these factors. A detailed description of the inter-assay comparison is the lead article in the series of companion articles (NATO Biodosimetry Study, Radiat. Res. 2013; 180:000-00).
Gene Expression Assays
For the gene expression assays, we incubated the irradiated blood samples for 24 h at 37°C using whole blood and an equal volume of Roswell Park Memorial Institute (RPMI) 1640 medium containing 10% FCS (13). For qRT-PCR, cells were lysed in RLT buffer (QIAamp RNA Blood Mini Kit, Qiagen), stored at −20°C and shipped on ice. For Chemical Ligation Dependent Probe Amplification (CPLA) analysis, 2 ml aliquots of whole blood diluted in RPMI were incubated in 2 ml CLPA reaction buffer (DxTerity), mixed and shipped at room temperature. Assays were performed at the laboratories according to their established protocols. Quantitative RT-PCR was performed by most participants using either TaqMan or SYBRGreen chemistry and a different set of genes (Table 1). Details of RNA isolation, cDNA synthesis and PCR parameters used by each laboratory are shown in Table 2.
TABLE 1.
General Characteristics of Technical Procedures and Experiences for the Contributing Institutions are Shown
| Institution | Chemistry | No. genes | Gene names | Calibration and blinded test samples processed | No. previous exercises | Laboratory specialized in biodosimetry | Method established (month) | Method established for biodosimetry purposes (month) | NATO samples processed with | Time required for reported dose estimates (days) |
|---|---|---|---|---|---|---|---|---|---|---|
| 1 | SybrGreen | 4 | cdkn1a, gadd45, ddb2, bax | separately | 0 | yes | 144 | 6 | priority | 1.3 |
| 2 | TaqMan | 1 | FDXR | separately | 0 | no | 120 | 2 | priority | 9.0 |
| 3 | TaqMan | 2 | GADD45A, CDKN1A | separately | 0 | no | 72 | 1 | when appropriate | 16.0 |
| SybrGreen | nd | nd | nd | |||||||
| 4 | TaqMan | 1 | FDXR | separately | 0 | yes | 60 | 36 | priority | 1.2 |
| TaqMan | 1 | FDXR | together | |||||||
| 5 | TaqMan | 2 | DDB2, GADD45A | together | 1 | yes | 120 | 3 | priority | 0.8 |
| 6 | TaqMan | 1 | FDXR | together | 0 | yes | 24 | 12 | priority | 0.3 |
| 7 | CLPA | 5 | nd | separately | 0 | yes | 36 | 18 | priority | 0.3 |
| 8 | CLPA | 3 | TNFSF9, PCNA, BAX | separately | 0 | yes | 60 | 60 | when appropriate | 9.0 |
TABLE 2.
Methods Used by Contributing Laboratories
| Labor atory | RNA isolation
|
cDNA Synthesis
|
RT-QPCR
|
||||||||||||
|---|---|---|---|---|---|---|---|---|---|---|---|---|---|---|---|
| Isolation kit | DNA digestion during Isolation | Template eluted in | QC Agilent-RIN// concentration// A260/280//A260/230// check DNA contamination | Kit/MasterMix | PCR protocol | QC | Kit | Assays | Cycles | Platform | Threshold | Normalization | Quantification method | QC standard curve//slope//r2//18SrRNA-CT | |
| 1 | QIAamp RNA Blood Mini Kit | no | RNAse-free water | yes//no, Nano-Drop//yes// yes// adapted primer designs (intron flanking) | Reverse Transcriptase Core kit (Eurogentec) | Oligo dT priming | 5′ -3′ assay | LC Fast Start DNA Master SYBR Green kit ® (Roche Applied Science) | GADD45A BAX DDB2 CDKN1A |
adapted for each gene | LightCycler (Roche Applied Science) | automated | Human alu SX repeated elements | ΔΔ CT approach | yes// yes// yes// no: 5′ -3′ assay |
| 2 | Ambion Total RNA Extraction kit | Turbo DNAse | Elution Buffer | Qubit used for RNA concentration | High Capacity RNA-to-cDNA kit, AB | 1×/37°C/60 min, 1×/95°C/5 min | endogenous control -CT | TaqMan Universal Master Mix II, AB | Hs00169255_m1, GADDA45A Hs00171112_m1, CCNG1 Hs00172068_m1,DDB2 Hs00179935_m1, FHL2 Hs00180269_m1, BAX Hs00231069_m1, ATF3 Hs00234753_m1, MDM2 Hs00244586_m1, FDXR Hs00355782_m1, CDKN1A Hs00366278_m1, TNFRSF10B Hs00427214_g1, PCNA Hs00902787_m1, SESN1 Hs03645225_m1, PHPT1 |
1×/50°C/2 min 1×/ 95 °C/10 min 40×/ 95 °C/1 min 60°C/1 min | ViiA7 AB | automated | 18S rRNA | Δ Δ CT approach | yes// yes// yes// yes |
| 3 | QIAamp RNA Blood Mini Kit | RNase-free DNase-Set (Qiagen) | RNAse-free water | yes/yes; Nano-Drop | QuantiTect Reverse Transcription Kit (QIAGEN) with integrated DNA removal | 1. 2 min, 42°C (gDNA removal) 2. 15 min, 42°C (RT) 3. 3 min, 95°C (RT inactivation priming with optimized mix of oligo(dT) and random oligomers |
5′ –3′ assay | Rotor-Gene SYBR Green PCR Kit (QIAGEN) Rotor-Gene Probe PCR Kit (QIAGEN) |
SYBR Green Assays (Qiagen): Hs_GADD45A_1_SG Hs_BAX_3_SG Hs_DDB2_1_SG Hs_CDKN1A_1_SG TaqMan Probe Assays (Qiagen): Hs_GADD45A_1_QF Hs_BAX_2_QF Hs_DDB2_1_QF Hs_CDKN1A_1_QF Hs_RN18S1_2_QF |
SYBR Green: 1 × 5 min 95°C 40 × 5 s 95°C/10 s 60°C TaqMan Probes: 1 × 3 min 95°C 40 × 3 s 95°C/10 s 60°C |
Rotor-Gene Q (QIAGEN) | variable | 18S rRNA | REST software with efficiency correction | yes// yes// yes// no |
| 4 | QIAamp RNA Blood Mini Kit | RNase-free DNase-Set (Qiagen) | RNAse-free water | yes//yes, Nano-Drop//yes// yes// convent. PCR with β-actin primer and HotStar MasterMix (Qiagen), 30 cycles | High capacity cDNA archive kit, AB | 1×/25°C/10 min, 1×/37°C/ 120min | 18SrRNA-CT | TaqMan Universal Master Mix, AB | GADD45A, Hs00169255_m1 BAX, Hs00180269_m1 DDB2, Hs00172068_m1 CDKN1A, Hs00355782_m1 |
1×/50°C/2 min 1×/ 95 °C/10 min 40×/ 95 °C/1 min 60°C/1 min | GeneAmp 7900 AB | automated | 18S rRNA | ΔΔ CT approach | yes// yes// yes// yes |
| 5 | QIAamp RNA Blood Mini Kit | RNase-free DNase-Set (Qiagen) | RNAse-free water | No// yes//yes PCR Real-Time with adapted primers (single copy costitutive gene) | High capacity cDNA archive kit, AB | 1×/25°C/10 min, 1×/37°C/ 120min | 18SrRNA-CT | TaqMan Universal Master Mix, AB | GADD45A, BAX, DDB2, CDKN1A | 1×/50°C/2 min 1×/ 95 °C/10 min 40×/ 95 °C/1 min 60°C/1 min | StepOnePlus ABI | automated | 18S rRNA | ΔΔ XT approach | yes// yes// yes// yes |
| 6 | QIAamp RNA Blood Mini Kit | RNase-free DNase-Set (Qiagen) | TE or RNAse- Free water | No, agarose gel//yes Nano- Drop//yes// Yes//-RT control | High capacity cDNA archive kit, AB | 1×/25°C/10 min, 1×/37°C/120 min 1×/85°C/5 min | HPRT1-CT | TaqMan,PerfeCTa® MultiPlex qPCR SuperMix, Quanta bioscience | PCNA, PHPT1, TIGAR, CCNG1, DDB2, FDXR, GADD45A, MDM2 | 1×/95°C/2 min 40× /95°C/10 s 60°C/1 min | Rotor-Gene 6000 Qiagen | fixed | HPRT1 | 2 Standard curves relative quantification | yes//yes// yes// HPRT1, (-)RT and NTC |
| 7 | no RNA Isolation- direct from stabilized blood testing with NEAT-CLPA assay | no | no | no | no cDNA synthesis | NA | NA | Finnzymes QPCR F-450 | 30-plex assay, which includes markers for PCNA, DDB2, BAX, FDXR, GADD45A and several other proprietary markers. | 1×/95°C/10 min 28×/ 95 °C/60°C/72°C (10 s each step) | Capillary Electrophoresis on an ABI3500 | proprietary | peak height relative to internal standard | NA | |
| 8 | QIAamp RNA Blood Mini Kit | RNase-free DNase-Set (Qiagen) | RNAse-free water | Nanodrop concentration- A260/280. Bioanalyzer Agilent RIN | no cDNA synthesis | NA | NA | CLPA assay Dxterity | 19-plex assay which includes markers for DDB2-3, BAX2-3, PCNA-3, BBC3-1 | 1×/94°C/10 min 28×/ 95 °C 10 s/60°C 20 s/ 72 °C 20 s | Capillary Electrophoresis on an ABI3130 | GAPDH-4 | peak height relative to internal standard | NA | |
Note. NA = not applicable, AB = Applied Biosystems (Life Technologies) and QC = quality control.
Alternatively, CLPA a modification of NEAT, was performed by two laboratories (Tables 1 and 2). By employing the so-called Non-Enzymatic Amplification Technology (NEAT, DxTerity), two probes are designed to hybridize to adjacent regions of a target nucleic acid. One probe contains a chemically reactive nucleophilic group, while the other is modified with an electrophilic leaving group. The probes are designed so that upon hybridization to the target sequence the nucleophile is brought into proximity with the leaving group, and a chemical reaction takes place resulting in ligation of the two probes. The ligation reaction can be performed under extreme conditions, such as in crude tissue extracts and the chemical ligation reaction works well on RNA targets, eliminating the need for reverse transcriptase production of cDNA. These properties eliminated the need for purification of target RNA in two laboratories.
The CLPA assay itself is performed in 4 steps: (1) The ligation reaction (S-probes, L-probes and sample are prepared and incubated at 55°C for 0.5–1 h after an initial denaturation step); (2) streptavidin-coated magnetic beads are added to the completed ligation reaction, and the product is isolated by magnetic capture and washing; (3) Amplification is then performed using PCR and a single “universal” primer pair which is added directly to the magnetic beads, with one of the primers is labeled to allow detection of the final product by capillary electrophoresis); and (4) The readout is then done by capillary electrophoresis.
RESULTS
Initially nine institutions intended to participate in this NATO exercise, but because of organizational reason one of them withdrew from the exercise prior to the delivery of the blood samples. Of the remaining eight institutions (Table 1) one using SYBRGreen® experienced technical difficulties with the blinded test samples provided and could not report dose estimates. Another institution intended to perform both the very specific and more costly fluorogenic probe-based TaqMan® chemistry and the less expensive double-stranded DNA binding dye SYBRGreen® chemistry, but for technical reasons only the fluorogenic probe-based results were delivered. Furthermore, two dose estimates from one laboratory (blood samples irradiated with 2.6 and 3.0 Gy) were missing. Finally, one institution performed gene expression assays of calibration and blinded test samples combined and separately; thus, seven institutions provided eight analyses, so that 78 dose estimates were analyzed (Table 3).
TABLE 3.
MAD with and without the Sample Irradiated with 6.4 Gy was Calculated and Laboratory Contributions are Presented in Ascending Order of MAD Values (with 6.4 Gy Sample)
| Laboratory | True dose for each sample (Gy)
|
MAD (Gy)
|
MAD (SEM)
|
No. measurements out of ±0.5 Gy | |||||||||||
|---|---|---|---|---|---|---|---|---|---|---|---|---|---|---|---|
| 0 | 0.1 | 0.7 | 1.4 | 2 | 2.2 | 2.6 | 3 | 4.2 | 6.4 | With 6.4 Gy | Without 6.4 Gy | With 6.4 Gy | Without 6.4 Gy | ||
| Reported dose estimates for each sample (Gy) | |||||||||||||||
| 7 | 0.1 | 0.2 | 1.1 | 1.9 | 2.4 | 2.5 | 3.0 | 3.2 | 4.1 | 5.4 | 0.3 | 0.3 | 0.1 | 0.1 | 1 |
| 4 | 0.0 | 0.1 | 0.7 | 1.2 | 2.4 | 2.3 | 3.4 | 4.0 | 4.8 | 4.4 | 0.5 | 0.4 | 0.2 | 0.1 | 4 |
| 4 | 0.0 | 0.0 | 0.5 | 1.2 | 1.6 | 1.9 | 2.1 | 1.8 | 3.2 | 5.0 | 0.5 | 0.4 | 0.2 | 0.1 | 3 |
| 6 | 0.0 | −0.0 | 0.8 | 1.7 | 3.6 | 3.1 | 3.1 | 4.0 | 3.8 | 6.0 | 0.5 | 0.6 | 0.2 | 0.2 | 3 |
| 5 | 0.0 | 0.1 | 2.4 | 1.5 | 2.8 | 2.8 | 3.2 | 3.4 | 3.6 | 3.6 | 0.8 | 0.5 | 0.3 | 0.2 | 7 |
| 8 | 0.0 | 0.3 | 1.0 | 4.0 | 3.0 | 2.0 | 3.0 | 4.0 | 1.0 | 0.8 | 0.3 | 0.3 | 4 | ||
| 2 | 0.1 | 0.3 | 1 | 2 | 0.5 | 1.0 | 2.0 | 4.0 | 3.0 | 3.0 | 1.0 | 0.7 | 0.3 | 0.2 | 6 |
| 3 | 0.2 | 0.8 | 2.4 | 0.8 | 4.1 | 0.6 | 1.7 | 1.2 | 4.1 | 2.6 | 1.3 | 1.1 | 0.3 | 0.2 | 8 |
| MAD (Gy) | 0.0 | 0.2 | 0.6 | 0.6 | 1.0 | 0.7 | 0.6 | 0.9 | 0.6 | 2.1 | |||||
| MAD (SEM) | 0.0 | 0.1 | 0.2 | 0.3 | 0.2 | 0.2 | 0.1 | 0.2 | 0.2 | 0.4 | |||||
| No. measurements out of ± 0.5 Gy | 0 | 1 | 2 | 3 | 5 | 5 | 4 | 5 | 5 | 7 | |||||
| minimum | 0.3 | 0.3 | |||||||||||||
| maximum | 1.3 | 1.1 | |||||||||||||
| mean of mean | 0.8 | 0.6 | |||||||||||||
| median | 0.7 | 0.5 | |||||||||||||
| fold-changea | 3.9 | 4.0 | |||||||||||||
Notes. Dose estimates not falling into the ± 0.5 Gy uncertainty interval accepted for triage dosimetry are italicized. Bolded data depict measures of descriptive MAD statistics.
Fold-change refers to the ratio of calculated MAD maximum and minimum values.
All participants answered the questionnaire requesting additional information concerning laboratory organization and assay performance (Table 1). The transport temperature logs detected changing temperatures in each box typically ranging from 10–18°C when using ice and up to 20°C when sending samples at room temperature (CLPA assay) during the shipment of the calibration samples sent in July. For the blinded test samples (sent in September), temperature logs detected temperatures ranging from 2–10°C. Film badges provided no indication of undesired additional radiation exposure to the samples during the transport. After the arrival of blood samples at the participating laboratories, the earliest assessment of dose was reported in 7–17 h when running the CLPA assay and in 7–48 h when running qRT-PCR. The overall report time ranged between 0.3 and 16 days. The quality checks of the different laboratories indicated a successful isolation and high quality RNAs from lysed cells delivered in RLT buffer (RNA integrity numbers between 7.5 and 9.8) and a successful cDNA synthesis/qRT-PCR in all but one laboratory. RNA quality was not reported by two institutions.
We examined the accuracy of qRT-PCR gene expression measurements performed in triplicate from those laboratories where raw data were available. We found the standard deviation of cycle threshold (CT)-values to be below 0.1 (7%) in 50% of measurements and below 0.15 CT-values (<11%) in 75% of measurements and therefor comparable for each laboratory and gene target examined (Fig. 1). Standard deviations relative to the mean (coefficient of variation, CV) of CLPA assay measurements ranged between 6.4–11.1%.
FIG. 1.
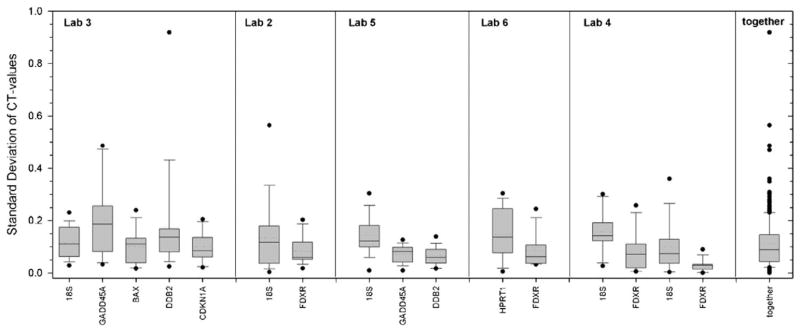
The box plots reflect standard deviations of cycle threshold (CT)-values from triplicate qRT-PCR measurements for each gene (x-axis labels) performed in 5 different laboratories. Dotted horizontal line in the box plot refers to the mean and the solid horizontal line to the median. Last column summarizes the distribution of all 272 measurements.
Calibration curves, from laboratories where raw data were available, showed a large variation regarding the CT-values for each laboratory. Spearman coefficients typically exceeded 95% for all curves except for one CLPA assay (Fig. 2). Either the linear-quadratic equation or the calibration curves itself were used to calculate or extrapolate by hand the corresponding reported dose estimates from the blinded test samples gene expression values. Comparison of reported dose estimates versus the true doses showed an increasing variation of dose estimates with rising true dose (Fig. 3). An upper limit in dose estimates seemed to occur at 6.4 Gy, since true doses were underestimated by all assays performed (Fig. 3). This becomes apparent when comparing the MAD of 2.1 Gy with samples irradiated with 6.4 Gy. For example, we found 2–10-fold lower MAD values for doses between 0.2–0.9 Gy compared to samples irradiated with up to 4.2 Gy (Table 3). Likewise, the number of measurements lying outside the recommended 0.5 Gy interval for triage dosimetry increased with the size of the absorbed dose per sample.
FIG. 2.

Calibration curves from laboratories (labs 2–6) running either qRT-PCR (y-axis) or CLPA assay (lab 8, y-axis) are shown. Data points are fitted by a regression line of second order (labs 2–6) or connected with a spline curve (lab 8). Details are provided in parenthesis. Symbols represent mean values of triplicate measurements. Error bars represent the standard deviation and are visible when greater than the symbols. Calibration data for laboratories 1 and 7 were not reported. Either the equation or the calibration curves itself were used to calculate or extrapolate by hand corresponding dose estimates from the blinded test samples gene expression values. All laboratories ultimately only used one gene for their calibration curves as shown in Fig. 2, but one laboratory did use 4 genes (data not shown). “RD” = radiation dose (Gy).
FIG. 3.

Dose estimates reported from participants with higher (white circles) or lower MAD (dark gray circles) are shown for each of the 10 blinded test samples.
MAD values per laboratory showed a fourfold difference in accuracy irrespective of whether the 6.4 Gy sample was included or not (Table 3). Based on these measurements we divided laboratory radiation dose estimates into two groups characterized by low-MAD values (0.3–0.5 Gy) and high-MAD values ranging between 0.8–1.3 Gy, respectively. The number of measurements lying outside the recommended 0.5 Gy interval was almost threefold higher for the former (4–8 false measurements, mean =6.3) compared to the latter (1–4 false measurements, mean = 2.3).
To elucidate the reason for discrepancy of MAD measurements, and the false measurements we examined the fold-differences in gene expression for each laboratory and each gene separately, for the calibration samples in comparison to the blinded test samples (Table 4). MAD values were significantly correlated to fold-differences of the housekeeping gene (18S rRNA, MRPS5 or HPRT1, Spearman’s rank correlation test, P = 0.0008). The laboratories with the highest MAD values in Table 3 also reported considerable differences between calibration and blinded test samples in the fold-differences in gene expression for the housekeeping gene (18S ribosomal RNA, MRPS5) (e.g., laboratory 3: 2.1 vs. 9.3, Table 4, first entry). Even higher fold-differences were found for gene assays employed for construction of dose response-relationships. In the case of laboratory 8, the fold-differences of the housekeeping gene exceeded the variance of the gene employed for dose reconstruction. For the other laboratories, fold-differences were more consistent between calibration and blinded test samples for each gene. In line with expected smaller MAD values for these laboratories, we calculated smaller fold-differences for the housekeeping gene in comparison to the genes used for dose reconstruction. This analysis indicates that a lack in reproducibility of gene expression performance may contribute to the high-MAD values.
TABLE 4.
Comparison on the Reproducibility of Laboratories Contributions when Processing Calibration and Blinded Test Samples
| Dose (Gy) | Laboratory 3
|
Laboratory 8
|
Laboratory 2
|
Laboratory 5
|
DDB2 | Laboratory 6
|
Laboratory 4 (separately)
|
Laboratory 4 (combined)
|
||||||||||
|---|---|---|---|---|---|---|---|---|---|---|---|---|---|---|---|---|---|---|
| 18S | GADD45A | BAX | DDB2 | CDNK1A | MRPS5 | Bax1 | 18S | FDXR | 18S | GADD45 | HPRT1 | FDXR | 18S | FDXR | 18S | FDXR | ||
| Calibration samples | ||||||||||||||||||
| 0.00 | 12.8 | 30.3 | 24.9 | 27.4 | 24.9 | 400.8 | 566.3 | 12.3 | 31.9 | 19.5 | 26.7 | 25.7 | 25.1 | 25.8 | 18.6 | 27.2 | 21.3 | 30.8 |
| 0.25 | 12.2 | 29.5 | 23.3 | 26.2 | 23.9 | 405.2 | 956.2 | 12.3 | 30.3 | 19.2 | 25.9 | 24.4 | 24.8 | 24.5 | 18.4 | 25.8 | 20.8 | 29.2 |
| 0.50 | 12.2 | 29.1 | 22.8 | 25.5 | 23.4 | 351.7 | 1043.0 | 13.8 | 30.2 | 19.2 | 25.4 | 23.9 | 25.0 | 23.7 | 18.4 | 24.9 | 20.5 | 28.4 |
| 1.00 | 11.8 | 28.7 | 22.2 | 25.0 | 22.8 | 217.0 | 677.2 | 12.6 | 29.3 | 19.8 | 25.4 | 23.8 | 25.3 | 23.2 | 18.4 | 24.5 | 20.6 | 27.8 |
| 2.00 | 12.0 | 27.9 | 22.0 | 24.2 | 22.4 | 288.7 | 961.0 | 13.3 | 28.4 | 19.7 | 25.0 | 23.5 | 25.3 | 22.6 | 18.5 | 23.9 | 20.7 | 27.3 |
| 3.00 | 11.7 | 27.3 | 21.8 | 23.8 | 21.8 | 189.3 | 697.5 | 13.0 | 28.4 | 19.4 | 24.2 | 23.0 | 25.8 | 22.7 | 18.3 | 23.6 | 20.9 | 27.0 |
| 4.00 | 12.0 | 27.4 | 21.8 | 23.8 | 21.9 | 225.7 | 979.0 | 13.3 | 27.9 | 19.4 | 23.5 | 22.7 | 25.7 | 22.5 | 18.5 | 23.5 | 20.8 | 26.9 |
| minimum | 11.7 | 27.3 | 21.8 | 23.8 | 21.8 | 189.3 | 566.3 | 12.3 | 27.9 | 19.2 | 23.5 | 22.7 | 24.8 | 22.5 | 18.3 | 23.5 | 20.5 | 26.9 |
| maximum | 12.8 | 30.3 | 24.9 | 27.4 | 24.9 | 405.2 | 1043.0 | 13.8 | 31.9 | 19.8 | 26.7 | 25.7 | 25.8 | 25.8 | 18.6 | 27.2 | 21.3 | 30.8 |
| difference | 1.1 | 3.1 | 3.1 | 3.6 | 3.1 | 1.6 | 4.0 | 0.6 | 3.2 | 3.0 | 0.9 | 3.3 | 0.3 | 3.7 | 0.8 | 3.9 | ||
| fold-difference | 2.1 | 8.3 | 8.6 | 12.4 | 8.4 | 2.1 | 1.8 | 2.9 | 15.6 | 1.5 | 9.4 | 7.9 | 1.9 | 10.2 | 1.3 | 13.3 | 1.7 | 15.2 |
| Blind samples | ||||||||||||||||||
| 0 | 12.9 | 30.7 | 24.1 | 28.9 | 25.3 | 372.0 | 342.0 | 12.9 | 31.5 | 19.7 | 26.3 | 25.4 | 26.1 | 26.4 | 18.4 | 27.5 | 20.6 | 31.0 |
| 3 | 12.1 | 28.3 | 22.3 | 25.0 | 23.2 | 318.0 | 12.9 | 27.3 | 19.3 | 23.7 | 22.6 | 25.9 | 22.6 | 18.8 | 23.8 | 20.9 | 27.6 | |
| 2.2 | 12.4 | 29.0 | 23.4 | 26.5 | 24.0 | 249.0 | 891.3 | 11.4 | 27.4 | 19.4 | 24.2 | 22.8 | 26.0 | 23.0 | 18.6 | 24.0 | 21.1 | 27.7 |
| 2 | 13.0 | 28.2 | 21.9 | 25.2 | 23.0 | 249.3 | 963.3 | 13.3 | 29.3 | 19.0 | 23.8 | 22.8 | 26.7 | 23.5 | 18.5 | 23.9 | 20.9 | 27.7 |
| 0.1 | 15.0 | 34.2 | 26.9 | 31.1 | 27.6 | 314.0 | 390.0 | 12.1 | 30.1 | 19.2 | 25.6 | 24.7 | 25.9 | 25.6 | 18.1 | 26.4 | 20.5 | 30.1 |
| 1.4 | 11.8 | 28.3 | 22.0 | 24.8 | 23.0 | 109.5 | 539.0 | 11.5 | 26.9 | 19.2 | 24.7 | 23.1 | 26.8 | 24.4 | 18.0 | 24.0 | 20.8 | 27.9 |
| 0.7 | 13.5 | 29.7 | 22.9 | 26.4 | 23.7 | 263.7 | 833.7 | 12.8 | 29.4 | 19.6 | 24.6 | 23.3 | 26.1 | 24.4 | 18.5 | 24.9 | 20.9 | 28.7 |
| 4.2 | 12.6 | 27.9 | 21.9 | 25.1 | 22.4 | 56.3 | 240.0 | 12.7 | 27.8 | 18.8 | 23.1 | 22.2 | 26.5 | 23.2 | 18.8 | 23.6 | 21.0 | 27.2 |
| 2.6 | 12.4 | 28.6 | 22.2 | 25.6 | 23.0 | 12.6 | 28.2 | 19.0 | 23.5 | 22.7 | 26.5 | 23.4 | 18.7 | 23.8 | 20.9 | 27.4 | ||
| minimum | 11.8 | 27.9 | 21.9 | 24.8 | 22.4 | 56.3 | 240.0 | 11.4 | 26.9 | 18.8 | 23.1 | 22.2 | 25.9 | 22.6 | 18.0 | 23.6 | 20.5 | 27.2 |
| maximum | 15.0 | 34.2 | 26.9 | 31.1 | 27.6 | 372.0 | 963.3 | 13.3 | 31.5 | 19.7 | 26.3 | 25.4 | 26.8 | 26.4 | 18.8 | 27.5 | 21.1 | 31.0 |
| difference | 3.2 | 6.3 | 5.0 | 6.3 | 5.2 | 1.8 | 4.7 | 0.9 | 3.2 | 3.1 | 0.9 | 3.8 | 0.8 | 3.8 | 0.6 | 3.8 | ||
| fold-difference | 9.3 | 78.2 | 32.7 | 77.9 | 36.8 | 6.6 | 4.0 | 3.6 | 25.8 | 1.9 | 8.9 | 8.8 | 1.9 | 14.2 | 1.7 | 14.4 | 1.5 | 14.0 |
Notes. Fold-differences in gene expression per laboratory and gene for calibration and blinded test samples is calculated as the difference of maximum-minimum values (difference) taken to the power of 2 for qRT-PCR measurements (except laboratory 8). The blinded test sample irradiated with 6.4 Gy was left out for better comparison of calibration and blinded test samples.
We also examined the impact of answers from our questionnaire on the MAD values. A significant correlation was found with report time of dose estimates (Spearman’s rank correlation test, P = 0.014). Marginal influences (P < 0.10) on the MADs were found and no significant changes were found between both MAD groups employing the Wilcoxon test. Furthermore, other aspects such as methodological differences or number of genes considered for dose estimates did not explain differences of MAD values. To reflect aspects of clinical/diagnostic/epidemiological relevance, we also aggregated gene expression-based dose estimates into binary categories. Specificity (range, 63–88%) was always lower than sensitivity (range, 76–100%) and accuracy (82–100%) and decreased when 2–4 Gy vs. ≥ 4 Gy are compared to as low as 25% sensitivity (Table 5). Accuracy/sensitivity was 93–100% and 76–100% for the group with low or high MAD, respectively.
TABLE 5.
Total Number of Reported Assignments per Dose
| Radiation exposure | Totals | Totals a per dose | True doses (Gy)b
|
Percentage overallc
|
|||||||||||
|---|---|---|---|---|---|---|---|---|---|---|---|---|---|---|---|
| 0 | 0.1 | 0.7 | 1.4 | 2.0 | 2.2 | 2.6 | 3.0 | 4.2 | 6.4 | Accuracy | Sensitivity | Specificity | |||
| Never/ever | |||||||||||||||
| all performer | 78 | 8 | 5 | 6 | 8 | 8 | 8 | 8 | 7 | 7 | 8 | 8 | 93.6 | 97.1 | 62.5 |
| low MAD | 40 | 4 | 3 | 2 | 4 | 4 | 4 | 4 | 4 | 4 | 4 | 4 | 92.5 | 94.4 | 75.0 |
| high MAD | 38 | 4 | 2 | 4 | 4 | 4 | 4 | 4 | 3 | 3 | 4 | 4 | 94.7 | 100.0 | 50.0 |
| <0.1 Gy vs. >0.1 Gy | |||||||||||||||
| all performer | 78 | 8 | 7 | 4 | 8 | 8 | 8 | 8 | 7 | 7 | 8 | 8 | 93.6 | 100.0 | 68.8 |
| low MAD | 40 | 4 | 4 | 3 | 4 | 4 | 4 | 4 | 4 | 4 | 4 | 4 | 97.5 | 100.0 | 87.5 |
| high MAD | 38 | 4 | 3 | 1 | 4 | 4 | 4 | 4 | 3 | 3 | 4 | 4 | 89.5 | 100.0 | 50.0 |
| <1.5 Gy vs. >1.5 Gy | |||||||||||||||
| all performer | 78 | 8 | 8 | 8 | 6 | 3 | 7 | 6 | 7 | 6 | 8 | 8 | 85.9 | 91.3 | 78.1 |
| low MAD | 40 | 4 | 4 | 4 | 4 | 2 | 4 | 4 | 4 | 4 | 4 | 4 | 95.0 | 100.0 | 87.5 |
| high MAD | 38 | 4 | 4 | 4 | 2 | 1 | 3 | 2 | 3 | 2 | 4 | 4 | 76.3 | 81.8 | 68.8 |
| 2–4 Gy vs. >4 Gy | |||||||||||||||
| all performer | 46 | 8 | 7 | 8 | 7 | 4 | 3 | 5 | 73.9 | 50.0 | 86.7 | ||||
| low MAD | 24 | 4 | 4 | 4 | 4 | 2 | 2 | 4 | 83.3 | 75.0 | 87.5 | ||||
| high MAD | 22 | 4 | 3 | 4 | 3 | 2 | 1 | 1 | 63.6 | 25.0 | 85.7 | ||||
Notes. The column “totals” refers to the total number of reported assignments and the column “totals per dose” describes the total number of reported assignments per dose. Numbers of correctly reported assignments (left of the respective critical dose true negatives, right of it true positives) to the groups are shown for each irradiated sample (left part of the table) for all performers and for manual and automated scoring. Columns on the right show the overall agreement (accuracy, sensitivity and specificity).
Seven for 2.6 Gy and 3 Gy;
related to the totals per dose.
Averages from the reported dose estimates, related to totals.
DISCUSSION
Cytogenetic techniques are currently the most established biological dosimetry tools. Although it is accepted that the dicentric chromosome assay is accurate and a very reliable indicator of the absorbed dose of radiation, it is time consuming and labor-intensive. To increase throughput for use in radiation mass casualty incidents, automated detection of dicentrics (14) and the use of assistance networks of cytogenetic dosimetry laboratories (15) have been proposed. However, this approach may still not be sufficient for a rapid triage of a large number of potentially exposed individuals. Recently, studies examining the transcriptional response to radiation exposure in human peripheral blood have shown that quantification of the expression of specific genes in blood can provide a quantitative dose assessment (16–18).
In this NATO exercise, we analyzed results of an inter-and intralaboratory comparison to examine performance in dose assessment using gene expression assays as a diagnostic tool for rapid biodosimetry. The participating laboratories performed the standard assays, routinely used in their laboratories without any modification for the exercise. Although this approach could lead to an increase of variability in the results, it was decided that it was much easier to organize it this way and to evaluate laboratories accuracy and precision using nonharmonized laboratory targets and protocols, in contrast to the well standardized ones, e.g., the dicentric assay. Of the eight participating institutions from Europe and the U.S., five used fluorogenic probe-based (TaqMan®) chemistry, two used the DNA binding dye (SYBRGreen®) chemistry and two used the CLPA assay. Laboratories using SYBRGreen® were unable to report results. This finding may help facilitate future decisions which gene expression chemistries and assays should be employed for biodosimetry purposes. It should also be noted that the expression levels of different genes were monitored by the participating laboratories. The following genes were used for qRT-PCR: BAX1, CDKN1A, DDB2, FDXR and GADD45A with either 18S, MRPS5 or HPRT1 as control genes; three laboratories favored the use of FDXR. All are up-regulated genes at the transcriptional level in blood and were previously identified as radiation responsive, for a review see ref. (17).
In our exercise, the time of exposure was known and the samples were processed after a 24 h incubation period. If the exact time since exposure of an individual was not known, or if samples from the same individual were obtained at different time points, assessing more than one gene may be useful as some genes are “early” radiation responsive genes versus “late” radiation-responsive genes (12, 19).
In a massive casualty situation a rapid triage would be crucial; in this exercise, dose estimates were reported within 7–8 h of sample receipt, for both qRT-PCR and CLPA assays for the fastest responding laboratories. A rapid processing of the samples and assessment of the dose is clearly one of the strengths of the gene expression technique.
A high accuracy of copy number measurements was achieved using either qRT-PCR or CLPA assays. Unfortunately, this accuracy in detection of copy number changes could not always be converted into precise dose estimates. This appeared to a lack of reproducibility in sample processing at different time points by 50% of the laboratories involved in the exercise. When we restricted the analysis to those with higher reproducibility and lower MAD values (Table 3), accuracy of dose estimates (0.3–0.5 Gy) appeared satisfactory and in line within the accepted uncertainty ±0.5 Gy of the actual dose (20) even without using standardized protocols. However, MAD >0.5 Gy for the 4 laboratories were almost exclusively observed at doses of >2 Gy. With other target genes it might be possible to further improve the accuracy of dose estimates using gene expression. When using MAD we must bear in mind that for arbitrary exposure conditions and groups of exposed victims MAD may show other values than presented. Therefore MADs are valid only for the reported specified experimental design of the study and they reflect the overall accuracy of dose estimates per contributing laboratory.
From the dosimetry point of view, it is desired to perform dose estimates as accurately as possible but from the clinical point of view, dose ranges would provide sufficient accuracy to meet urgent clinical or diagnostic needs. For this reason we divided our 10 samples into binary categories as already described. Except for the comparison on 2–4 Gy vs. >4 Gy, we found an overall accuracy and sensitivity of 93–100% for laboratories with low-MAD values. Hence, gene expression assays might be quite useful as an early-phase triage assay and complement clinical signs and symptoms in a coordinated diagnostic strategy for rapid and accurate radiation dose assessment.
Exposure to IR leads to complex cellular responses that include changes in gene expression and these gene expression responses can differ between individuals. In this exercise the analysis was limited by the number of measurements, and blood from a single donor was used for both the calibration samples and the blinded test samples to focus on methodological variance and exclude interindividual variance. However, in future studies it will be critical to evaluate interindividual differences in response, to assess how these differences could affect the dose estimates obtained by gene expression across a dose range relevant for medical decision making. In actuality, these interindividual differences may also potentially be informative as they may reflect the extent of individual injury and individual radiation sensitivity, thus providing information on long-term effects and future risk.
In our study we intentionally did not simulate partial body exposure or chronic protracted exposure because we wanted to focus on methodological aspects in this exercise. However, in the event of a nuclear accident, most individuals would be nonuniformly irradiated due to partial shielding and predicting the status of individuals in case of heterogeneous exposure may be more difficult. Interestingly, it has been recently reported that a partial body irradiation, even to a single limb, generates a characteristic gene expression signature of radiation injury (21).
In our study, a 24 h post-exposure time point was chosen for analysis of post-irradiation gene expression. Investigators have shown that genes are long lasting with genes such as CDKN1A and GADD45A are still being up-regulated in blood 48 h after exposure (12, 17). To preserve blood exposed ex vivo for 24 h at 37°C, samples were diluted with an equal volume of medium containing 10% serum to obtain good quality RNA. There is no doubt this treatment could affect the expression of some genes and may not reflect what would happen in vivo where circulating blood cells are in constant contact with other tissues/organs. In addition, the results presented in Fig. 3 show that the expression of the genes studied seemed to reach a plateau phase for the highest dose (6.4 Gy) leading to an underestimation of the dose. This could reflect a true plateau but may also be due to the conditions in which the blood cells were stored. Since our model is somewhat artificial we have to be cautious with extrapolation to in vivo conditions. Nevertheless, expression of radiation responsive genes in our ex vivo irradiated human peripheral white blood cells does appear to be similar to in vivo data (22).
In summary, this study demonstrated that gene expression is a credible assay for radiation exposure assessment and we found several genes suitable for biological dosimetry using peripheral blood. Since gene expression-based dose estimates were able to be reported within hours we demonstrated that this approach could rapidly identify exposed individuals for triage purposes after large-scale radiological incidents. Overall, our data provide evidence that dose estimates as well as assignment to binary dose categories of clinical significance were sufficiently accurate and robust for gene expression to be used for rapid biodosimetry in a triage setting. In addition to the need of systematic in vivo studies, some reproducibility issues remain, and further standardization and quality assurance efforts may help address these issues.
Acknowledgments
We are very thankful for the extremely efficient and thoughtful technical and organizational work performed by Sven Senf, Cornelia Grothe, Paul Zander and Julia Hartmann (venipuncture). This work was supported by the German Ministry of Defense. Financial support for the Health Protection Agency was provided by the National Institute for Health Research Centre for Research in Public Health Protection. The authors alone are responsible for the content and writing of the paper. This report is work commissioned by the National Institute for Health Research. The views expressed in this publication are those of the authors and not necessary those of the NHS, the National Institute for Health Research or the Department of Health.
References
- 1.Chaudhry MA. Biomarkers for human radiation exposure. J Biomed Sci. 2008;15:557–563. doi: 10.1007/s11373-008-9253-z. [DOI] [PubMed] [Google Scholar]
- 2.IAEA. Technical reports Series No. 405. International Atomic Energy Agency; Vienna: 2001. Cytogenetic analysis for radiation dose assessment: a manual. ( http://www-pub.iaea.org/MTCD/publications/.../TRS405_scr.pdf) [Google Scholar]
- 3.Wojcik A, Lloyd D, Romm H, Roy L. Biological dosimetry for triage of casualties in a large-scale radiological emergency: capacity of the EU member states. Radiat Prot Dosimetry. 2010;138:397–401. doi: 10.1093/rpd/ncp279. [DOI] [PubMed] [Google Scholar]
- 4.Willems P, August L, Slabbert J, Romm H, Oestreicher U, Thierens H, et al. Automated micronucleus (MN) scoring for population triage in case of large scale radiation events. Int J Radiat Biol. 2010;86:2–11. doi: 10.3109/09553000903264481. [DOI] [PubMed] [Google Scholar]
- 5.Lindholm C, Stricklin D, Jaworska A, Koivistoinen A, Paile W, Arvidsson E, et al. Premature chromosome condensation (PCC) assay for dose assessment in mass casualty accidents. Radiat Res. 2010;173:71–8. doi: 10.1667/RR1843.1. [DOI] [PubMed] [Google Scholar]
- 6.Garty G, Chen Y, Turner HC, Zhang J, Lyulko OV, Bertucci A, et al. The RABiT: a rapid automated biodosimetry tool for radiological triage. II. Technological developments. Int J Radiat Biol. 2011;87:776–90. doi: 10.3109/09553002.2011.573612. [DOI] [PMC free article] [PubMed] [Google Scholar]
- 7.Ossetrova NI, Blakely WF. Multiple blood-proteins approach for early-response exposure assessment using an in vivo murine radiation model. Int J Radiat Biol. 2009;85:837–50. [PubMed] [Google Scholar]
- 8.Amundson SA, Do KT, Shahab S, Bittner M, Meltzer P, Trent J, et al. Identification of potential mRNA biomarkers in peripheral blood lymphocytes for human exposure to ionizing radiation. Radiat Res. 2000;154:342–6. doi: 10.1667/0033-7587(2000)154[0342:iopmbi]2.0.co;2. [DOI] [PubMed] [Google Scholar]
- 9.Dressman HK, Muramoto GG, Chao NJ, Meadows S, Marshall D, Ginsburg GS, et al. Gene expression signatures that predict radiation exposure in mice and humans. PLoS Medicine. 2007;4:e106. doi: 10.1371/journal.pmed.0040106. [DOI] [PMC free article] [PubMed] [Google Scholar]
- 10.Paul S, Amundson SA. Development of gene expression signatures for practical radiation biodosimetry. Int J Radiat Oncol Biol Phys. 2008;71:1236–1244. doi: 10.1016/j.ijrobp.2008.03.043. [DOI] [PMC free article] [PubMed] [Google Scholar]
- 11.Brengues M, Paap B, Bittner M, Amundson S, Seligmann B, Korn R, et al. Biodosimetry on small blood volume using gene expression assay. Health Phys. 2010;98:179–85. doi: 10.1097/01.HP.0000346706.44253.5c. [DOI] [PMC free article] [PubMed] [Google Scholar]
- 12.Kabacik S, Mackay A, Tamber N, Manning G, Finnon P, Paillier F, et al. Gene expression following ionising radiation: identification of biomarkers for dose estimation and prediction of individual response. Int J Radiat Biol. 2011;87:115–29. doi: 10.3109/09553002.2010.519424. [DOI] [PubMed] [Google Scholar]
- 13.Grace MB, McLeland CB, Blakely WF. Real-time quantitative RT-PCR assay of GADD45 gene expression changes as a biomarker for radiation biodosimetry. Int J Radiat Biol. 2002;78:1011–21. doi: 10.1080/09553000210158056. [DOI] [PubMed] [Google Scholar]
- 14.Vaurijoux A, Gruel G, Pouzoulet F, Grégoire E, Martin C, Roch-Lefèvre S, et al. Strategy for population triage based on dicentric analysis. Radiat Res. 2009;171:541–8. doi: 10.1667/RR1664.1. [DOI] [PubMed] [Google Scholar]
- 15.Romm H, Wilkins RC, Coleman CN, Lillis-Hearne PK, Pellmar TC, Livingston GK, et al. Biological dosimetry by the triage dicentric chromosome assay: potential implications for treatment of acute radiation syndrome in radiological mass casualties. Radiat Res. 2011;175:397–404. doi: 10.1667/RR2321.1. [DOI] [PubMed] [Google Scholar]
- 16.Meadows SK, Dressman HK, Muramoto GG, Himburg H, Salter A, Wei Z, et al. Gene expression signatures of radiation response are specific, durable and accurate in mice and humans. PLoS One. 2008;3:e1912. doi: 10.1371/journal.pone.0001912. [DOI] [PMC free article] [PubMed] [Google Scholar]
- 17.Filiano AN, Fathallah-Shaykh HM, Fiveash J, Gage J, Cantor A, Kharbanda S, et al. Gene expression analysis in radiotherapy patients and C57BL/6 mice as a measure of exposure to ionizing radiation. Radiat Res. 2011;176:49–61. doi: 10.1667/RR2419.1. [DOI] [PubMed] [Google Scholar]
- 18.Manning G, Kabacik S, Finnon P, Paillier F, Bouffler Simon, Badie C. Assessing a new gene expression analysis technique for radiation biodosimetry applications. Radiat Meas. 2011:1014–1018. [Google Scholar]
- 19.Manning G, Kabacik S, Finnon P, Bouffler S, Badie C. High and low dose responses of transcriptional biomarkers in ex vivo x-irradiated human blood. Int J Radiat Biol. 2013 Jan 30; doi: 10.3109/09553002.2013.769694. Epub ahead of print. [DOI] [PubMed] [Google Scholar]
- 20.Lloyd DC, Edwards AA, Moquet JE, Guerrero-Carbajal YC. The role of cytogenetics in early triage of radiation casualties. Appl Radiat Isot. 2000;52:1107–12. doi: 10.1016/s0969-8043(00)00054-3. [DOI] [PubMed] [Google Scholar]
- 21.Meadows SK, Dressman HK, Daher P, Himburg H, Russell JL, Doan P, et al. Diagnosis of partial body radiation exposure in mice using peripheral blood gene expression profiles. PLoS One. 2010;5:e11535. doi: 10.1371/journal.pone.0011535. [DOI] [PMC free article] [PubMed] [Google Scholar]
- 22.Amundson SA, Grace MB, McLeland CB, Epperly MW, Yeager A, Zhan Q, et al. Human in vivo radiation-induced biomarkers: gene expression changes in radiotherapy patients. Cancer Res. 2004;64:6368–71. doi: 10.1158/0008-5472.CAN-04-1883. [DOI] [PubMed] [Google Scholar]