
Figure 1. Composite set geneset analysis, stratified by mutation type.
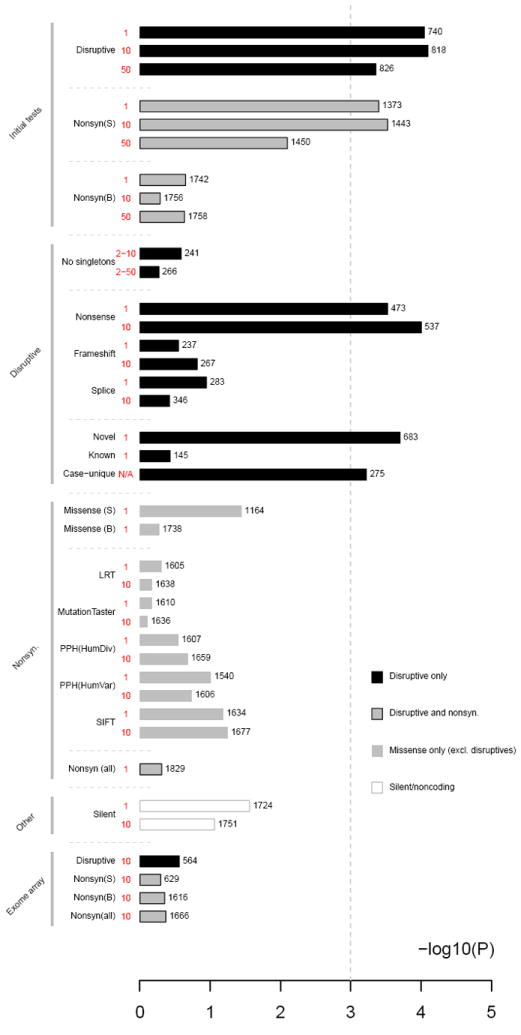
Statistical significance (x-axis) for the composite gene set stratified by type and frequency of mutation and other variables. Numbers to the right of each bar represent the number of genes with at least one mutation in that category for the composite set. (S) represents strictly-defined damaging missenses; (B) broadly-defined group. For the exome array contrasts (in which ExomeChip sites were tested using the exome sequence calls), D represents disruptive mutations, NS all nonsynonymous mutations.