

Abstract
Deletions and duplications of the recurrent ∼600 kb chromosomal BP4–BP5 region of 16p11.2 are associated with a broad variety of neurodevelopmental outcomes including autism spectrum disorder. A clue to the pathogenesis of the copy number variant (CNV)'s effect on the brain is that the deletion is associated with a head size increase, whereas the duplication is associated with a decrease. Here we analyzed brain structure in a clinically ascertained group of human deletion (N = 25) and duplication (N = 17) carriers from the Simons Variation in Individuals Project compared with age-matched controls (N = 29 and 33, respectively). Multiple brain measures showed increased size in deletion carriers and reduced size in duplication carriers. The effects spanned global measures of intracranial volume, brain size, compartmental measures of gray matter and white matter, subcortical structures, and the cerebellum. Quantitatively, the largest effect was on the thalamus, but the collective results suggest a pervasive rather than a selective effect on the brain. Detailed analysis of cortical gray matter revealed that cortical surface area displays a strong dose-dependent effect of CNV (deletion > control > duplication), whereas average cortical thickness is less affected. These results suggest that the CNV may exert its opposing influences through mechanisms that influence early stages of embryonic brain development.
Keywords: 16p11.2, ASD, CNV, copy number variation, morphometry, structural MRI
Introduction
The relationship between genetic variation and phenotypic expression has been difficult to resolve, especially in the context of risk for neuropsychiatric disorders. Part of the complexity arises because variations in large numbers of genes convey risk for the same neuropsychiatric disorders, and because of the rarity of each genetic etiology, limited analyses exist in individuals carrying the same highly penetrant copy number variations (CNVs). For this reason there is need to study large numbers of individuals with the same CNV that conveys risk for neuropsychiatric disorders.
The present study explores the effects of deletion and duplication of the recurrent ∼600 kb BP4–BP5 16p11.2 CNV. The 16p11.2 CNV is associated with a variety of neurodevelopmental outcomes (Bijlsma et al., 2009; Rosenfeld et al., 2010; Shinawi et al., 2010; Jacquemont et al., 2011; Hanson et al., 2014). The 16p11.2 CNV has drawn particular attention because of its association with autism spectrum disorder (ASD). In nonsyndromic, idiopathic ASD this CNV occurs at a frequency of 0.76% (95% CI, 0.51–1.12; Walsh and Bracken, 2011), which ties it as the most common ASD risk variant alongside the maternal 15q11–q13 duplication (Cook and Scherer, 2008; Walsh and Bracken, 2011). Carrying a 16p11.2 deletion increases the odds of developing autism or developmental delay by 38.7-fold (95% CI, 13.4–111.8), whereas there is a 20.7-fold increase with the duplication (95% CI, 6.9–61.7; McCarthy et al., 2009).
However, there is considerable phenotypic variability. Individuals meeting diagnostic criteria for ASD are a minority of 16p11.2 CNV carriers. In addition to associations with language delay (83% require speech therapy), intellectual disability/developmental delay (on average ∼2 SDs lower than controls), and ASD (15% meeting full diagnostic criteria; Zufferey et al., 2012), 16p11.2 is also associated with schizophrenia, bipolar disorder, ADHD, epilepsy, and paroxysmal dyskinesia syndrome (Weiss et al., 2008; McCarthy et al., 2009; Shinawi et al., 2010). These results suggest that the CNV has broad effects on multiple brain systems. Interestingly, mirror phenotypes occur with deletion carriers being associated with macrocephaly and obesity, whereas duplication carriers are associated with microcephaly and low body mass index (Jacquemont et al., 2011; Zufferey et al., 2012). These opposing effects suggest that, for certain phenotypes, there may be a consistent dose-dependent influence of the CNV.
In the present study, brain structure was analyzed in detail for individuals carrying either a deletion or duplication of the 16p11.2 region. Participants were recruited as part of the Simons Variation in Individuals Project (VIP; Simons VIP Consortium, 2012). Portions of the data have been analyzed previously in the context of cognitive and behavioral phenotype (Hanson et al., 2014) and in relation to white-matter microstructure (Owen et al., 2014). Here we focus on morphometric analysis of brain structure. Two questions motivated the analyses. First, are there similar or opposing effects on brain structure between the 16p11.2 deletion and duplication carriers? Second, do observed effects suggest a focal or pervasive influence on the brain?
Materials and Methods
Participants.
Child deletion and adult duplication carriers of 16p11.2 CNV, as well as control subjects, were enrolled from a large cohort of individuals as part of the advanced neuroimaging protocol of the Simons VIP Project (Simons VIP Consortium, 2012). Individuals were recruited in various ways including referral by clinical genetic centers or testing laboratories, web-based networks, or by self-referral of families who learned about Simons VIP (http://SimonsVIPconnect.org). Initial screening and review of medical records occurred at Geisinger and Emory University. Only participants with recurrent breakpoints at BP4–BP5 of 16p11.2 without other pathogenic CNVs or other known genetic diagnoses or syndromes were enrolled. Individuals were excluded if they were not fluent in English, or had a history of environmental insults that could affect neurocognitive status, such as fetal alcohol syndrome, severe birth asphyxia, or severe prematurity.
All participants were enrolled in an initial level of study that took place at three phenotyping core sites: University of Washington Medical Center, Baylor University Medical Center, and Boston Children's Hospital. Assessments included the Autism Diagnostic Observation Schedule (ADOS), Autism Diagnostic Interview (ADI), broad screening measures of social impairment such as the Social Responsiveness Scale (SRS), Vineland-II, and Social Communication Questionnaire (SCQ), as well as general measures of cognitive abilities with the Differential Ability Scale (DAS-II), and Wechsler Individual Achievement Test (WIAT-III) among others. A structural MRI scan was also obtained at the initial assessment but was not matched across sites. Differences in MRI scanners can affect morphometry results. For this reason, the structural MRI data acquired at these sites was not included in our primary analysis.
A subset of these participants 8 years and older, and able to tolerate MRI, were recruited to the second level of study focused on neuroimaging. Data acquisition occurred at two imaging core sites: University of California sites (UC) and Children Hospital of Philadelphia (CHOP). All aspects of the study at UC were performed at UC-San Francisco, except for scanning, which was performed at UC-Berkeley to maintain conformity with the CHOP scanner. Subjects had structural MRI, resting-state functional MRI, task-based functional MRI, diffusion-tensor imaging (DTI) and magnetoencephalography collected on matched scanner platforms.
The structural MRI scans obtained from the UC and CHOP neuroimaging sessions were the primary focus of this study. For a subset of targeted analyses, the structural MRI scans obtained from the initial assessments at the phenotyping core sites were also analyzed.
Control participants for the imaging core sites (UC and CHOP) were recruited locally from the general population matching for age, sex, handedness, and nonverbal IQ. Individuals with any major DSM-IV diagnosis were excluded (based on clinical psychologist review) or if an immediate family member was diagnosed with ASD, other developmental disorders, dysmorphic features, or genetic abnormalities. Control participants were also excluded for a Symptom Checklist 90 (SCL-90) score >62, an axis 1 psychiatric diagnosis on the Diagnostic Interview for Children, a Broader Autism Phenotype Questionnaire aloof subscale score >4/3.5 (male/female), a pragmatics subscale score >3.25/3.5, or a rigidity subscale score >4/3.7. Control subjects also had a chromosome microarray, neurologic exam, a photograph evaluation for dysmorphology, and a clinical psychologist review.
Additional neuropsychiatric assessments were completed during the neuroimaging visits. The battery included the DIAS-II, WIAT-III, Wechsler Abbreviated Scale of Intelligence, Clinical Evaluation of Language Fundamentals (CELF-4), Clinical Test of Phonological Processing, Delis-Kaplan Executive Function System (D-KEFS), Purdue Pegboard, and Ishihara plates. Behavioral testing completed at the phenotyping cores was not repeated on 16p11.2 carriers because this had already been obtained. Carriers completed the CELF and D-KEFS during the neuroimaging visit.
High-quality structural MRI images from the neuroimaging core sites were the primary data analyzed (Table 1). Twenty-five child deletion carriers (13 male and 12 female) and 29 matched child-control subjects (19 male and 10 female) were recruited (ages 8–17). Similarly, 17 adult duplication carriers (10 male and 7 female) along with 33 matched adult-control subjects (19 male and 14 female) were recruited (ages 19–54). Of the 54 children, 33 were imaged at UC and 21 at CHOP. Of the 50 adults, 33 were imaged UC and 17 at CHOP. Insufficient numbers of child duplication and adult deletion carriers were available for analysis.
Table 1.
Demographics and neurocognitive characterization for participants enrolled in the advanced imaging protocol
| Children |
Adults |
|||
|---|---|---|---|---|
| Controls | Deletion carriers | Controls | Duplication carriers | |
| n | 29 | 25 | 33 | 17 |
| Mean age ± SD | 12.8 ± 2 | 11.1 ± 2* | 37.1 ± 9 | 36.1 ± 9 |
| Range | 8–17 | 8–16 | 19–54 | 20–52 |
| Male:female | 19:10 | 13:12 | 19:14 | 10:7 |
| Left:right:ambi | 4:25 | 8:17* | 6:26:1 | 2:15:0 |
| FSIQ | 109 ± 13 | 86 ± 13* | 107 ± 13 | 102 ± 11 |
| NVIQ | 108 ± 11 | 92 ± 13* | 105 ± 11 | 101 ± 13 |
| Range (NVIQ) | 80–136 | 65–130 | 77–125 | 77–119 |
| SRS, ≥60 | 16 ± 12 , 0/29 | 71 ± 41* , 16/25 | 18± 12 , 0/32 | 40 ± 34* , 3/17 |
| Vineland II, ≤85 | 106 ± 9 , 0/28 | 84 ± 13* , 16/25 | 124 ± 80, 1/7 | 87 ± 16* , 8/15 |
| SCQ, ≥15 | 2 ± 2 , 0/28 | 10 ± 8* , 6/25 | — | — |
| ADI | — | 11/19 | — | 1/2 |
| ADOS | — | 7/25 | — | 2/17 |
*Indicates significant differences. Handedness is grouped as left, right, ambidextrous (ambi). FSIQ, Full scale IQ; NVIQ, non-verbal IQ; SRS, Social Responsiveness Scale; SCQ, Social Communication Questionnaire; ADI, Autism Diagnostic Interview; ADOS, Autism Diagnostic Observation Schedule. The ADI and ADOS were not collected on controls. The ADI was not collected on a subset of carriers.
Clinically obtained structural MRI images from the initial phenotyping core sites were analyzed for a specific set of follow-up questions (see Table 5). These secondary data included age-matched child deletion (N = 28) and duplication (N = 16) carriers as well as control siblings who did not carry the 16p11.2 CNV (N = 21). Thus, although the structural sequences were not matched across sites for these secondary data, the data were particularly valuable for testing specific hypotheses that required age-matched deletion and duplication carriers, and also allowed for assessment of the effects in relation to a family based control group.
Table 5.
Demographics and neurocognitive characterization for participants enrolled in the supplemental clinical imaging sample
| Children |
|||
|---|---|---|---|
| Controls | Deletion carriers | Duplication carriers | |
| n | 21 (0) | 28 (14) | 16 (0) |
| Mean age ±SD | 8.1 ± 3 | 9.9 ± 4 | 7.8 ± 5 |
| Range | 1–15 | 1–16 | 1–16 |
| Male:female | 8:13 | 17:11 | 10:6 |
| L:R:ambi:Unk | 1:16:2:2 | 4:17:5:2 | 2:8:1:5 |
| FSIQ | 106 ± 10 | 86 ± 15 | 78 ± 12 |
| NVIQ | 104 ± 9 | 90 ± 14 | 79 ± 16 |
| Range (NVIQ) | 89–120 | 64–130 | 57–114 |
| SRS, ≥60 | 20 ± 20 , 1/20 | 78 ± 40 , 17/25 | 81 ± 39 , 9/12 |
| Vineland II, ≤85 | 103 ± 11 , 1/21 | 78 ± 11 , 23/28 | 78 ± 12 , 12/16 |
| SCQ, ≥15 | 2 ± 2 , 0/20 | 11 ± 9 , 8/25 | 14 ± 7 , 5/11 |
| ADI | 0/1 | 10/20 | 8/11 |
| ADOS | 0/21 | 8/28 | 3/16 |
Abbreviations as described in Table 1. The number in parenthesis denotes how many participants from the main analysis of the neuroimaging protocol overlapped with the clinically acquired MRI scans included in the secondary analysis. The controls and duplication carriers were unique, but half of the deletion carriers overlapped between the two sets of analyses.
Study procedures were approved by the institutional review boards at UC, CHOP, University of Washington Medical Center, Baylor University Medical Center, Boston Children's Hospital, Emory University, Geisinger Medical Center, Columbia University, and Harvard University.
Image acquisition and quality control.
Structural imaging was performed at UC and CHOP on matched 3 tesla TIM Trio MRI scanners (Siemens), one at each site, using the vendor-supplied 32-channel phased-array radio-frequency head coils. Structural data included a high-resolution multiecho T1-weighted magnetization-prepared gradient-echo image (ME-MPRAGE; van der Kouwe et al., 2008) using the following parameters: TR = 2530 ms, TI = 1200 ms, TE = 1.64 ms, FA = 7°, 1 × 1 × 1 mm, and FOV = 256 mm. Other images acquired following the ME-MPRAGE were not analyzed here (e.g., DTI). The images were sent to Harvard University for quality control and analysis. Images with severe wrapping, poor head coverage, ringing/striping/blurring, ghosting, inhomogeneities, or susceptibility artifacts were not used in the analysis (5 participants were discarded for quality).
Structural MRI data analysis.
Structural morphometric analyses targeted total intracranial volume (ICV), whole-brain volume, cortical white and gray matter volumes, cortical surface area and thickness, subcortical structures, and the cerebellum. In this manner, large overall differences in brain organization could be identified as well as local differences that might represent selective differences. The T1-weighted structural (ME-MPRAGE) images were analyzed using FreeSurfer version 4.5.0 software package (http://surfer.nmr.mgh.harvard.edu) using a custom hybrid template consisting of 48 subjects (12 from each group: child control, child deletion, adult control, and adult duplication). A custom template mitigates atlas transformation errors that can occur when the default target atlas has distinct contrast properties from the sample or nonrepresentative anatomy (Buckner et al., 2004). Atlas registration for each individual was to this hybrid template. Images that failed FreeSurfer processing, or had poor quality cortical parcellation and subcortical segmentation were also removed from the analysis (N = 8 participants discarded, in addition to those removed for poor image quality). FreeSurfer applies distinct automated algorithms for surface-based cortical measures and voxel-based subcortical volumes (Dale et al., 1999; Fischl et al., 1999, 2002; Fischl, 2012). Critical to our analyses, cortical gray matter volume could be decomposed to its orthogonal components: surface area and cortical thickness.
For all structural measures, the effects of nuisance variables were removed. Linear regression on nuisance factors was performed using the statistical software SPSS 21. All structural measures were covariance-corrected for age, sex, scanner site, and nonverbal IQ. The β values for each variable were used to compute adjusted measures in the original units using the following formula:
VOLadj = VOLnat − [β1(Agenat − Mean Agenat) + β2(Sexnat − Mean Sexnat) + β3(Sitenat − Mean Sitenat) + β4(NVIQnat − Mean NVIQnat)], where VOLnat is the uncorrected, raw volume measure for any given volume, Agenat is the uncorrected age, Mean Agenat is the group mean, and so on. The final covariance-corrected values, VOLadj, are reported for each measure. Discussion of this normalization approach can be found in Buckner et al. (2004). For analysis purposes, cortical surface area and thickness were normalized in the same manner as the other volumes.
One important feature of the analysis to note is that age regression was performed separately for the children and adults to test the effects of 16p11.2 deletion in the children and duplication in the adults. For this reason, we do not test, and do not interpret, direct contrasts between the child deletion and adult duplication carriers (or the child and adult controls). A sufficient number of child duplication and adult deletion carriers had not undergone the protocols at neuroimaging core sites to directly test for CNV effect within a given age cohort. Two further independent analyses were performed to disentangle effects of age from effects of the CNV including a secondary analysis of the structural data from the initial phenotyping sites.
Distinguishing effects of CNV from effects of age: allometric scaling.
A limitation of the present study is that data from neuroimaging core sites were not available for child duplication or adult deletion carriers. Brain volume is known to decrease with age beginning in young adults with a gradual progression throughout the lifespan (Fotenos et al., 2005; Raz et al., 2005). Given that ASD has in some studies been associated with brain overgrowth early in development followed by variable patterns at later stages (Courchesne et al., 2001, 2003; Redcay and Courchesne, 2005; Schumann et al., 2010), differences between child deletion and adult duplication carriers could be confounded by age in our study. A recent study that examined head circumferences in 7225 individuals from 1891 families, each with one ASD child, showed a small but reproducible effect of ASD diagnosis (Chaste et al., 2013).
To control for the effect of age, an analysis that exploits the allometric relationship between ICV and brain volume in young adults was performed. In young adults, before brain volume loss due to aging, there is an almost perfect allometric relationship between ICV and brain volume: individuals with large brains possess large ICVs and individuals with small brains possess small ICVs (Davis and Wright, 1977, their Fig. 5). Brain volumes move away from the allometric line as individuals age and atrophy shrinks the brain away from the skull covering. Fortuitously, ICV minimally changes with aging (Davis and Wright, 1977; Buckner et al., 2004). It is for this reason that ICV can be used as a regressor to increase sensitivity to the effects of atrophy in studies of advanced aging. Here the stability of ICV provided an anchor to determine whether CNV effects were due to genetic differences or an effect of aging.
Figure 5.

The allometric scaling plot of intracranial volume versus cortical gray matter suggests age is not a confound. The four groups of subjects are plotted in separate colors. Best-fit lines are drawn for the child groups (light green circle and red triangle) and separately for the adult groups (dark green circles and blue squares). The resulting lines are nearly parallel but shifted in their y-intercept. This downward shift in the adults represents the expected cortical gray matter volume loss due to aging. Critically, within each age group, the CNV carriers move along their respective lines. The child-deletion carriers move upward to the right reflecting a brain volume enlargement appropriate for their age group. The adult-duplication carriers move downward to the left reflecting a brain volume loss appropriate for their age group. These results are consistent with opposing volumetric effects of deletion and duplication that are not confounded by age.
For all subjects, ICV was plotted against cortical gray matter volume. The key feature of such a plot is that, within an age group, the gray matter volumes fall along a line directly in relation to ICV. The effect of CNV can be seen as a movement upward or downward along the age-appropriate line. As the results will reveal, the data are well behaved. The effects of deletion and duplication, albeit collected in different age groups, move appropriately along their age-specific lines suggesting the effects are not confounded by age.
Distinguishing effects of CNV from effects of age: clinical site MRI acquisitions.
The primary data analyzed in the present study came from the two neuroimaging core sites using matched scanner hardware and sequences. All the subjects were also imaged on a structural protocol at their initial testing sites on the available scanner at the site (Baylor University Medical Center, Boston Children's Hospital, and University of Washington Medical Center). Analysis of the most informative and robust measures (ICV, brain volume, and gray matter volume) revealed that there was an excellent correlation between the values obtained for the neuroimaging site scans and the original clinical site scans despite platform differences (r = 0.96–0.97). High quality data from a sufficient number of child duplication (N = 16, mean age = 7.8 years, 10 male, mean NVIQ = 79) and child deletion carriers (N = 28, mean age 9.9 years, 17 male, mean NVIQ = 90) were available to conduct an informative analysis. Moreover, a unique family based control group comprised of unaffected siblings was available (N = 21, mean age 8.1 years, 8 male, mean NVIQ = 104). These data were used as another means to test for effects of copy number minimizing the age confound. These data also allowed for generalization of the primary findings to a family based control sample (the deletion carriers overlapped substantially with those enrolled at the neuroimaging core sites, but the duplication carriers and controls were unique; see Table 5). These data were not sufficient to test more subtle regional relations or effects that depend on consistent, high contrast (e.g., cortical thickness).
Results
Cognitive and behavioral phenotypes
Cognitive and behavioral phenotypes of the Simons VIP group of 16p11.2 deletion and duplication carriers described elsewhere (Hanson et al., 2014; Zufferey et al., 2012, a portion of their data). Here we focus on the specific sample that contributed quality-controlled data for the present study. These data represent a subset of the original sample.
Social impairment was common in both the deletion and duplication carriers (Table 1). The SRS and Vineland-II are nonspecific screening measures of social impairment. SRS ≥60 reflects “at risk” individuals, and similarly Vineland-II scores ≤85 reflect a “moderately-low to low” adaptive level. Child deletion carriers (16/25 and 16/25) met screening cutoff for broad social impairment according to SRS and Vineland-II, respectively. Adult duplication carriers (3/17 and 8/15) also met these criteria. No child controls met these cutoffs, whereas one adult control had a Vineland-II score of 79. The SCQ is a screening test for ASD. A score ≥15 is the cutoff for “possible ASD.” Six of 25 child deletion carriers met this screening test for ASD, whereas no child controls did. SCQ was not tested in adults. The ADI and the ADOS are specific tests for ASD. Child deletion carriers (11/19 and 7/25) tested positive on ADI and ADOS, respectively. Of these child deletion carriers, a total of 14/25 were either positive for ADI or ADOS. In adult duplication carriers, 1/2 and 2/17 tested positive for ASD on ADI and ADOS, respectively.
The behavioral testing in Table 1 shows a progression from broad features of social impairment to those specific to ASD. SRS and Vineland-II are the broadest of the set, then SCQ screens for possible ASD, and finally ADI and ADOS are specific to the deficits characteristic of ASD. Furthermore, abnormal tests were most frequent on the broad level of SRS and/or Vineland-II, whereas only a few individuals tested positive for both ADI and ADOS. Consistent with Hanson et al. (2014), our subsample of deletion and duplication carriers shows variability in social impairment.
The study aimed to recruit controls who matched cases in nonverbal IQ (NVIQ). Despite best efforts, there was a 16-point difference between the child groups (t = 5.06, p < 0.001; Table 1). No significant difference was seen in adults. Full scale IQ was not controlled for and showed a similar pattern. A modest positive correlation with IQ and brain volume, and in particular cortical gray matter volume, has been observed in healthy children (Reiss et al., 1996), as well as healthy adults (Andreasen et al., 1993). Additionally, NVIQ differences between autism cases and controls can bias results (Piven et al., 1992). NVIQ was regressed from the results to address this potential confound.
A significant difference in age was found between child deletion carriers and age-matched controls (t = 2.96, p < 0.01), whereas no significant difference was found in adults. The study also aimed to match for handedness; however, an excess of left-handed individuals were recruited in the deletion group (∼1:2 vs ∼1:6 in child controls). Within the deletion group, left- and right-handed individuals did not significantly differ in volume in respect to ipsilateral and contralateral morphometry of cortical gray matter volume, cortical white matter volume, surface area, cortical thickness, or thalamus volume. Right-hemisphere cortical volume was increased in deletion carriers compared with the left-hemisphere cortical volume, but this was also the case for child controls. In contrast, right thalamus volume was smaller than the left in deletion carriers. Handedness did not affect the overall results. There were no significant differences in sex or scanner site between groups. Results were covariance-corrected for the nuisance factors of age, sex, scanner site, and NVIQ.
There is a potential for height to covary with head size. After controlling for age and sex, height was not significantly different between groups (children: t = 1.01, p = 0.32; adults: t = −1.17, p = 0.25). On the other hand, child deletions had significantly higher BMI than controls (t = −2.68, p < 0.01), whereas no significant difference was seen in adults. Higher BMI can be expected based on prior studies (Jacquemont et al., 2011; Zufferey et al., 2012), but the mirrored phenotype BMI phenotype was not seen in adults as was previously reported in the U.S. cohort (Zufferey et al., 2012; t = −0.07, p = 0.94). Height and BMI were not correlated in the sample as a whole (r = −0.01), and mildly correlated within groups (r = 0.17–0.38). Finally, if ICV and whole brain volume are normalized for height, results are not significantly affected.
Clinical diagnoses
All participants were evaluated for DSM-IV diagnoses (Table 2). A clinical diagnosis of ASD was based not only on ADI and ADOS scores, but clinical criteria and overall clinical evaluation. Four of 25 (16.0%) child-deletion carriers met clinical criteria for ASD, and 1/17 (5.9%) in adult duplication carriers. The prevalence in the child cohort was similar to the larger cohort evaluated at the phenotyping core sites from which the participants were recruited (Zufferey et al., 2012). Additionally, only those participants from the phenotyping core sites who could best tolerate imaging were included, which is a selection bias toward higher functioning individuals who can lie still in the scanner. The lower prevalence of ASD in adults compared with children may be due to duplications being less impactful than deletions, or to a selection difference (adults were often identified as carriers after clinical identification of a proband and then subsequent cascade genetic testing in the family such that carrier status in the proband would trigger testing in first degree relatives, then second, etc.). The deletion and duplication carriers were given a broad range of DSM-IV diagnoses (Table 2). Of note, none of the 16p11.2 carriers was given a diagnosis of schizophrenia. Schizophrenia has been associated with decreased brain volume (Crespi and Badcock, 2008), which could have potentially confounded adult duplication data if such diagnoses were present.
Table 2.
Clinical diagnoses
| DSM-IV diagnoses (codes) | Child |
Adult |
|---|---|---|
| DEL, n = 25 (%) | DUP, n = 17 (%) | |
| Phonological Processing Disorder (315.39) | 13 (52) | 0 |
| Developmental Coordination Disorder (315.4) | 8 (32) | 1 (6) |
| Language Disorders (315.31, 315.32, 307.9) | 7 (28) | 0 |
| Enuresis (307.6) | 6 (24) | 0 |
| Autism Spectrum Disorder (299.00, 299.80) | 4 (16) | 1 (6) |
| ADHD Diagnosis (314.00, 314.01, 314.9) | 5 (20) | 3 (18) |
| Intellectual Disability (317, 318, 319) | 5 (20) | 1 (6) |
| Behavior Disorder (312.9, 313.82) | 4 (16) | 0 |
| Learning Disorders (315.0, 315.1, 315.2, 315.9) | 3 (12) | 1 (6) |
| Anxiety & Mood Disorders (300.0, 300.02, 300.4, 300.9) | 3 (12) | 7 (41) |
| Tic Disorder (307.2, 307.22, 307.3) | 3 (12) | 0 |
| Macrocephaly | 6 (24) | 0 |
| Microcephaly | 0 | 4 (23) |
| Mean no. diagnoses per subject | 2.7 ± 2 | 1.0 ± 1 |
Radiographic abnormalities were also noted for deletion and duplication carriers (Table 3). Controls did not show radiologic abnormalities that would exclude them from analysis. Minor findings included occasional white matter hypointensities, small mega cisterna magnas, small arachnoid cysts, ectopic tonsils, empty sella syndromes, and mild cortical atrophy in some older adults.
Table 3.
Radiological abnormalities
| Radiologic abnormalities | Child DEL, n = 25 | Adult DUP, n = 17 |
|---|---|---|
| Cerebellar hemisphere | 8 | 5 |
| Craniocervical junction | 7 | 0 |
| Dens abnormality | 7 | 0 |
| Platybasia | 4 | 0 |
| Corpus callosum | 4 | 2 |
| Hippocampal commissure | 2 | 0 |
| Cortical malformation | 1 | 1 |
| Hippocampus | 1 | 1 |
| Pituitary | 1 | 1 |
| Thalamus | 1 | 0 |
| Anterior commissure | 1 | 0 |
| Optic nerve/chiasm | 1 | 0 |
| White matter volume | 0 | 3 |
| Ventricles | 0 | 2 |
| Cerebellar vermis | 0 | 3 |
| Basal ganglia | 0 | 0 |
| Brainstem | 0 | 0 |
Structural estimates were reliable
Participants were imaged across two sites (UC and CHOP) that were matched for scanner hardware and sequences. Effort was made to align details of imaging including placement of the head within the scanner. Nonetheless, reliability across sites was an open question. For this reason, five individuals not participating in the study were scanned at both sites with data analyzed independently for each acquisition using the same procedures as for the target cohort (mean age = 34.6; 4 male). Mean group differences between sites were marginal for these subjects in terms of ICV (UCmean = 1687 cm3, CHOPmean = 1682 cm3, t = −0.04, p = 0.97), cortical gray matter volume (UCmean = 540 cm3, CHOPmean = 549 cm3, t = 0.49, p = 0.64), surface area (UCmean = 189 cm2, CHOPmean = 191 cm2, t = −0.22, p = 0.83), and average cortical thickness (UCmean = 2.53 mm, CHOPmean = 2.56 mm, t = −1.52, p = 0.29). Although correlation is not properly estimated with such a small sample size, the intraclass correlation (ICC) was calculated: intracranial volume ICC = 0.97, cortical gray matter volume ICC = 0.93, surface area ICC = 0.99, and cortical thickness ICC = 0.85.
Deletion and duplication carriers display opposing effects on global measures of brain volume
Prior studies have shown that deletion carriers have increased head circumference, whereas duplication carriers have decreased head circumference (McCarthy et al., 2009; Shinawi et al., 2010; Jacquemont et al., 2011; Zufferey et al., 2012). Clinicians use head circumference as a rough measure for intracranial volume. Estimated ICV in this study corroborated prior results. ICV was increased for deletion carriers compared with their controls (t = −3.05, p < 0.01), and decreased for duplication carriers compared with their controls (t = 3.78, p < 0.001; Fig. 1A). If the results are also normalized for height the t test value increases slightly in children (t = −3.19, p < 0.01), and adults (t = 4.11, p < 0.001). Whole-brain volume was also revealed to be larger in child deletion carriers compared with controls (t = −3.55, p < 0.001), and smaller in adult duplication carriers compared with controls (t = 5.67, p < 0.001; Fig. 1B). If the results are also normalized for height the t test value increases slightly in children (t = −3.68, p < 0.001), and remain stable for adults (t = 5.53, p < 0.001). Because height has a minimal influence on global measures, subsequent results are only covariance-corrected for age, sex, scanner site, and NVIQ.
Figure 1.

Global measures of ICV and brain volume show opposing effects of 16p11.2 deletion and duplication. 29 child controls, 25 child-deletion carriers, 33 adult controls, and 17 adult duplication carriers are included in this analysis (Table 1). A, Mean adjusted ICV is plotted for the child deletion (DEL) carriers versus their age-matched controls and the adult duplication (DUP) carriers versus their age-matched controls. The values are adjusted via regression for age, sex, scanner site, and NVIQ. Deletion carriers show a significant increase in volume and duplication carriers a significant decrease in volume. Deletion carriers show a +7.5% differences from controls, and duplication carriers show a −6.8% differences from controls. Asterisks indicate significance with a double-asterisk reflecting p < 0.01 and a triple-asterisk representing p < 0.001. Errors bars represent SEM. B, Mean adjusted brain volume is plotted similarly. Brain volume includes cortical gray matter, cortical white matter, subcortical structures, brainstem, and cerebellum without the volume encompassed by ventricles or the subarachnoid space. The pattern for brain volume differences parallels that observed for ICV. Deletion carriers show a +9.7% difference from controls, and duplication carriers show a −9.3% difference from controls.
The CNV effects on brain volume did not appear to be driven by a few individuals who were diagnosed with clinical micro/macrocephaly. Instead it appears that the deletion and duplication broadly shift the distributions of brain volumes consistent with a highly penetrant effect on brain volume observable on the individual participant level before (Fig. 2A) and after correction for nuisance variables (Fig. 2B). This is an important observation as diagnosis of clinical macrocephaly requires an extreme deviation from the group central tendency (head size >2 SDs above the mean) which may not fully capture the effects on all individuals as a brain volume increase or decrease in an individual may still leave him or her within the “normal” range of the brain volume distribution simply because there is considerable normal variation (Moreno-De-Luca et al., 2013).
Figure 2.

Brain volume in individuals. Data illustrate individual participant values for the group data displayed in Figure 1. A, A scatterplot of brain volume is plotted by age before regression of nuisance factors (age, sex, scanner site, and NVIQ). This plot makes transparent the effect of age within and across groups. A decrease in brain volume is seen with age, cross-sectionally across controls. Direct comparison of 16p11.2 carriers across age cannot be made because the cohorts are absent adult deletion and child duplication carriers. B, A scatterplot of adjusted brain volume by age reveals the effects at the level of individual participants. Within each age group-children (<18) and adults (≥18), the effect of age is removed via regression. Age is plotted to allow the individual subjects to be visualized in relation to their age with all nuisance effects except carrier status removed (age, sex, scanner site, and NVIQ). The resulting scatter plot is well behaved and reveals that the effect of CNV is highly penetrant as the full distribution of deletion and duplication carriers are shifted relative to their controls. Almost all child-deletion carriers were above the mean for their controls (mean = 1277 cm3). Similarly, most of the duplications were below the mean for their controls (mean = 1204 cm3). The effects were not driven by the few individuals with clinical macrocephaly or microcephaly.
Relevant to this point, although diagnosis of clinical macrocephaly has been associated with idiopathic autism in only ∼15–20% of cases (Lainhart et al., 1997; Stigler et al., 2011), increased mean brain volume is a robust phenomenon in autism in particular at early ages (Redcay and Courchesne, 2005). For instance, Courchesne et al. (2001) found that 90% of 2- to 4-year-old autistic boys had whole-brain volumes above the mean for controls, and only one normal boy had a brain volume that exceeded the autistic mean. One meta-analysis estimated a 5–10% increase in total brain volume for children ages 1.5–4 years old (Amaral et al., 2008). Our cohort of 16p11.2 deletion carriers was similar. Twenty-four percent (6/25) of child-deletion carriers had clinical macrocephaly. More impressive is the fact that almost all child-deletion carriers were above the mean for their controls (mean = 1277 cm3), and had an effect size of a mean whole brain volume 9.7% larger than controls. Duplication carriers possessed a mirror opposite pattern; 23.5% (4/17) had clinical microcephaly and a decrease in mean whole-brain volume by 9.3% below that of controls (mean = 1204 cm3). Thus, it is likely that carrier status, age, gender, and genetic background all play significant roles in the observed head size in the 16p11.2 cohort, but that carrier status is the common element and hence most observable.
The effect on brain volume was also observed when cortical gray matter volume (Fig. 3A) and white matter volume (Fig. 3B) were analyzed separately. Child-deletion carriers showed increased volume compared with controls (cortical gray matter: t = −3.06, p < 0.01; cortical white matter: t = −3.54, p < 0.001), whereas adult duplications showed decreased volume compared with controls (cortical gray matter: t = 4.03, p < 0.001; cortical white matter volume: t = 5.07, p < 0.001). The percentage change in 16p11.2 carriers compared with controls was ∼11.9% in white matter volume and ∼8.5% in gray matter (Table 4). A few studies with young children (1.5–4 years) with idiopathic autism found greater increases in white mater than gray matter (Courchesne et al., 2001; Herbert et al., 2003; Hazlett et al., 2005; for review, see Amaral et al., 2008). In the present study, the age-associated increase in white matter volume in controls is difficult to interpret because the two cohorts were normalized within their age groups, nonetheless it may be a real effect consistent with observed increases in estimated volume that occur in adolescence (Matsuzawa et al., 2001; Barnea-Goraly et al., 2005; Perrin et al., 2008).
Figure 3.

Both cortical gray matter and cortical white matter show opposing effects of 16p11.2 deletion and duplication. Included participants are the same as Figure 1. A, Mean adjusted cortical gray matter is plotted for the child deletion (DEL) carriers versus their age-matched controls and the adult duplication (DUP) carriers versus their age-matched controls. Like global brain volume plotted in Figure 1, deletion carriers show a significant increase in volume and duplication carriers a significant decrease in volume. Deletion carriers show a +8.8% difference from controls, and duplication carriers show a −8.3% difference from controls. Asterisks indicate significance, with a double-asterisk reflecting p < 0.01, and a triple-asterisk representing p < 0.001. Errors bars represent SEM. B, Mean adjusted white matter volume is plotted similarly. Deletion carriers show a +12.7% difference from controls, and duplication carriers show a −11.1% difference from controls.
Table 4.
Percentage structure brain differences in CNV carriers relative to their controls
| Without ICV correction |
With ICV correction |
|||
|---|---|---|---|---|
| Deletion carriers | Duplication carriers | Deletion carriers | Duplication carriers | |
| ICV | +7.5% | −6.8% | — | — |
| Brain volume | +9.7% | −9.3% | +1.5% | −2.9% |
| Gray matter | +8.8% | −8.3% | +1.0% | −2.0% |
| White matter | +12.7% | −11.1% | +2.4% | −3.9% |
| Surface area | +7.1% | −6.6% | −1.0% | −1.4% |
| Thickness | +0.8% | −1.7% | +0.8% | −1.8% |
| Hippocampus | +5.4% | −6.5% | 0.0% | −4.0% |
| Amygdala | +3.4% | −6.0% | −2.6% | +0.6% |
| Cerebellum | +5.9% | −7.7% | +0.7% | −3.3% |
| Thalamus | +11.3% | −10.8% | +5.0% | −4.8% |
| Caudate | +2.9% | −6.5% | −0.1% | +2.2% |
| Putamen | +2.8% | −3.7% | −0.9% | +0.2% |
| Brainstem | +9.2% | −10.5% | +3.5% | −3.9% |
The two leftmost columns reflect percentage differences between CNV carriers and controls without normalization for ICV. Differences reaching significance (p < 0.05) are displayed in boldface type to help visualize general patterns. The two rightmost columns display the same data with differences normalized for ICV. Note that except for the thalamus and a few other values, the differences are minimal after normalization by ICV.
Opposing effects extend broadly to multiple subcortical volumes and the cerebellum
The effect of 16p11.2 on brain volume is not limited to cerebral cortex. Cerebellum volume is significantly increased in child deletion carriers (t = −2.33, p < 0.05) and significantly decreased in duplication carriers (t = 3.64, p < 0.001; Fig. 4A). Subcortical measures also show this same pattern, including the thalamus (children: t = −4.12, p < 0.001; adults: t = 4.73, p < 0.001; Fig. 4B) and the hippocampus in adults (adults: t = 2.90, p < 0.01; Fig. 4C). A trend toward significance was observed for the amygdala in adults (t = 1.95, p = 0.06) and hippocampus in children (t = −1.90, p = 0.06). Amygdala volume in children was not significant (t = −1.25, p = 0.22). In idiopathic autism total cerebellum volume has been found to be increased (Hardan et al., 2001; Herbert et al., 2003; Palmen et al., 2005). The thalamus (Hardan et al., 2008), hippocampus (Aylward et al., 1999; Sparks et al., 2002; Schumann et al., 2004), and amygdala (Aylward et al., 1999; Pierce et al., 2001; Schumann et al., 2004, 2009) have revealed divergent findings (for review, see Stigler et al., 2011).
Figure 4.
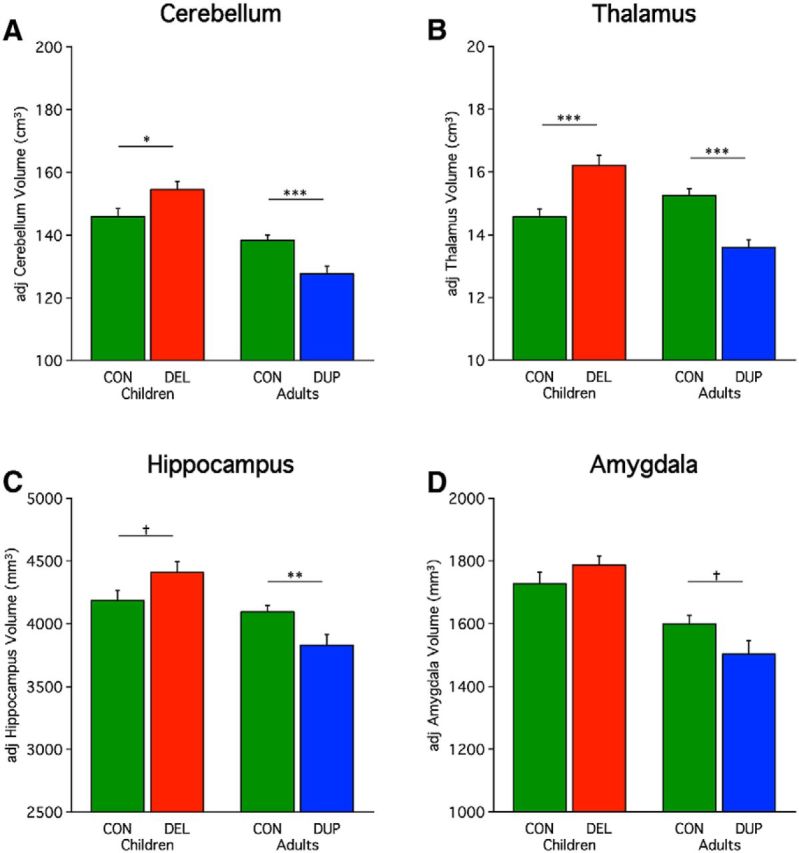
Opposing effects of 16p11.2 deletion and duplication are pervasive. Included participants are the same as Figure 1. Mean adjusted volumes are plotted for multiple structures revealing a consistent effect of deletion and duplication including for the (A) cerebellum, (B) thalamus, (C) hippocampus, and (D) amygdala. Percentage differences for deletion and duplication carriers are +5.9/−7.7 (cerebellum), +11.3/−10.8 (thalamus), +5.4/−6.5 (hippocampus), and +3.4/−6.0% (amygdala) respectfully. Asterisks indicate significance with a single asterisk reflecting p < 0.05, double-asterisk reflecting p < 0.01, and a triple-asterisk representing p < 0.001. Dagger represents a trend (p = 0.06). Errors bars represent SEM.
To better understand the relationships across the various measures of brain structure, Table 4 displays the differences in structural brain volumes estimated as a percentage difference from the age-matched control group. In this manner, for each structure, the effect of CNV can be appreciated as a quantitative value. The effects are pervasive and roughly of similar magnitude across most structures. Of all individual structures, the thalamus shows the greatest difference, although it is difficult to interpret small relative differences between structures given differences in baseline structure size as well as idiosyncratic features that arise in templates used as the target for estimation.
As another way to display relationships across measures, Table 4 also displays the percentage differences after correction for ICV. This removes the global effect of head size and estimates the differences that are present that are beyond those accounted for by global head size differences. Head size normalization attenuated most of the differences suggesting that a single global effect accounts for much of the results. An exception is the thalamus, which remains significantly larger in deletion carriers (t = −2.37, p < 0.05) and smaller in duplication carriers (t = 2.46, p < 0.05) after accounting for the global effect of head size. Duplication carriers also were significantly smaller than controls in brain volume (t = 3.84, p < 0.001), cortical white matter (t = 2.55, p < 0.05), and in cortical thickness (t = 2.18, p < 0.05), but a significant difference was not found in deletion carriers. Note that the results reported throughout this paper do not correct for ICV.
Allometric scaling plots suggest brain differences are due to genetic effects not age
The above results all converge to suggest that brain volumes are larger for deletion carriers and smaller for duplication carriers. However, the two groups, in our study, confound age. It could be the case that during childhood both deletion and duplication carriers have increased brain volumes compared with controls, and as adults both deletion and duplication carriers have decreased brain volumes compared with controls. This would be consistent with the age-specific anatomical changes that have been reported for idiopathic autism, in which brain overgrowth occurs in early life, and later life is characterized by arrested growth or decline below normal levels (Courchesne et al., 2011). If this effect is present for our dataset then a single nonuniform process might be present in 16p11.2 carriers, instead of two opposing processes. To control for age, Figure 5 plots gray matter volume in relation to ICV. Within an age group, the two values show allometric scaling such that values tend to fall along a line (Davis and Wright, 1977). This plot demonstrates that well-behaved allometric scaling is observed here within the age cohorts. The effect of age can be seen as a downward shift between the child controls (light green circles) and adult controls (dark green circles). Critically, 16p11.2 deletion and duplication carriers shift along their own age-appropriate lines. Deletion carriers (red triangles) cause a rightward shift, and duplication carriers (blue squares) cause a leftward shift. In other words, the effect of age is dissociable from the effect of the CNV.
Analysis of clinically acquired MRI suggest brain differences are due to genetic effects not age
In an effort to further explore the inferences drawn from allometric scaling plots, clinically acquired MRI images were obtained from the phenotyping core sites. This superset provided a sufficient number of child deletion carriers, unaffected siblings as controls, and the group missing from our primary analysis, child duplication carriers. Although a larger sample was available in the superset only a portion of these MRI images met quality control standards (Table 5).
Whole-brain volumes of child duplication carriers were found to be significantly smaller than controls (t = 3.25, p < 0.01), and significantly smaller than child deletion carriers (t = 6.36, p < 0.001). Additionally, brain volumes of child deletion carriers were significantly larger than controls (t = −2.71, p < 0.01; Fig. 6). This cohort allowed for direct comparison of child deletion with child duplication carriers, which was not available in the primary dataset. The results further support that reciprocal 16p11.2 CNVs lead to opposing effect on brain volume, instead of a singular process of brain overgrowth. Courchesne et al. (2011) report of “age-specific anatomical changes in autism” noted larger brain volumes in 2- to 4-year-olds, and smaller brain volumes as early as 8- to 16-year-olds. The age sampling in our cohorts are not sufficiently powered to explore effects between these age ranges.
Figure 6.

Direct comparison of clinical MRI scans in children suggests volumetric effects reflect copy number relative to a family based control group. 21 child controls (CON), 28 child deletion (DEL) carriers, and 16 child duplication (DUP) carriers are included in this analysis (Table 5). Controls are unaffected siblings of the probands. A, Mean adjusted brain volume in children is plotted. Deletion carriers show a significant increase in brain volume compared with controls. Duplication carriers show a significant decrease compared with controls. Also significant is the difference between deletions and duplication carriers. Asterisks indicate significance with a double asterisk reflecting p < 0.01, and a triple asterisk representing p < 0.001. Error bars represent SEM. B, Scatterplot of brain volume versus age before regression of nuisance factors. Age-related differences between groups over childhood are not easily observable as the growth of brain volume is dramatic from birth until the age of 8, although hints of the CNV's effects are present. C, Scatterplot of adjusted brain volume versus age reveals the effect of the CNV on the individual level. This plot is corrected for nuisance variables (age, sex, scanner site, and NVIQ) and should not be considered an accurate display of age effects. The effect of the CNV is evident even at 1 year of age before stabilization of head size.
Cortical volumetric differences are greater in surface area than thickness
Both surface area and cortical thickness contribute to cortical gray matter volume, thereby affecting whole brain volume. Expanded cerebral surface area across species is hypothesized to be due, in part, to an increase in the size of the progenitor cell pool through an extended growth phase that disproportionately affects cortical surface area over thickness, i.e., from mouse to human there is a 1000-fold increase in surface area and only a approximately twofold increase in cortical thickness (Rakic, 1988). For this reason, although there are likely multiple factors that affect cortical surface area and thickness across individuals (Hill et al., 2010 for analysis of postnatal effects), differential effects of genetic dosage on thickness versus surface area are particular informative. Prior studies have found these two measures to be genetically and phenotypically distinct (Panizzon et al., 2009; Winkler et al., 2010).
To explore differential effects on the cerebral cortex, we estimated differences in cortical thickness separately from cortical surface area. No significant difference in cortical thickness was observed in children (t = −1.10, p = 0.28). A significant, but modest, difference was observed in adults (t = 2.28, p < 0.05). A significant difference was observed in surface area for both children (t = −2.40, p < 0.05) and adults (t = 4.22, p < 0.001). Quantitatively, the effect size was considerably greater for surface area. Put into context, in children, 89.9% of the gray matter volume differential was accounted for by surface area, whereas only 10.1% was accounted for by differences in thickness. Similarly, in adults, 79.4% of the gray matter volume differential was accounted for by surface area, whereas 20.6% was accounted for by thickness. These differences could be appreciated at the individual subject level in the scatter plots (Fig. 7C,D). Increased cortical thickness has been observed in autism (Hardan et al., 2006), but at least in 16p11.2 the reciprocal differences in cerebral gray matter volume are preferentially accounted for by differences in cortical surface area.
Figure 7.

Deletion and duplication of the 16p11.2 region preferentially influence cortical surface over cortical thickness. Included participants are the same as Figure 1. A, Mean cortical thickness measured as the radial distance from the white-gray junction to the pial surface is plotted. Deletion carriers show a +0.8% difference from controls, and duplication carriers show a −1.7% difference from controls. Errors bars represent SEM. B, Mean surface area is plotted. Deletion carriers show a +7.1% difference from controls, and duplication carriers show a −6.6% difference from controls. Asterisks indicate significance with a single asterisk reflecting p < 0.05 and a triple-asterisk representing p < 0.001. C, D, Scatterplots of cortical thickness and surface area reveal the effects at the level of individual participants. Although there is a modest effect of cortical thickness, there is a clear and substantial effect on cortical surface area that can be observed in individual subjects including for the children.
Discussion
CNV at 16p11.2 has opposing and pervasive effects on the brain. A mirrored head size phenotype has been previously observed, but no prior studies in humans have directly evaluated brain structure in 16p11.2 carriers. We found opposing brain phenotypes, such that deletion carriers have increased brain volume compared with controls and duplication carriers have decreased brain volume compared with controls. The effects were robust and could be observed in individuals allowing insight into how the CNV affected the distribution. The effect appeared to shift the overall distribution of brain volumes consistent with a highly penetrant effect of gene dosage rather than an effect on a subset of individuals. Analysis of relative size scaling between structures and follow-up analyses of child cohorts with age-matched deletion and duplication carriers suggest that the opposing brain phenotypes are stable across the lifespan from children to adults. Moreover, the differences are pervasive across brain structures including the cortex, subcortical structures, cerebellum, and brainstem. If the main effect of head size is removed, only thalamic volume remained significantly different in both deletion and duplication carriers. Interestingly, on closer analysis of cortical gray matter volume, cortical thickness was minimally affected, whereas surface area was markedly different from controls.
16p11.2 influences brain volume in a dose-dependent manner
Broadly speaking, a general symmetry was observed in the deviation from the mean value of controls. The percentage difference was approximately equal on the most robust structural brain measures between deletion and duplication carriers (Table 4): ICV (∼7%), brain volume (∼9%), surface area (∼7%), cortical thickness (∼1–2%), etc. This suggests that 16p11.2 influences brain structures in a dose-dependent manner: one copy of the CNV (deletion) is associated with abnormally large brain volume (+9%), whereas two copies (controls) lead to typical development (reference), and three copies (duplication) are associated with abnormally small brain volume (−9%). Dosage-dependence implies a linear relationship between copy-number and gene expression. This is consistent with the dosage-dependent gene expression observed in a mouse model of 16p11.2. Horev et al. (2011) found mRNA expression to be significantly altered in all brain regions evaluated such that gene expression was directly correlated with dosage. Furthermore, gene expression was affected much more by dosage compared with the change in gene expression by brain region effect (comparing the cortex, cerebellum, brainstem, and optic nerves; Horev et al., 2011). Their analysis may explain the general symmetry in percentage change from controls observed in the present study for a given structure, while at the same time allowing for some variation across brain structures.
The effects are pervasive across brain structures
Explorations of the 16p11.2 CNV and the included genes in animal models have reported involvement of widespread brain structures. Cerebellum, basal ganglia, brainstem, and optic nerve involvement has been reported in mouse models of 16p11.2 (Horev et al., 2011; Portmann et al., 2014). A study using zebrafish embryos systematically altered gene expression for each of the 29 genes encompassed by 16p11.2, and found KCTD13 expression levels to be a primary driver of the head size phenotype (Golzio et al., 2012). Systematic overexpression of the mRNA transcript exclusively of KCTD13 caused microcephaly, whereas splice-blocking the KCTD13 message with morpholinos produced macrocephalic embryos (with no differences in somatic trunk size). Early in development KCTD13 transcript was found to be strongly expressed at the anterior forebrain, midbrain, and hindbrain 24 h postfertilization (Golzio et al., 2012).
A major aim of the current study was to provide greater detail as to which brain structures are affected in humans with the 16p11.2 CNV. Brain volume in the present study is a composite measurement of all brain structures: cortical gray matter, cortical white matter, thalamus, basal ganglia, limbic structures, cerebellum, and brainstem, without the voxels in the ventricles (https://surfer.nmr.mgh.harvard.edu/fswiki/MorphometryStats). A significant difference in brain volume between carriers and controls is analogous to the results found in the animal work. The detailed morphometric analyses allowed us to unpack this observation further.
Both cortical gray matter and white matter volume were significantly larger/smaller than controls. Subcortical structures, such as the thalamus and hippocampus, were also significantly different from controls. The amygdala and striatum (caudate and putamen) did not reach significance, which may be related to inadequate power in the study as they trended in the same direction as the other structures with approximately the same magnitude of volume differences. Cerebellum and brainstem volumes also reached significant levels. These results highlight the pervasive effect of 16p11.2 across brain structures. This in turn suggests involvement of 16p11.2 early in development, as the prosencephalon (cortex and thalamus), mesencephalon, and rhomboencephalon (brainstem and cerebellum) are all influenced. The thalamus was the only structure that retained significance in both deletion and duplication carriers after regressing ICV as a covariate (Table 4). This suggests that thalamic volume increased in deletion carriers and decreased in duplication carriers to a greater degree than the overall head size differences.
Collectively, the effects across brain structures are pervasive.
The brain volume phenotype may share the same genetic underpinnings as ASD in 16p11.2
Case reports provide some evidence that KCTD13 may also be a primary driver of the ASD phenotype (Crepel et al., 2011; Golzio et al., 2012). If brain volume and ASD phenotypes share a primary driver on 16p11.2, then this CNV may be best modeled as a “simplex cis-epistatic” CNV, where dysfunction of a primary driver is necessary and sufficient for multiple phenotypes but it is subject to epistatic modulation by other genes on the CNV. Additionally, epistatic modifiers heavily influence penetrance and expressivity (Golzio and Katsanis, 2013). MVP and MAPK3 modify KCTD13's effect on head size (Golzio et al., 2012), whereas a different set of epistatic modifier genes could contribute to the ASD phenotype. This model provides one explanation for the disparity in our dataset between the high penetrance and expressivity seen in brain volume versus the reduced penetrance and variable expressivity seen with the ASD phenotype. The disparity may be representative of the complex nature of 16p11.2 CNV with its phenotypes, and not an apparent sample bias toward fewer carriers with ASD. Thus, changes in brain volume itself may provide insight into the core pathobiology of ASD in 16p11.2 carriers despite differences in penetrance and expressivity.
Preferential influence on surface area suggests a candidate mechanism for abnormal brain size
An informative finding in this study was the preferential influence of 16p11.2 on surface area in contrast to a minimal effect on cortical thickness. This preferential effect on surface area provides insight into when in development the 16p11.2 CNV derails typical development. Alterations in cortical thickness can occur either during embryonic formation or postnatally as a result of synaptic exuberance and pruning (Stiles and Jernigan, 2010). The expansion of cortical surface area is strongly affected in the early embryo via increased progenitor cell production (Rakic, 1988) consistent with the effects of manipulating KCTD13 in the zebrafish (Golzio et al., 2012). In particular, augmentation of the large pool of self-renewing progenitor cells in the outer subventricular zone could account for differences in surface area in 16p11.2 deletion and duplication carriers (Hansen et al., 2010; Lui et al., 2011). Moreover, the involvement of MAPK3 is also consistent with findings in patients, as alterations of the RAS-MAPK pathway can lead to macrocephaly in Costello syndrome (Gripp et al., 2010, 2011). The differential effect on cortical surface area is not a definitive marker of an early embryonic mechanism as postnatal growth of human surface area has also been observed in particular for association regions (Hill et al., 2010). Nonetheless, the convergence between the mechanistic work in the zebrafish suggesting an early embryonic mechanism affecting cell proliferation and the pervasive, highly penetrant effect on the human brain that is preferential to cortical surface area over thickness is intriguing.
Limitations
A limitation of the present study is that the sample in unlikely representative of the full population of 16p11.2 deletion and duplication carriers. Only probands with deficits severe enough to warrant clinical evaluation and carrier parents well enough to seek recruitment were ascertained, which selected for more severely impaired children and less affected parents. Furthermore, only the subset of carriers that were capable of lying still in an MRI scanner proceeded to the neuroimaging core sites, which may have precluded the most severely affected carriers. Inadequate recruitment of child duplication and adult-deletion carriers prevented direct analysis of all six groups for all brain measures; however, the core result (reciprocal increase and decrease in brain volume) was observed in a subset of age-matched child deletion and duplication carriers (Fig. 6). The study was not powered for subgroup analysis between de novo and inherited cases. Hanson et al. (2014) have noted significantly greater impairment on SRS and NVIQ in de novo versus inherited cases. Moreover, many of our analyses of deletion and duplication carriers used matched controls in the general population (Fig. 6 is an exception, as it used a family based control group). Thus, other genetic effects transmitted by noncarrier parents were not controlled for in the analyses of brain region volumes. Despite this heterogeneity, we were still able to see robust changes in both groups of carriers, independent of the clinical severity of the groups.
As with all morphometric measures of brain structure, subtle differences in data quality and image contrast (which covaries with age) can affect measurements. These technical concerns should be kept in mind especially when interpreting regional (spatially specific) effects and differential effects on tissue compartments (white matter versus gray matter). We screened the data carefully for data quality and generally found pervasive effects that could be observed at the level of individuals across the age spectrum. That said, the preferential effect on the thalamus (for both deletion and duplication carriers) and the differential effect on surface area over thickness should be explored with independent methods (e.g., manual assessment and postmortem analysis). Of the various measures, although still showing high reliability, cortical thickness showed the least stable reliability (ICC = 0.85).
Conclusions
Deletion and duplication carriers of 16p11.2 show opposing and pervasive effects on brain structure. Differences in cortical gray matter volume were due to the preferential influence of 16p11.2 copy number variation on surface area. This finding suggests that the mechanism underlying differences in brain volume in 16p11.2 may involve early stages of development.
Footnotes
This work was supported by a Grant from the Simons Foundation (SFARI no. 219193 to R.B.). We thank all of the families at the participating Simons Variation in Individuals Project (VIP) sites, as well as the Simons VIP Consortium. We appreciate obtaining access to phenotypic data on SFARI Base. Approved researchers can obtain the Simons VIP population dataset described in this study by contacting the Simons Foundation Autism Research Initiative. A.Q. was supported by NIH/NINDS 5R25NS065743. We thank Avram Holmes for helpful advice on data analysis and Dr Nicholas Katsanis for insightful discussion.
The authors declare no competing financial interests.
References
- Amaral DG, Schumann CM, Nordahl CW. Neuroanatomy of autism. Trends Neurosci. 2008;31:137–145. doi: 10.1016/j.tins.2007.12.005. [DOI] [PubMed] [Google Scholar]
- Andreasen NC, Flaum M, Swayze V, 2nd, O'Leary DS, Alliger R, Cohen G, Ehrhardt J, Yuh WT. Intelligence and brain structure in normal individuals. Am J Psychiatry. 1993;150:130–134. doi: 10.1176/ajp.150.1.130. [DOI] [PubMed] [Google Scholar]
- Aylward EH, Minshew NJ, Goldstein G, Honeycutt NA, Augustine AM, Yates KO, Barta PE, Pearlson GD. MRI volumes of amygdala and hippocampus in non-mentally retarded autistic adolescents and adults. Neurology. 1999;53:2145–2150. doi: 10.1212/WNL.53.9.2145. [DOI] [PubMed] [Google Scholar]
- Barnea-Goraly N, Menon V, Eckert M, Tamm L, Bammer R, Karchemskiy A, Dant CC, Reiss AL. White matter development during childhood and adolescence: a cross-sectional diffusion tensor imaging study. Cereb Cortex. 2005;15:1848–1854. doi: 10.1093/cercor/bhi062. [DOI] [PubMed] [Google Scholar]
- Bijlsma EK, Gijsbers AC, Schuurs-Hoeijmakers JH, van Haeringen A, Fransen van de Putte DE, Anderlid BM, Lundin J, Lapunzina P, Pérez Jurado LA, Delle Chiaie B, Loeys B, Menten B, Oostra A, Verhelst H, Amor DJ, Bruno DL, van Essen AJ, Hordijk R, Sikkema-Raddatz B, Verbruggen KT, et al. Extending the phenotype of recurrent rearrangements of 16p11.2: deletions in mentally retarded patients without autism and in normal individuals. Eur J Med Genet. 2009;52:77–87. doi: 10.1016/j.ejmg.2009.03.006. [DOI] [PubMed] [Google Scholar]
- Buckner RL, Head D, Parker J, Fotenos AF, Marcus D, Morris JC, Snyder AZ. A unified approach for morphometric and functional data analysis in young, old, and demented adults using automated atlas-based head size normalization: reliability and validation against manual measurement of total intracranial volume. Neuroimage. 2004;23:724–738. doi: 10.1016/j.neuroimage.2004.06.018. [DOI] [PubMed] [Google Scholar]
- Chaste P, Klei L, Sanders SJ, Murtha MT, Hus V, Lowe JK, Willsey AJ, Moreno-De-Luca D, Yu TW, Fombonne E, Geschwind D, Grice DE, Ledbetter DH, Lord C, Mane SM, Lese Martin C, Martin DM, Morrow EM, Walsh CA, Sutcliffe JS, et al. Adjusting head circumference for covariates in autism: clinical correlates of a highly heritable continuous trait. Biol Psychiatry. 2013;74:576–584. doi: 10.1016/j.biopsych.2013.04.018. [DOI] [PMC free article] [PubMed] [Google Scholar]
- Cook EH, Jr, Scherer SW. Copy-number variations associated with neuropsychiatric conditions. Nature. 2008;455:919–923. doi: 10.1038/nature07458. [DOI] [PubMed] [Google Scholar]
- Courchesne E, Karns CM, Davis HR, Ziccardi R, Carper RA, Tigue ZD, Chisum HJ, Moses P, Pierce K, Lord C, Lincoln AJ, Pizzo S, Schreibman L, Haas RH, Akshoomoff NA, Courchesne RY. Unusual brain growth patterns in early life in patients with autistic disorder: an MRI study. Neurology. 2001;57:245–254. doi: 10.1212/WNL.57.2.245. [DOI] [PubMed] [Google Scholar]
- Courchesne E, Carper R, Akshoomoff N. Evidence of brain overgrowth in the first year of life in autism. JAMA. 2003;290:337–344. doi: 10.1001/jama.290.3.337. [DOI] [PubMed] [Google Scholar]
- Courchesne E, Campbell K, Solso S. Brain growth across the life span in autism: age-specific changes in anatomical pathology. Brain Res. 2011;1380:138–145. doi: 10.1016/j.brainres.2010.09.101. [DOI] [PMC free article] [PubMed] [Google Scholar]
- Crepel A, Steyaert J, De la Marche W, De Wolf V, Fryns JP, Noens I, Devriendt K, Peeters H. Narrowing the critical deletion region for autism spectrum disorders on 16p11.2. Am J Med Genet B Neuropsychiatr Genet. 2011;156:243–245. doi: 10.1002/ajmg.b.31163. [DOI] [PubMed] [Google Scholar]
- Crespi B, Badcock C. Psychosis and autism as diametrical disorders of the social brain. Behav Brain Sci. 2008;31:241–320. doi: 10.1017/S0140525X08004214. [DOI] [PubMed] [Google Scholar]
- Dale AM, Fischl B, Sereno MI. Cortical surface-based analysis: I. segmentation and surface reconstruction. Neuroimage. 1999;9:179–194. doi: 10.1006/nimg.1998.0395. [DOI] [PubMed] [Google Scholar]
- Davis PJ, Wright EA. A new method for measuring cranial cavity volume and its application to the assessment of cerebral atrophy at autopsy. Neuropathol App Neurobiol. 1977;3:341–358. doi: 10.1111/j.1365-2990.1977.tb00595.x. [DOI] [Google Scholar]
- Fischl B. FreeSurfer. Neuroimage. 2012;62:774–781. doi: 10.1016/j.neuroimage.2012.01.021. [DOI] [PMC free article] [PubMed] [Google Scholar]
- Fischl B, Sereno MI, Dale AM. Cortical surface-based analysis: II: inflation, flattening, and a surface-based coordinate system. Neuroimage. 1999;9:195–207. doi: 10.1006/nimg.1998.0396. [DOI] [PubMed] [Google Scholar]
- Fischl B, Salat DH, Busa E, Albert M, Dieterich M, Haselgrove C, van der Kouwe A, Killiany R, Kennedy D, Klaveness S, Montillo A, Makris N, Rosen B, Dale AM. Whole brain segmentation: automated labeling of neuroanatomical structures in the human brain. Neuron. 2002;33:341–355. doi: 10.1016/S0896-6273(02)00569-X. [DOI] [PubMed] [Google Scholar]
- Fotenos AF, Snyder AZ, Girton LE, Morris JC, Buckner RL. Normative estimates of cross-sectional and longitudinal brain volume decline in aging and AD. Neurology. 2005;64:1032–1039. doi: 10.1212/01.WNL.0000154530.72969.11. [DOI] [PubMed] [Google Scholar]
- Golzio C, Katsanis N. Genetic architecture of reciprocal CNVs. Curr Opin Genet Dev. 2013;23:240–248. doi: 10.1016/j.gde.2013.04.013. [DOI] [PMC free article] [PubMed] [Google Scholar]
- Golzio C, Willer J, Talkowski ME, Oh EC, Taniguchi Y, Jacquemont S, Reymond A, Sun M, Sawa A, Gusella JF, Kamiya A, Beckmann JS, Katsanis N. KCTD13 is a major driver of mirrored neuroanatomical phenotypes of the 16p11.2 copy number variant. Nature. 2012;485:363–367. doi: 10.1038/nature11091. [DOI] [PMC free article] [PubMed] [Google Scholar]
- Gripp KW, Hopkins E, Doyle D, Dobyns WB. High incidence of progressive postnatal cerebellar enlargement in Costello syndrome: brain overgrowth associated with HRAS mutations as the likely cause of structural brain and spinal cord abnormalities. Am J Med Genet A. 2010;152:1161–1168. doi: 10.1002/ajmg.a.33391. [DOI] [PMC free article] [PubMed] [Google Scholar]
- Gripp KW, Hopkins E, Sol-Church K, Stabley DL, Axelrad ME, Doyle D, Dobyns WB, Hudson C, Johnson J, Tenconi R, Graham GE, Sousa AB, Heller R, Piccione M, Corsello G, Herman GE, Tartaglia M, Lin AE. Phenotypic analysis of individuals with Costello syndrome due to HRAS p.G13C. Am J Med Genet A. 2011;155A:706–716. doi: 10.1002/ajmg.a.33884. [DOI] [PMC free article] [PubMed] [Google Scholar]
- Hansen DV, Lui JH, Parker PR, Kriegstein AR. Neurogenic radial glia in the outer subventricular zone of human neocortex. Nature. 2010;464:554–561. doi: 10.1038/nature08845. [DOI] [PubMed] [Google Scholar]
- Hanson E, Bernier R, Porche K, Jackson FI, Goin-Kochel RP, Snyder LG, Snow AV, Wallace AS, Campe KL, Zhang Y, Chen Q, D'Angelo D, Moreno-De-Luca A, Orr PT, Boomer KB, Evans DW, Kanne S, Berry L, Miller FK, Olson J, et al. The cognitive and behavioral phenotype of the 16p11.2 deletion in a clinically ascertained population. Biol Psychiatry. 2014 doi: 10.1016/j.biopsych.2014.04.021. in press. [DOI] [PMC free article] [PubMed] [Google Scholar]
- Hardan AY, Minshew NJ, Mallikarjuhn M, Keshavan MS. Brain volume in autism. J Child Neurol. 2001;16:421–424. doi: 10.1177/088307380101600607. [DOI] [PubMed] [Google Scholar]
- Hardan AY, Muddasani S, Vemulapalli M, Keshavan MS, Minshew NJ. An MRI study of increased cortical thickness in autism. Am J Psychiatry. 2006;163:1290–1292. doi: 10.1176/appi.ajp.163.7.1290. [DOI] [PMC free article] [PubMed] [Google Scholar]
- Hardan AY, Minshew NJ, Melhem NM, Srihari S, Jo B, Bansal R, Keshavan MS, Stanley JA. An MRI and proton spectroscopy study of the thalamus in children with autism. Psychiatry Res. 2008;163:97–105. doi: 10.1016/j.pscychresns.2007.12.002. [DOI] [PMC free article] [PubMed] [Google Scholar]
- Hazlett HC, Poe M, Gerig G, Smith RG, Provenzale J, Ross A, Gilmore J, Piven J. Magnetic resonance imaging and head circumfrence study of brain size in autism: birth through age 2 years. Arch Gen Psychiatry. 2005;62:1366–1376. doi: 10.1001/archpsyc.62.12.1366. [DOI] [PubMed] [Google Scholar]
- Herbert MR, Ziegler DA, Deutsch CK, O'Brien LM, Lange N, Bakardjiev A, Hodgson J, Adrien KT, Steele S, Makris N, Kennedy D, Harris GJ, Caviness VS., Jr Dissociations of cerebral cortex, subcortical and cerebral white matter volumes in autistic boys. Brain. 2003;126:1182–1192. doi: 10.1093/brain/awg110. [DOI] [PubMed] [Google Scholar]
- Hill J, Inder T, Neil J, Dierker D, Harwell J, Van Essen D. Similar patterns of cortical expansion during human development and evolution. Proc Natl Acad Sci U S A. 2010;107:13135–13140. doi: 10.1073/pnas.1001229107. [DOI] [PMC free article] [PubMed] [Google Scholar]
- Horev G, Ellegood J, Lerch JP, Son YE, Muthuswamy L, Vogel H, Krieger AM, Buja A, Henkelman RM, Wigler M, Mills AA. Dosage-dependent phenotypes in models of 16p11.2 lesions found in autism. Proc Natl Acad Sci U S A. 2011;108:17076–17081. doi: 10.1073/pnas.1114042108. [DOI] [PMC free article] [PubMed] [Google Scholar]
- Jacquemont S, Reymond A, Zufferey F, Harewood L, Walters RG, Kutalik Z, Martinet D, Shen Y, Valsesia A, Beckmann ND, Thorleifsson G, Belfiore M, Bouquillon S, Campion D, de Leeuw N, de Vries BB, Esko T, Fernandez BA, Fernández-Aranda F, Fernández-Real JM, et al. Mirror extreme BMI phenotypes associated with gene dosage at the chromosome 16p11.2 locus. Nature. 2011;478:97–102. doi: 10.1038/nature10406. [DOI] [PMC free article] [PubMed] [Google Scholar]
- Lainhart JE, Piven J, Wzorek M, Landa R, Santangelo SL, Coon H, Folstein SE. Macrocephaly in children and adults with autism. J Am Acad Child Adolesc Psychiatry. 1997;36:282–290. doi: 10.1097/00004583-199702000-00019. [DOI] [PubMed] [Google Scholar]
- Lui JH, Hansen DV, Kriegstein AR. Development and evolution of the human neocortex. Cell. 2011;146:18–36. doi: 10.1016/j.cell.2011.06.030. [DOI] [PMC free article] [PubMed] [Google Scholar]
- Matsuzawa J, Matsui M, Konishi T, Noguchi K, Gur RC, Bilker W, Miyawaki T. Age-related volumetric changes of brain gray and white matter in healthy infants and children. Cereb Cortex. 2001;11:335–342. doi: 10.1093/cercor/11.4.335. [DOI] [PubMed] [Google Scholar]
- McCarthy SE, Makarov V, Kirov G, Addington AM, McClellan J, Yoon S, Perkins DO, Dickel DE, Kusenda M, Krastoshevsky O, Krause V, Kumar RA, Grozeva D, Malhotra D, Walsh T, Zackai EH, Kaplan P, Ganesh J, Krantz ID, Spinner NB, et al. Microduplications of 16p11.2 are associated with schizophrenia. Nat Genet. 2009;41:1223–1227. doi: 10.1038/ng.474. [DOI] [PMC free article] [PubMed] [Google Scholar]
- Moreno-De-Luca A, Myers SM, Challman TD, Moreno-De-Luca D, Evans DW, Ledbetter DH. Developmental brain dysfunction: revival and expansion of old concepts based on new genetic evidence. Lancet Neurol. 2013;12:406–414. doi: 10.1016/S1474-4422(13)70011-5. [DOI] [PMC free article] [PubMed] [Google Scholar]
- Owen JP, Chang YS, Pojman NJ, Bukshpun P, Wakahiro ML, Marco EJ, Berman JL, Spiro JE, Chung WK, Buckner RL, Roberts TP, Nagarajan SS, Sherr EH, Mukherjee P, Simons VIP Consortium Aberrant white matter microstructure in children with 16p11.2 deletions. J Neurosci. 2014;34:6214–6223. doi: 10.1523/JNEUROSCI.4495-13.2014. [DOI] [PMC free article] [PubMed] [Google Scholar]
- Palmen SJ, Hulshoff Pol HE, Kemner C, Schnack HG, Durston S, Lahuis BE, Kahn RS, Van Engeland H. Increased gray-matter volume in medication-naïve high-functioning children with autism spectrum disorder. Psychol Med. 2005;35:561–570. doi: 10.1017/S0033291704003496. [DOI] [PubMed] [Google Scholar]
- Panizzon MS, Fennema-Notestine C, Eyler LT, Jernigan TL, Prom-Wormley E, Neale M, Jacobson K, Lyons MJ, Grant MD, Franz CE, Xian H, Tsuang M, Fischl B, Seidman L, Dale A, Kremen WS. Distinct genetic influences on cortical surface area and cortical thickness. Cereb Cortex. 2009;19:2728–2735. doi: 10.1093/cercor/bhp026. [DOI] [PMC free article] [PubMed] [Google Scholar]
- Perrin JS, Hervé PY, Leonard G, Perron M, Pike GB, Pitiot A, Richer L, Veillette S, Pausova Z, Paus T. Growth of white matter in the adolescent brain: role of testosterone and androgen receptor. J Neurosci. 2008;28:9519–9524. doi: 10.1523/JNEUROSCI.1212-08.2008. [DOI] [PMC free article] [PubMed] [Google Scholar]
- Pierce K, Müller RA, Ambrose J, Allen G, Courchesne E. Face processing occurs outside the fusiform ‘face area’ in autism: evidence from functional MRI. Brain. 2001;124:2059–2073. doi: 10.1093/brain/124.10.2059. [DOI] [PubMed] [Google Scholar]
- Piven J, Nehme E, Simon J, Barta P, Pearlson G, Folstein SE. Magnetic resonance imaging in autism: measurement of the cerebellum, pons, and fourth ventricle. Biol Psychiatry. 1992;31:491–504. doi: 10.1016/0006-3223(92)90260-7. [DOI] [PubMed] [Google Scholar]
- Portmann T, Yang M, Mao R, Panagiotakos G, Ellegood J, Dolen G, Bader PL, Grueter BA, Goold C, Fisher E, Clifford K, Rengarajan P, Kalikhman D, Loureiro D, Saw NL, Zhengqui Z, Miller MA, Lerch JP, Henkelman RM, Shamloo M, et al. Behavioral abnormalities and circuit defects in the basal ganglia of a mouse model of 16p11.2 deletion syndrome. Cell Reports. 2014;7:1077–1092. doi: 10.1016/j.celrep.2014.03.036. [DOI] [PMC free article] [PubMed] [Google Scholar]
- Rakic P. Specification of cerebral cortical areas. Science. 1988;241:170–176. doi: 10.1126/science.3291116. [DOI] [PubMed] [Google Scholar]
- Raz N, Lindenberger U, Rodrigue KM, Kennedy KM, Head D, Williamson A, Dahle C, Gerstorf D, Acker JD. Regional brain changes in aging healthy adults: general trends, individual differences and modifiers. Cereb Cortex. 2005;15:1676–1689. doi: 10.1093/cercor/bhi044. [DOI] [PubMed] [Google Scholar]
- Redcay E, Courchesne E. When is the brain enlarged in autism? A meta-analysis of all brain size reports. Biol Psychiatry. 2005;58:1–9. doi: 10.1016/j.biopsych.2005.03.026. [DOI] [PubMed] [Google Scholar]
- Reiss AL, Abrams MT, Singer HS, Ross JL, Denckla MB. Brain development, gender and IQ in children: a volumetric imaging study. Brain. 1996;119:1763–1774. doi: 10.1093/brain/119.5.1763. [DOI] [PubMed] [Google Scholar]
- Rosenfeld JA, Coppinger J, Bejjani BA, Girirajan S, Eichler EE, Shaffer LG, Ballif BC. Speech delays and behavioral problems are the predominant features in individuals with developmental delays and 16p11.2 microdeletions and microduplications. J Neurodev Disord. 2010;2:26–38. doi: 10.1007/s11689-009-9037-4. [DOI] [PMC free article] [PubMed] [Google Scholar]
- Schumann CM, Hamstra J, Goodlin-Jones BL, Lotspeich LJ, Kwon H, Buonocore MH, Lammers CR, Reiss AL, Amaral DG. The amygdala is enlarged in children but not adolescents with autism; the hippocampus is enlarged at all ages. J Neurosci. 2004;24:6392–6401. doi: 10.1523/JNEUROSCI.1297-04.2004. [DOI] [PMC free article] [PubMed] [Google Scholar]
- Schumann CM, Barnes CC, Lord C, Courchesne E. Amygdala enlargement in toddlers with autism related to severity of social and communication impairments. Biol Psychiatry. 2009;66:942–949. doi: 10.1016/j.biopsych.2009.07.007. [DOI] [PMC free article] [PubMed] [Google Scholar]
- Schumann CM, Bloss CS, Barnes CC, Wideman GM, Carper RA, Akshoomoff N, Pierce K, Hagler D, Schork N, Lord C, Courchesne E. Longitudinal magnetic resonance imaging study of cortical development through early childhood in autism. J Neurosci. 2010;30:4419–4427. doi: 10.1523/JNEUROSCI.5714-09.2010. [DOI] [PMC free article] [PubMed] [Google Scholar]
- Shinawi M, Liu P, Kang SH, Shen J, Belmont JW, Scott DA, Probst FJ, Craigen WJ, Graham BH, Pursley A, Clark G, Lee J, Proud M, Stocco A, Rodriguez DL, Kozel BA, Sparagana S, Roeder ER, McGrew SG, Kurczynski TW, et al. Recurrent reciprocal 16p11.2 rearrangements associated with global developmental delay, behavioural problems, dysmorphism, epilepsy, and abnormal head size. J Med Genet. 2010;47:332–341. doi: 10.1136/jmg.2009.073015. [DOI] [PMC free article] [PubMed] [Google Scholar]
- Simons VIP Consortium. Simons variation in individuals project (Simons VIP): a genetics-first approach to studying autism spectrum and related neurodevelopmental disorders. Neuron. 2012;73:1063–1067. doi: 10.1016/j.neuron.2012.02.014. [DOI] [PubMed] [Google Scholar]
- Sparks BF, Friedman SD, Shaw DW, Aylward EH, Echelard D, Artru AA, Maravilla KR, Giedd JN, Munson J, Dawson G, Dager SR. Brain structural abnormalities in young children with autism spectrum disorder. Neurology. 2002;59:184–192. doi: 10.1212/WNL.59.2.184. [DOI] [PubMed] [Google Scholar]
- Stigler KA, McDonald BC, Anand A, Saykin AJ, McDougle CJ. Structural and functional magnetic resonance imaging of autism spectrum disorders. Brain Res. 2011;1380:146–161. doi: 10.1016/j.brainres.2010.11.076. [DOI] [PMC free article] [PubMed] [Google Scholar]
- Stiles J, Jernigan TL. The basics of brain development. Neuropsychol Rev. 2010;20:327–348. doi: 10.1007/s11065-010-9148-4. [DOI] [PMC free article] [PubMed] [Google Scholar]
- van der Kouwe AJ, Benner T, Salat DH, Fischl B. Brain morphometry with multiecho MPRAGE. Neuroimage. 2008;40:559–569. doi: 10.1016/j.neuroimage.2007.12.025. [DOI] [PMC free article] [PubMed] [Google Scholar]
- Walsh KM, Bracken MB. Copy number variation in the dosage-sensitive 16p11.2 interval accounts for only a small proportion of autism incidence: a systematic review and meta-analysis. Genet Med. 2011;13:377–384. doi: 10.1097/GIM.0b013e3182076c0c. [DOI] [PubMed] [Google Scholar]
- Weiss LA, Shen Y, Korn JM, Arking DE, Miller DT, Fossdal R, Saemundsen E, Stefansson H, Ferreira MA, Green T, Platt OS, Ruderfer DM, Walsh CA, Altshuler D, Chakravarti A, Tanzi RE, Stefansson K, Santangelo SL, Gusella JF, Sklar P, et al. Association between microdeletion and microduplication at 16p11.2 and autism. N Engl J Med. 2008;358:667–675. doi: 10.1056/NEJMoa075974. [DOI] [PubMed] [Google Scholar]
- Winkler AM, Kochunov P, Blangero J, Almasy L, Zilles K, Fox PT, Duggirala R, Glahn DC. Cortical thickness or grey matter volume? The importance of selecting the phenotype for imaging genetics studies. Neuroimage. 2010;53:1135–1146. doi: 10.1016/j.neuroimage.2009.12.028. [DOI] [PMC free article] [PubMed] [Google Scholar]
- Zufferey F, Sherr EH, Beckmann ND, Hanson E, Maillard AM, Hippolyte L, Macé A, Ferrari C, Kutalik Z, Andrieux J, Aylward E, Barker M, Bernier R, Bouquillon S, Conus P, Delobel B, Faucett WA, Goin-Kochel RP, Grant E, Harewood L, et al. A 600 kb deletion syndrome at 16p11.2 leads to energy imbalance and neuropsychiatric disorders. J Med Genet. 2012;49:660–668. doi: 10.1136/jmedgenet-2012-101203. [DOI] [PMC free article] [PubMed] [Google Scholar]