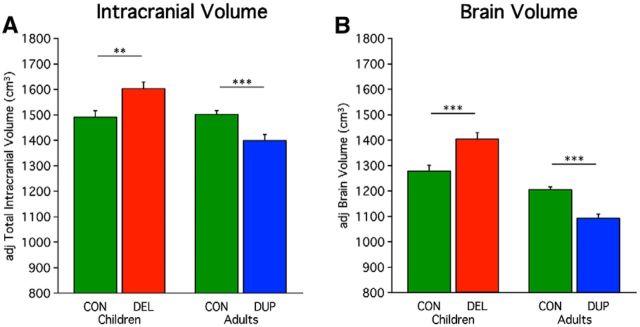
Figure 1.
Global measures of ICV and brain volume show opposing effects of 16p11.2 deletion and duplication. 29 child controls, 25 child-deletion carriers, 33 adult controls, and 17 adult duplication carriers are included in this analysis (Table 1). A, Mean adjusted ICV is plotted for the child deletion (DEL) carriers versus their age-matched controls and the adult duplication (DUP) carriers versus their age-matched controls. The values are adjusted via regression for age, sex, scanner site, and NVIQ. Deletion carriers show a significant increase in volume and duplication carriers a significant decrease in volume. Deletion carriers show a +7.5% differences from controls, and duplication carriers show a −6.8% differences from controls. Asterisks indicate significance with a double-asterisk reflecting p < 0.01 and a triple-asterisk representing p < 0.001. Errors bars represent SEM. B, Mean adjusted brain volume is plotted similarly. Brain volume includes cortical gray matter, cortical white matter, subcortical structures, brainstem, and cerebellum without the volume encompassed by ventricles or the subarachnoid space. The pattern for brain volume differences parallels that observed for ICV. Deletion carriers show a +9.7% difference from controls, and duplication carriers show a −9.3% difference from controls.

