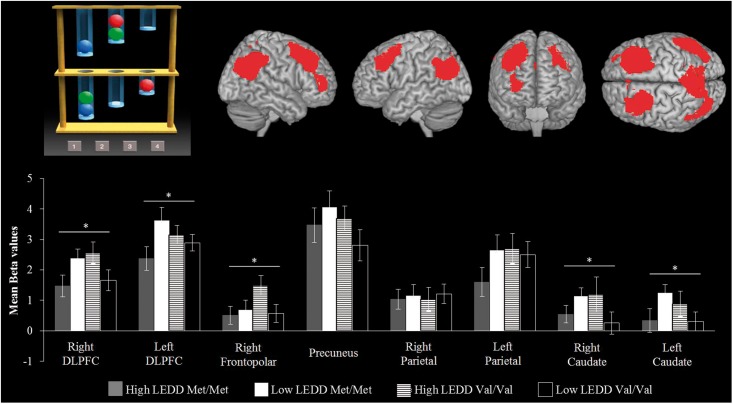
Figure 3.
For the Tower of London Task (top left), the activation in regions of interest is presented separately by COMT genotype and LEDD in patients (bottom). The y-axis of each graph represents the mean activation in terms of average parameter estimates. The data are subdivided by a median split of LEDD (above versus below 275 mg/day) for each region of interest (top right). *P < 0.05.

