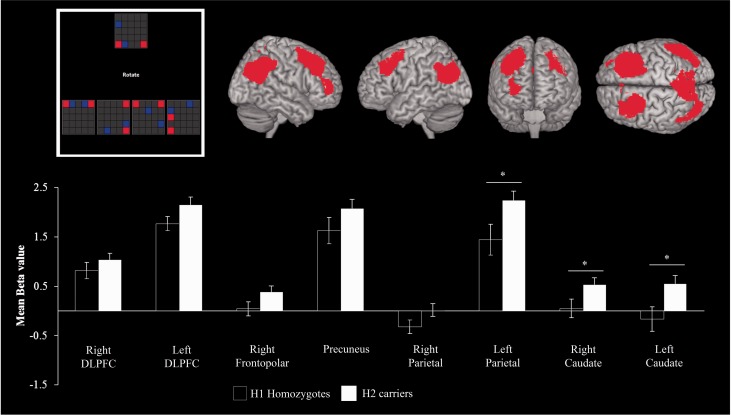
Figure 5.
For the Spatial Rotations Task (top left), the activation within each region of interest (top right) is plotted separately for H1 patient homozygotes and H2 patient carriers. The y-axes represent the mean parameter estimate, in arbitrary scaled units. See text for details of the gene by region interaction. Post hoc t-test analysis indicated that region of interest and MAPT genotype interaction occurred at marked areas (bottom). *P < 0.05.

