

Abstract
Dihydrolipoamide acyltransferase (E2), a catalytic and structural component of the three functional classes of multienzyme complexes that catalyze the oxidative decarboxylation of α-keto acids, forms the central core to which the other components are attached. We have imaged by negative stain and cryoelectron microscopy the truncated dihydrolipoamide acetyltransferase core (60 subunits; Mr = 2.7 × 10⁶) of the Saccharomyces cerevisiae pyruvate dehydrogenase complex. Using icosahedral particle reconstruction techniques, we determined its structure to 25 Å resolution. Although the model derived from the negative stain reconstruction was approximately 20% smaller than the model derived from the frozen-hydrated data, when corrected for the effects of the electron microscope contrast transfer functions, the reconstructions showed excellent correspondence. The pentagonal dodecahedron-shaped macromolecule has a maximum diameter, as measured along the 3-fold axis, of ~226 Å (frozen-hydrated value), and 12 large openings (~63 Å in diameter) on the 5-fold axes that lead into a large solvent-accessible cavity (~76–140 Å diameter). The 20 vertices consist of cone-shaped trimers, each with a flattened base on the outside of the structure and an apex directed toward the center. The trimers are interconnected by 20 Å thick “bridges” on the 2-fold axes. These studies also show that the highest resolution features apparent in the frozen-hydrated reconstruction are revealed in a filtered reconstruction of the stained molecule.
Three functional classes of multienzyme complexes catalyze the oxidative decarboxylation of α-keto acids: pyruvate dehydrogenase (PDH)1 complex, α-ketoglutarate dehydrogenase (KGDH) complex, and branched chain α-keto acid dehydrogenase (BCKDH) complex. A central core, the complex-specific dihydrolipoamide acyltransferase (E2), is a catalytic and structural component of these enzyme complexes. The core serves as the scaffold to which the substrate-specific decarboxylase-dehydrogenase (E1) and the common dihydrolipoamide dehydrogenase (E3) are attached (recent reviews in Refs. 1–3). Mammalian and yeast PDH complexes also have binding sites on the E2 core for protein X, which is required for anchoring E3 to the core (4–6). A challenging problem in structural biology involves elucidation of structure-function relationships in these multienzyme complexes.
Two polyhedral forms, the cube and the pentagonal dodecahedron, have been shown by electron microscopy (7) and x-ray crystallography (8, 9) to be the fundamental morphologies of the E2 cores. The cubic structure has 24 subunits, whereas the pentagonal dodecahedron has 60 subunits, grouped apparently as trimers positioned at each of the 8 and 20 vertices of the two structures, respectively. The former organization, which exhibits octahedral symmetry (point group 432), is characteristic of the E2 components of the Escherichia coli PDH and KGDH complexes and the mammalian KGDH and BCKDH complexes. The latter organization, which exhibits icosahedral symmetry (point group 532), is characteristic of E2 cores of the PDH complexes from eukaryotes and some Gram-positive bacteria (1, 2). The E2 subunits have multidomain structures consisting of one, two, or three amino-terminal lipoyl domains, followed by an E1 and/or E3 binding domain and then by a carboxyl-terminal catalytic domain (1–3). The domains are linked to each other by flexible segments. An assemblage of catalytic domains comprises the octahedral or icosahedral inner core of E2.
Crystal structures of truncated cubic forms of E2 (tE2), lacking most or all of the peripheral domains, have been reported. These include low resolution (15–18 Å) structures of truncated forms of the dihydrolipoamide succinyltransferase (8) and the acetyltransferase (9) from E. coli, and a high resolution (2.6 Å) structure of a truncated acetyltransferase from Azotobacter vinelandii (10). The tE2s from E. coli were proteolytically derived, whereas the tE2 from A. vinelandii was a recombinant protein.
As part of structure-function studies of the PDH complex from Saccharomyces cereuisiae, we report electron microscopy and image reconstruction studies which reveal the three-dimensional structure of a recombinant truncated form (residues 181–454) of the acetyltransferase component (11). This tE2 subunit lacks the lipoyl and E1 binding domains. Because the tE2 appears to have 532 symmetry (11), as do many spherical viruses, we used the well established methods of icosahedral particle reconstruction to compute the three-dimensional structure of the tE2. Because this is the first report of a reconstruction of a nonviral protein using this approach, we computed two reconstructions, one from images of stained particles and the other from images of unstained frozen-hydrated particles in order to establish their validity. These reconstructions provide new insights concerning the structural organization of the icosahedral E2 core of the yeast PDH complex, as well as indicate that the different preparative methods used to visualize the particle faithfully reproduce a consistent structural design.
Experimental Procedures
Enzyme Preparation
The S. cereuisiae tE2 subunit, comprising residues 181–454, was overexpressed in E. coli, and the assembled tE2 core was purified to homogeneity as described (11). It exhibited catalytic activity (acetyl transfer from [1-14C]acetyl-CoA to dihydrolipoamide) very similar to that of wild-type E2.
Electron Microscopy
The enzyme (1.4 mg/ml) was diluted 121 × with methylamine tungstate stain (0.25%) and immediately sprayed on Butvar 76 copper-coated grids as described (12). Since most of the stained molecules orient with a pentagonal face normal to the grid surface, micrographs were recorded with the grid stage tilted 10° to allow a more random distribution of orientations. For cryoelectron microscopy, a 3 μl sample of a solution containing 0.22 mg/ml enzyme, 1 mM phenylmethanesulfonyl fluoride, 0.5 mM dithiothreitol, and 0.01% sodium azide (pH 7.3) was deposited, blotted, and quick-frozen in liquid ethane on a glow-discharged carbon-coated holey grid (13). Micrographs of stained samples were recorded under conditions of ~1 μm underfocus and >100 e/Å2 total dose. The vitrified samples were recorded at ~1 μm underfocus and ~ 9 e/Å2 dose. All images were recorded on Kodak SO 163 film at a nominal magnification × 50,000 in a JEOL JEM 1200 electron microscope operated at 100 kV as described (13). To aid in analyzing images of the frozen-hydrated specimens, a second exposure of the same field of view at ~1.7 μm underfocus was also recorded.
Image Processing
Densitometry and Image Reconstructions
The micrographs selected for computer processing were chosen on the basis of several criteria, including (i) appropriate sample concentration, (ii) appropriate stain or vitreous ice sample thickness, (iii) random distribution of particle orientations, (iv) objective lens defocus, (v) minimal objective lens astigmatism, and (vi) minimal specimen movement. The micrographs were scanned at 25-μm intervals equivalent to 5 Å sampling at the specimen. Individual particle images were boxed, floated, and processed to remove background gradients, and the intensity values were normalized as described (14). The x, y coordinates defining the center and θ, φ, Ω angles defining the orientation of each particle were determined by means of established common lines and cross-common lines procedures (14). Three-dimensional reconstructions were computed from each data set (n = 40 and n = 13 for the stained and unstained macromolecules, respectively) with the same Fourier-Bessel procedures used to analyze images of icosahedral viruses (15–17). The number of particle images in each data set and the distribution of orientations allowed the reconstructions to be computed to Fourier cutoffs of 22.5 Å (stained) and 26.5 Å (unstained). All reciprocal eigenvalues for the normal equations (17) were less than 1.0 for both data sets to the respective resolutions and 96 and 99% for the stained and unstained molecule data sets, respectively, were less than 0.1. These results demonstrate that both data sets include more than enough unique particle views to compute the three-dimensional density distributions to an isotropic resolution of 25 Å without introducing artifacts that result from the use of nonrandom data. Each reconstruction was averaged in real space to impose full 532 icosahedral symmetry (15). Based on comparisons of two 20-particle reconstructions computed from independently refined unique data sets (16), the resolution limit of the reconstructed stained molecule was estimated as about 25 Å. The smaller size of the data set for the unstained molecules (n = 13) precluded determining a resolution estimate by these means. However, direct inspection of the unstained structure compared with the stained structure indicated that resolution limits of the two reconstructions were comparable, although the reconstruction derived from unstained data was noisier, as expected. The global contrast, size, and average density in the reconstruction of the stained tE2 molecule was adjusted to give maximal correlation (minimum difference) with the reconstruction of the unstained molecule.2
Display and Image Corrections
Subsequent processing and display of the reconstructed density maps were performed with the SUPRIM image processing system and the SYNU rendering software (18). Solid surface rendering of each reconstruction was computed with a threshold (surface) level set to just eliminate the noise external to the macromolecule. To correct reconstructions for the effects of the contrast transfer function (CTF) (19, 20), theoretical CTFs were generated for the conditions of microscopy used to record images. These CTFs were calculated according to the procedures described (19, 20) for 100 kV electrons and Cs (spherical aberration coefficient) = 5.3 mm, assuming amplitude contrast contributions of 40 and 7%, and defocus settings of 1.2 and 1.0 μm for the stained and unstained molecule data, respectively. The reconstructions were then filtered in Fourier space by means of the inverse of the calculated CTFs to generate the corrected data. In order to minimize artifacts in the corrected data, all Fourier components with frequencies greater than the first zero of the CTF were eliminated prior to multiplying by the inverse of the transfer function. The filtered reconstructions were displayed as solid surface models with the surface threshold adjusted to eliminate external noise as described above.
Volume Measurements
We estimated the excluded volumes of the tE2 molecules by counting in each map the number of density points (voxels) whose intensity exceeded the noise level.
Results
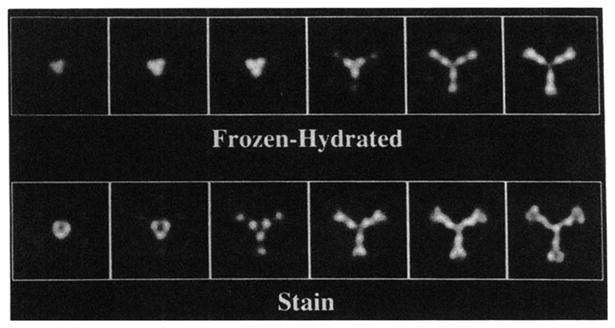
Projected images of stained and frozen-hydrated S. cereuisiae tE2 molecules exhibit the 5-, 3-, and 2-fold symmetries that are characteristic of a pentagonal dodecahedron (Fig. 1). These characteristic axial views of the core structure are similar to those reported for the mammalian dihydrolipoamide acetyltransferase in vitreous ice (21) and in stain (7, 22). In addition to these views, a “cross” shape is also often seen (Fig. 1, arrows).
Fig. 1. Fields of stained (A) and frozen-hydrated (B) tE2.

The multiple views of the pentagonal dodecahedron-like structure are apparent. Arrows denote a cross-like projected view of the structure. The field in A has a predominance of the 5-fold view. Magnification bar = 1000 Å.
Comparison of the two micrographs shows that the stained tE2 molecules are smaller than the corresponding frozen-hydrated molecules, a phenomenon we attribute to an apparent shrinkage of the molecules by the staining procedures. We determined that the three-dimensional structures of the tE2 molecules were well preserved in thicker layers of the stain because the projected images of molecules in untilted specimens (predominantly oriented in the 5-fold view) converted to 2- and 3-fold views upon tilting the specimen grid by ~30° in the microscope (Fig. 2, A and B). Molecules that lie in thinner regions of stain near the boundary of the stain droplet (Fig. 2A, arrow) display a larger circular profile than molecules lying in the thicker regions of stain. This large profile converts to an oval shape in the tilted view, demonstrating that the molecules flatten when not fully supported by stain; indeed, both squashing and breaking up of the structure have occurred when the molecules are located near the stain boundary (Fig. 2A). These results clearly show that, with the exception of isotropic shrinkage, the stain helps maintain the native tE2 structure when it is fully embedded. The Butvar support film also contributes to the stability of tE2 in the stain because these molecules interact little or not at all with this film. As a result, some molecules of tE2 are suspended above the film in the stain (12), thus minimizing potential perturbations of the structure due to surface interactions.
Fig. 2. tE2 field with the microscope stage untilted (A) or tilted 32° (B).

Tilt axis is approximately vertical. Five-fold views are seen to interconvert to 2- and 3-fold views upon rotation of the structure as indicated by the numbered arrows. The arrows identify a tE2 molecule in a thin region of the stain. The oval shape of the molecule in B reveals that it was partially flattened on the grid. Magnification bar = 500 Å.
In contrast to the apparent preservation of most of the tE2 molecules in stain, many of the frozen-hydrated molecules appeared to be disrupted, incomplete, or distorted (Fig. 1B) making it more difficult to select particles with preserved symmetry for use in image reconstruction (see below).
Truncated E2 Structure
The reconstructed density maps of the stained and unstained tE2 molecules are remarkably similar despite the larger (1.2×) size and opposite contrast of the frozen-hydrated structure (Fig. 3). Both reconstructions reveal an open solvent-accessible tE2 structure. Twelve large openings (~63 Å in diameter, frozen-hydrated value) at the 5-fold axes lead into a large cavity in the center of the molecule. The highest density in the molecule is concentrated in triangular-shaped features at the 20 vertices of the dodecahedron and in 30 “bridges” that cross the 2-fold axes, connecting neighboring vertices. The maximum diameter of the molecule, as measured along the 3-fold axis, is 200 and 226 Å in the maps of the stained and unstained molecules, respectively. The corresponding volumes occupied by the protein in the reconstructions are, surprisingly, the same, 1.7 × 10⁶ Å.3 The calculated molecular weight for the structure, 1.4 × 10⁶ (assuming a v of 0.74 cm3/g), is 20% less than the expected molecular weight of the 60-subunit complex, Mr = 1.76 × 10⁶. The underestimate of the molecular weight is probably related to an underestimate of the protein volume in the two reconstructions; the underestimate of the volume of the stained reconstruction may be related to the shrinkage of the molecules in the stain, whereas the underestimate of the volume in the unstained reconstruction may have resulted from the more extensive thresholding required to eliminate noise external to the molecule. In this regard, the relative signal-to-noise ratios for the two reconstructions were 25 to 1 (stain/unstained). However, the excellent correspondence between the two reconstructions provides strong evidence that both preparation methods lead to a consistent view of the molecular architecture and also supports the proposition that the structures determined are reliable.
Fig. 3. Surface-shaded representations of the 5-, 3-, and 2-fold views of the three-dimensional reconstructions from the images of frozen-hydrated and stained tE2 molecules.

The reconstruction of the stained molecules was corrected for the effects of the microscope CTF and filtered by the CTF corresponding to the frozen-hydrated data to effectively treat both sets of data in the same manner (see text). Magnification bar = 100 Å. The lower panel shows a stereo pair of the 3-fold view of tE2 from the frozen-hydrated reconstruction.
The density at each vertex of the tE2 macromolecule is cone-shaped, with a flattened triangular base at the outside surface of the structure and its apex directed toward the center of the molecule. The cone-shaped density is ~45 Å on a side at its base and is ~60 Å high (frozen-hydrated values). Outside and inside views of the molecule along a 3-fold axis of symmetry (Fig. 4) and serial slices starting from the outside of the molecule in the same orientation (Fig. 5) clearly reveal the trimeric nature of the density at each vertex. Three putative subunits (subunit Mr = 29,272 (11)) form the bulk of density in the triangular base of the cone. Additional density from each subunit is directed toward the center of the molecule at the apex of the cone and also to ward a 2-fold related subunit in an adjacent vertex, with which it interacts through a ~20-Å thick bridge. The cone-like shape of the protein at each vertex suggests that the interactions between the subunits may be quite extensive.
Fig. 4. Surface-shaded representations of frozen-hydrated and stained tE2 molecules, viewed along a 3-fold symmetry axis and scaled to the same size and corrected (see text).

The “front” and “rear” halves of the reconstructed volumes are shown.
Fig. 5. Serial planes at 5-Å intervals through the reconstructions of the frozen-hydrated and stained tE2 molecules starting from their outer edge and viewed in the 3-fold direction.
The two reconstructions have been scaled to the same size, and the stained data were filtered as described in the text. Three subunits that comprise each vertex of the structure are apparent. The radius at the center of the first panel is 105 Å (frozen-hydrated value).
Radial density plots of the reconstructions show a significant increase in average density at a radius of ~35 Å (Fig. 6), which, presumably, represents the protein density at the apex of the cone. This is consistent with measurements from the three-dimensional reconstruction which show that the inner, solvent-filled cavity varies in diameter from ~76 to 130 Å. Both plots show a significant decrease in average density before the highest density in the outer shell of the structure (>~100 Å) is reached. This decrease in density at ~60 Å radius, although not apparent in the surface-shaded views of the three-dimensional reconstructions, suggests that the apex region of the cone is connected to its base by a region of lower density. The radial displacements of corresponding features in the two plots also indicate that the shrinkage of the stained structure is isotropic.
Fig. 6. Radial density plots of the stained (■) and unstained (⊡) tE2 molecules.
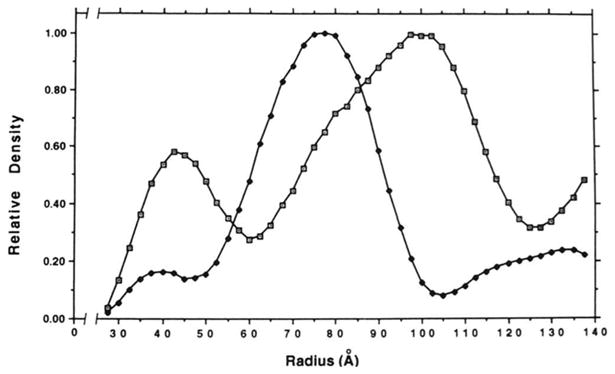
The plots were scaled to normalize the peak densities at ~ 75 and 100 Å. Because of noise artifacts that typically accumulate at the center of three-dimensional reconstructions (31), the data corresponding to 0-25 Å are not shown.
Corrections for Microscope Contrast Transfer Function Effects
The electron microscope images and the subsequent reconstructions are affected by the CTF of the electron microscope. The CTF for each of the recorded micrographs depends primarily on the level of defocus, the spherical aberration of the objective lens of the microscope, and the relative contributions of amplitude and phase contrast for the object (19). In the present study, the CTFs for the micrographs of stained and unstained specimens we analyzed were calculated assuming the specimens contributed 40 and 7% amplitude contrast, respectively (19, 20). We obtained more meaningful correlations between the two reconstructions by scaling the data to the same size and relative contrast and by correcting each density map in Fourier space with the appropriate inverse CTF.
Comparisons of corrected and uncorrected reconstructions show that the two corrected reconstructions (Fig. 7, B and C) are more similar to each other than are the uncorrected reconstructions (Fig.7, A and D). However, some of the details seen in the uncorrected density map of the unstained tE2 molecule are suppressed in the corrected map because of the significantly increased weight given the lower frequency components in the corrected data. These same higher resolution features are revealed in the map of the stained tE2 molecule after these data are treated as if the corresponding images were recorded under conditions similar to those used to visualize the unstained specimen (Fig. 7, D and E). These results indicate that, under predominately phase contrast imaging conditions, the microscope effectively acts as a high pass, image filtering instrument, and particular specimen spacings at higher resolutions (typically in the 20–30 Å size range for images recorded in the 1–2 μm range of underfocus) are enhanced while the lowest frequency information is suppressed. Although images of stained molecules do contain higher resolution features comparable with those seen in images of unstained molecules, the images of stained molecules contain significant contributions from amplitude contrast at low resolution produced by the strongly scattering stain atoms.
Fig. 7. Two-fold views of tE2 reconstructions scaled to the same size.

A, original stain data; B, CTF-corrected stain data; C, CTF-corrected unstained data; D, original unstained data; E, stain data, CTF-corrected as in B and filtered with the CTF present in the original unstained data (as in D).
The trimeric features at the vertices of the tE2 molecule are best revealed in the serial sections of maps (Fig. 5), only for data treated as if imaged under phase contrast conditions. The excellent correspondence between the two reconstructions that have been corrected for the effects of the corresponding microscope CTFs demonstrates that the primary differences between the stained and unstained tE2 molecules are merely the overall size and relative contrast.
Discussion
To gain further insight into the quaternary structure of and structure-function relationships in icosahedral PDH complexes, the S. cerevisiae PDH complex was selected as a model system. Protein engineering in conjunction with electron microscopy and image reconstruction should permit localization of the peripheral subunits, E1, E3, and protein X, attached to the E2 core. With mutants harboring disrupted genes, mutant PDH complexes have been obtained that lack E1 or E3 or protein × and E3 (6, 23). It appears that this structural information will not be forthcoming from x-ray crystallographic studies, because attempts to crystallize any of the α-keto acid dehydrogenase complexes or the native forms of E2 have been unsuccessful. This is due apparently to the conformational flexibility of the linker segments which tether the peripheral domains to the cube-like or pentagonal dodecahedron-like inner cores (1). By contrast, truncated forms of E2 lacking most, or all, of these flexible extensions have been crystallized, and the structure of one of these forms, the cubelike truncated E2 from the A. vinelandii PDH complex, has been solved to 2.6-Å resolution (10).
The pentagonal dodecahedron-like structure of the S. cerevisiae tE2 (Fig. 3) shows some common features with the corresponding cubic structures of the E. coli (8, 9) and A. uinelandii (10) tE2s. These tE2s consist of cone-shaped trimers that associate to form a cage-like structure encompassing a large central cavity. The protein atoms were estimated to occupy less than 50% of the volume of the hollow cage-like structure of the A. uinelandii tE2 (10). In the octahedral structures, the tip of the cone is directed toward the center of the macromolecule and the three subunits which comprise the base of the flattened cone interact with the subunits in the neighboring vertices through a narrow bridge. Even though the base of the cone for the A. uinelandii tE2 (radius = 27 Å) is comparable in size to the corresponding S. cereuisiae tE2 (radius ~26 Å), the height is appreciably shorter (~46 and ~60 Å for the A. vinelandii and S. cereuisiae tE2s, respectively). The atomic resolution x-ray structure shows that there are extensive contacts between trimers (10). Interestingly, despite these extensive contacts, the reconstructions of stained or frozen-hydrated particles do resolve three globular features (Fig. 5). In contrast, serial sections starting from the outer edge of the 2-fold view did not delineate a subunit-subunit interface between pairs of subunits from neighboring vertices, thus suggestive of even closer contacts (data not shown). This may be partly responsible for the greater stability of the S. cereuisiae E2, compared with the A. vinelandii E2, which is known to dissociate upon binding of peripheral components E1, or E3, or both (24).
Comparable three-dimensional reconstructions of stained and frozen-hydrated 70 S E. coli ribosomes have been reported (25–27). A 40 Å resolution reconstruction of unstained ribosomes, showed that (i) 70 S ribosomes partially collapse in stain, (ii) the gap between the 30 S and 40 S ribosomal subunits closes, and (iii) the 30 S subunit is “strongly flattened” (25). These effects were attributed to possible interactions between the ribosomes and the uranyl acetate stain and to the use of the double-layer carbon film, which was used to ensure total embedding of particles in the stain. A popular notion, one based primarily on data obtained from imaging virus structures by use of conventional stain microscopy in which the particles are bound to a support surface and stained with uranyl salts (28), is that structures of macromolecules are better preserved in ice than in stain (28, 29). To the contrary, we have shown that some of the oligomeric proteins under investigation are equally well or better preserved when a Butvar support film and methylamine tungstate stain are employed. For example, the yeast fatty acid synthase (30), ornithine decarboxylase from Lactobacillus 30a (12), and the methylamine form of human α2-macroglobulin are equally preserved by these staining procedures.3 This stain is superior to uranyl acetate in its ability to preserve structure, and the Butvar support film minimizes surface interactions, thereby further reducing perturbations resulting from the staining procedures (12). The structures of native human &α2-macroglobulin (13), tE2, and human complement proteins C3 and C3b exhibit superior preservation in stain than do those in vitreous ice. Furthermore, frozen-hydrated C3 and C3b and the chicken liver fatty acid synthase are perturbed beyond recognition.3 We believe that macromolecules prepared in a vitreous state may, in fact, be subjected to stresses resulting from their proximity to the air-water interface and electrostatic interaction with the glow-discharged carbon-coated grids.
The present study demonstrates the utility of the methylamine tungstate stain and the Butvar support film which are able to maintain the three-dimensional structure of a hollow 60-subunit macromolecule and yield detailed information regarding the organization of the molecule that is comparable with a reconstruction from frozen-hydrated molecules. We conclude that, with the exception of having opposite contrast, the corrected (and scaled) reconstructions of the stained and unstained tE2 macromolecules are identical at approximately 25-Å resolution. Thus, information contained in images of stained macromolecules can be revealed without introduction of spurious artifacts, as established by the comparison to reconstructions of frozen-hydrated molecules, after appropriate compensation is made for the effects of the microscope CTF.
Acknowledgments
We thank B. Lee Ligon for editorial assistance, K. A. Dryden for help in digitizing micrographs, and R. H. Cheng for programs to compute correlation coefficients between reconstructions of stained and unstained molecules and Professor Marvin Hackert for helpful discussions.
Footnotes
This study was supported by United States Public Health Service Grants GM46278, GM39536, and HL42886 (to J. K. S.), GM33050 (to T. S. B.), and by GM0659 and a grant from the Foundation for Research (to L. J. R.). A preliminary report of this study was presented at the Annual Meeting of the American Society for Biochemistry and Molecular Biology, Houston, Texas, February 9–13, 1992 (Baker, T. S., Niu, X.-D., Reed, L. J., Schroeter, J. P., Kolodziej, S. J., and Stoops, J. K. (1992) FASEB J. 6, A345). The costs of publication of this article were defrayed in part by the payment of page charges. This article must therefore be hereby marked “advertisement” in accordance with 18 U.S.C. Section 1734 solely to indicate this fact.
The abbreviations used are: PDH, pyruvate dehydrogenase; E1, pyruvate decarboxylase-dehydrogenase; E2, dihydrolipoamide acetyl-transferase or acyltransferase; E3, dihydrolipoamide dehydrogenase; KGDH, α-ketoglutarate dehydrogenase; BCKDH, branched chain α-keto acid dehydrogenase; tE2, truncated dihydrolipoamide acetyl-transferase or acyltransferase; CTF, contrast transfer function.
R. H. Cheng and T. S. Baker, unpublished observations.
J. K. Stoops, unpublished observations.
References
- 1.Perham RN. Biochemistry. 1991;30:8501–8512. doi: 10.1021/bi00099a001. [DOI] [PubMed] [Google Scholar]
- 2.Reed LJ, Hackert ML. J Biol Chem. 1990;265:8971–8974. [PubMed] [Google Scholar]
- 3.Guest JR, Angier SJ, Russell GC. Ann N Y Acad Sci. 1989;573:76–99. doi: 10.1111/j.1749-6632.1989.tb14988.x. [DOI] [PubMed] [Google Scholar]
- 4.Gopalakrishnan S, Rahmatullah M, Radke GA, Powers-Greenwood S, Roche TE. Biochem Biophys Res Commun. 1989;160:715–721. doi: 10.1016/0006-291x(89)92492-3. [DOI] [PubMed] [Google Scholar]
- 5.Neagle JC, Lindsay JG. Biochem J. 1991;278:423–427. doi: 10.1042/bj2780423. [DOI] [PMC free article] [PubMed] [Google Scholar]
- 6.Lawson JE, Behal RH, Reed LJ. Biochemistry. 1991;30:2834–2839. doi: 10.1021/bi00225a015. [DOI] [PubMed] [Google Scholar]
- 7.Oliver RM, Reed LJ. In: Electron Microscopy of Proteins. Harris JR, editor. Vol. 2. Academic Press; London: 1982. pp. 1–47. [Google Scholar]
- 8.DeRosier DJ, Oliver RM, Reed LJ. Proc Natl Acad Sci U S A. 1971;68:1135–1137. doi: 10.1073/pnas.68.6.1135. [DOI] [PMC free article] [PubMed] [Google Scholar]
- 9.Fuller CC, Reed LJ, Oliver RM, Hackert ML. Biochem Biophys Res Commun. 1979;90:431–438. doi: 10.1016/0006-291x(79)91253-1. [DOI] [PubMed] [Google Scholar]
- 10.Mattevi A, Obmolova G, Schulze E, Kalk KH, Westphal AH, DeKok A, Hol WGJ. Science. 1992;255:1544–1550. doi: 10.1126/science.1549782. [DOI] [PubMed] [Google Scholar]
- 11.Niu XD, Stoops JK, Reed LJ. Biochemistry. 1990;29:8614–8619. doi: 10.1021/bi00489a017. [DOI] [PubMed] [Google Scholar]
- 12.Stoops JK, Momany C, Ernst SR, Oliver RM, Schroeter JP, Bretaudiere JP, Hackert ML. J Electron Microsc Techn. 1991;18:157–166. doi: 10.1002/jemt.1060180210. [DOI] [PubMed] [Google Scholar]
- 13.Stoops JK, Schroeter JP, Bretaudiere JP, Olson NH, Baker TS, Strickland DK. J Struct Biol. 1991;106:172–178. doi: 10.1016/1047-8477(91)90086-c. [DOI] [PMC free article] [PubMed] [Google Scholar]
- 14.Baker TS, Newcomb WW, Olson NH, Cowsert LM, Olson C, Brown JC. Biophys J. 1991;60:1445–1456. doi: 10.1016/S0006-3495(91)82181-6. [DOI] [PMC free article] [PubMed] [Google Scholar]
- 15.Fuller SD. Cell. 1987;48:932–934. doi: 10.1016/0092-8674(87)90701-x. [DOI] [PubMed] [Google Scholar]
- 16.Baker TS, Drak J, Bina M. Proc Natl Acad Sci U S A. 1988;85:422–426. doi: 10.1073/pnas.85.2.422. [DOI] [PMC free article] [PubMed] [Google Scholar]
- 17.Crowther RA. Philos Trans R Soc Lond Biol Sci B. 1971;261:221–230. doi: 10.1098/rstb.1971.0054. [DOI] [PubMed] [Google Scholar]
- 18.Hessler D, Young SJ, Carragher BO, Martone M, Hinshaw JE, Milligan RA, Masliah E, Whittaker M, Lamont S, Ellisman MH. In: Microscopy: The Key Research Tool. Lyman CE, Peachey LD, Fisher RM, editors. EMSA; Milwaukee: 1992. pp. 73–82. [DOI] [PubMed] [Google Scholar]
- 19.Erickson HP, Klug A. Philos Trans R Soc Lond Biol Sci B. 1971;261:105–118. [Google Scholar]
- 20.Toyoshima C, Unwin N. Ultramicroscopy. 1988;25:279–292. doi: 10.1016/0304-3991(88)90003-4. [DOI] [PubMed] [Google Scholar]
- 21.Wagenknecht T, Grassucci R, Radke GA, Roche TE. J Biol Chem. 1991;266:24650–24656. [PubMed] [Google Scholar]
- 22.Junger E, Reinauer H. Biochim Biophys Acta. 1972;250:478–490. doi: 10.1016/0005-2744(71)90248-8. [DOI] [PubMed] [Google Scholar]
- 23.Lawson JE, Niu XD, Reed LJ. Biochemistry. 1991;30:11249–11254. doi: 10.1021/bi00111a009. [DOI] [PubMed] [Google Scholar]
- 24.Bosma HJ, De Kok A, Westphal AH, Veeger C. Eur J Biochem. 1984;142:541–549. doi: 10.1111/j.1432-1033.1984.tb08320.x. [DOI] [PubMed] [Google Scholar]
- 25.Frank J, Penczek P, Grassucci R, Srivastava S. J Cell Biol. 1991;115:597–605. doi: 10.1083/jcb.115.3.597. [DOI] [PMC free article] [PubMed] [Google Scholar]
- 26.Wagenknecht T, Carazo JM, Radermacher M, Frank J. Biophys J. 1989;55:455–464. doi: 10.1016/S0006-3495(89)82839-5. [DOI] [PMC free article] [PubMed] [Google Scholar]
- 27.Carazo JM, Wagenknecht T, Frank J. Biophys J. 1989;55:465–477. doi: 10.1016/S0006-3495(89)82840-1. [DOI] [PMC free article] [PubMed] [Google Scholar]
- 28.Olson NH, Baker TS. Ultramicroscopy. 1989;30:281–298. doi: 10.1016/0304-3991(89)90057-0. [DOI] [PMC free article] [PubMed] [Google Scholar]
- 29.Dubochet J, Adrian M, Chang MJ, Homo JC, Lepault J, McDowell AW, Schultz P. Q Rev Biophys. 1988;21:29–228. doi: 10.1017/s0033583500004297. [DOI] [PubMed] [Google Scholar]
- 30.Stoops JK, Kolodziej SJ, Schroeter JP, Bretaudiere JP, Wakil SJ. Proc Natl Acad Sci U S A. 1992;89:6585–6589. doi: 10.1073/pnas.89.14.6585. [DOI] [PMC free article] [PubMed] [Google Scholar]
- 31.Olson NH, Baker TS, Johnson JE, Hendry DA. J Struct Biol. 1990;105:111–122. doi: 10.1016/1047-8477(90)90105-l. [DOI] [PMC free article] [PubMed] [Google Scholar]