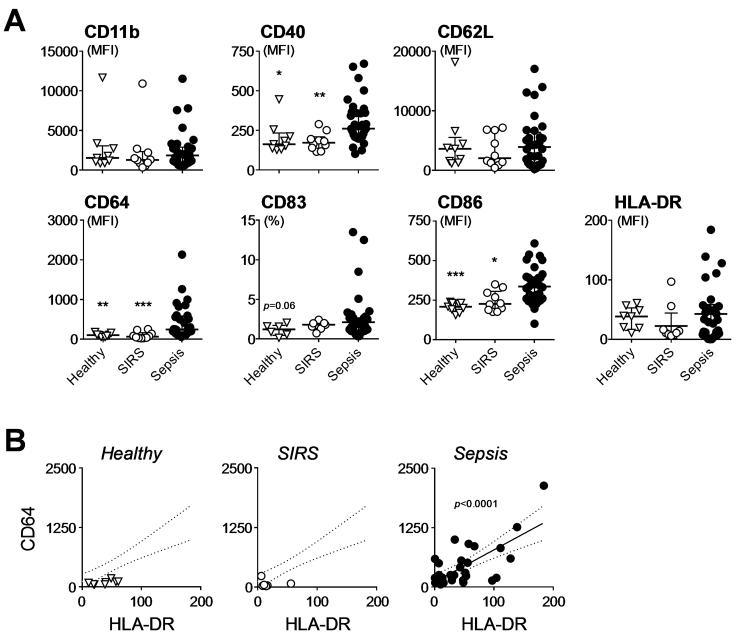
FIGURE 3. APC-like phenotype of circulating neutrophils during acute sepsis.
(A) Surface expression of the indicated markers on circulating neutrophils in patients with SIRS (n=14) or sepsis (n=37) and in healthy controls (n=10). Each data point represents an individual, lines and error bars depict medians and interquartile ranges. Data were analyzed using Kruskal-Wallis tests and Dunn’s multiple comparison tests; comparisons were made with sepsis patients. (B) Correlation between surface expression of CD64 and HLA-DR on circulating neutrophils in healthy controls and in patients with SIRS or sepsis. Lines depict linear regression and 95% confidence bands as calculated for sepsis neutrophils. Differences were considered significant as indicated in the figures: *, p<0.05; **, p<0.01; ***, p<0.001.

