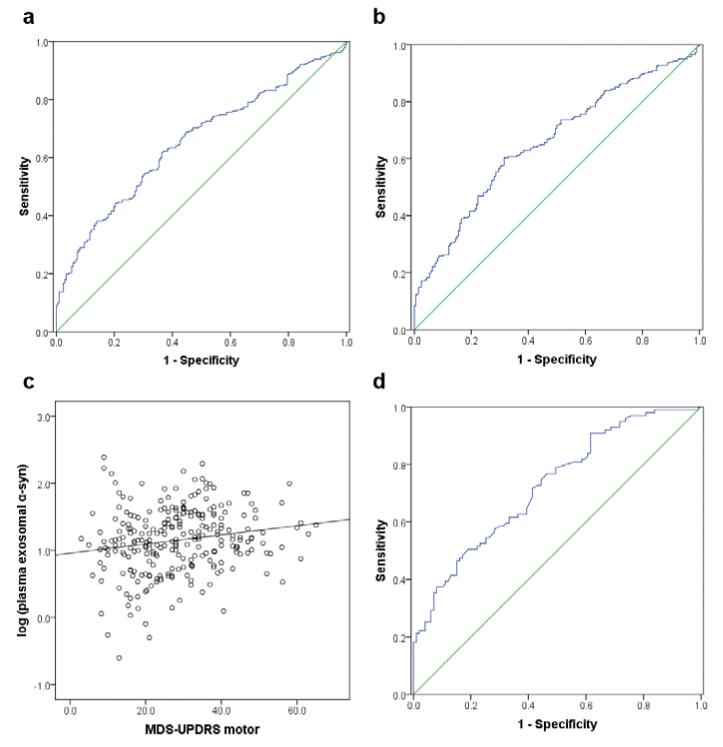
Fig. 4. ROC analysis of biomarker candidates for PD diagnosis and correlation with disease severity.
(a) In the whole cohort (267 patients with PD and 215 healthy controls), the plasma exosomal α-syn provided an AUC of 0.654 (sensitivity=70.1%, specificity=52.9%) for PD versus controls. (b) The exosomal α-syn/total α-syn ratio in plasma performed similarly (AUC=0.657, sensitivity=71.2%, specificity=50.0%) in the whole cohort. (c) A significant correlation between the plasma exosomal α-syn and the disease severity indexed by the UPDRS motor score was observed in PD patients (r=0.176, p=0.004, Pearson correlation). (d) In a subset of subjects with CSF samples available (100 PD and 100 controls), the CSF total α-syn could produce an AUC of 0.724 (sensitivity=76.8%, specificity=53.5%). No correlation between CSF total α-syn and the UPDRS motor scores could be found (not shown). AUC, area under curve; CSF, cerebrospinal fluid; exo, exosomal; MDS-UPDRS, the Movement Disorder Society (MDS) Unified Parkinson’s Disease Rating Scale; PD, Parkinson disease; ROC, receiver operating characteristic; α-syn, α-synuclein.

