

Abstract
A detailed nonlinear four-region (red blood cell, plasma, interstitial fluid, and parenchymal cell) axially distributed convection-diffusion-permeation-reaction-binding computational model is developed to study the simultaneous transport and exchange of oxygen (O2) and carbon dioxide (CO2) in the blood–tissue exchange system of the heart. Since the pH variation in blood and tissue influences the transport and exchange of O2 and CO2 (Bohr and Haldane effects), and since most CO2 is transported as (bicarbonate) via the CO2 hydration (buffering) reaction, the transport and exchange of and H+ are also simulated along with that of O2 and CO2. Furthermore, the model accounts for the competitive nonlinear binding of O2 and CO2 with the hemoglobin inside the red blood cells (nonlinear O2–CO2 interactions, Bohr and Haldane effects), and myoglobin-facilitated transport of O2 inside the parenchymal cells. The consumption of O2 through cytochrome-c oxidase reaction inside the parenchymal cells is based on Michaelis–Menten kinetics. The corresponding production of CO2 is determined by respiratory quotient (RQ), depending on the relative consumption of carbohydrate, protein, and fat. The model gives a physiologically realistic description of O2 transport and metabolism in the microcirculation of the heart. Furthermore, because model solutions for tracer transients and steady states can be computed highly efficiently, this model may be the preferred vehicle for routine data analysis where repetitive solutions and parameter optimization are required, as is the case in PET imaging for estimating myocardial O2 consumption.
Keywords: Axially distributed model, Convection-diffusion-permeation-reaction-binding model, Blood–tissue exchange, Oxygen and carbon dioxide transport, Oxygen transport and metabolism, Myoglobin-facilitated oxygen transport, Oxyhemoglobin and carbamino hemoglobin dissociation curves
INTRODUCTION
The modeling of oxygen transport and metabolism in individual organs is critical for the quantitative understanding of organ and cell functions during physiological responses to change of state, and in pathological states such as ischemia and hypoxia. Oxygen (O2) transport and metabolism involves convection, diffusion, permeation, chemical reactions, binding and facilitated transport.20,51,54 Oxygen’s binding to hemoglobin (Hb) is affected directly by carbon dioxide (CO2) levels, pH, temperature, and 2,3-diphosphoglycerate (2,3-DPG) levels, and affected indirectly therefore by bicarbonate ( ) buffering, metabolism and tissue acidification, renal acid and base handling, and the hemoglobin mediated nonlinear O2–CO2 interactions.26,37,44,63 A decrease in pH or an increase in CO2 partial pressure (PCO2) in the systemic capillaries reduces the affinity of Hb for O2 (the Bohr effect) and enhances the delivery of O2 to tissue. A decrease in pH or an increase in O2 partial pressure (PCO2) in the pulmonary capillaries reduces the affinity of Hb for CO2 and enhances the removal of CO2 from blood into alveoli (Haldane effect). Including the Hb-mediated nonlinear O2–CO2 interactions of the Bohr and Haldane effects is critical to the exchange kinetics because of the rapid changes in hemogblobin’s affinities to both the gases in the exchange regions.
The interpretation and understanding of alveoli–blood or blood–tissue gas exchange, whether being assessed from the observations of arterial and venous O2 concentrations,20,51,54 or by intra-tissue chemical signals such as BOLD MRI46,53 or hemoglobin and myoglobin spectra,59,60 or by external detection of tracer content such as 15O-oxygen and 15O-water through PET studies,27,51,55,62 depends in general on all the factors involved in the dissociation of oxyhemoglobin. To study the dynamics of O2 transport and metabolism, it is therefore important to account for the transport and exchange of CO2, , and H+ as well as O2–CO2 interactions.
The classical Krogh tissue cylinder model,50 a single cylindrical tissue unit supplied by a single capillary, has been the basis for most of the theoretical studies on microcirculatory oxygen transport to tissue over the past 80 years. Reviews by Hellums et al.37 and Popel54 and recent studies oriented toward PET 15O-oxygen image analysis by Beyer et al.,20 Deussen and Bassingthwaighte,27 and Li et al.51 illustrate the applicability of the geometry that Krogh modeled. Other models based on non-cylindrical geometry have been designed or proposed to reflect the morphological and anatomical structures of the specific tissues.16–18,31,34,61
There have been previous studies on simultaneous or dynamic transport and exchange of O2 and CO2 in the microcirculation. Hill et al.39–41 and Salathe et al.58 studied the kinetics of O2 and CO2 exchange through compartmental modeling by accounting for physical and biochemical processes including the acid–base balance. However, they did not account for convection and diffusion (and hence, concentration gradients) along the capillary length, a major aspect of determining tissue levels and understanding alveolar–arterial oxygen differences. Huang and Hellums44 developed a quantitative model for convective and diffusive gas (O2 and CO2) transport and acid–base regulation in blood flowing in microvessels and in oxygenators while accounting for Bohr and Haldane effects, as discussed in the review by Hellums et al.37 They did not account for the permeation and subsequent consumption of O2 within the tissue cells, or the production of CO2. A more complete model of O2 and CO2 transport and exchange in the micro-circulation is therefore needed for the analysis of experimental data and is the subject of this paper.
To formulate an exchange model, Dash and Bassingthwaighte’s26 equations for oxyhemoglobin and carbamino hemoglobin dissociation curves accounting for pH and Hb-mediated nonlinear O2–CO2 interactions were incorporated into a modified three-region blood–tissue exchange model using a highly efficient convection–diffusion algorithm,13 adding to it the erythrocytes as a convecting fourth region, with velocity higher than that of plasma. The Dash–Bassingthwaighte algorithms for the O2 and CO2 saturation curves also provide high computational efficiency since the Hill-type equations are invertible and therefore directly calculable during transients. The simultaneous transport and exchange of O2, CO2, , and H+ within the blood–tissue exchange system of the heart is analyzed through the use of a nonlinear four-region axially distributed convection-diffusion-permeation-reaction-binding model. Temperature and 2,3-DPG are assumed to be in steady state. The model accounts for the (i) convection in vascular region, axial diffusion in vascular and extra-vascular regions, and permeation through capillary and cell membranes, (ii) CO2 kinetics and buffering in blood and tissue, (iii) nonlinear competitive binding of O2 and CO2 with Hb, including nonlinear O2–CO2 interactions with Hb inside the red blood cells, (iv) myoglobin-facilitated transport of O2 inside the parenchymal cells, and (v) O2 consumption and CO2 production inside the parenchymal cells through cytochrome-c oxidase reaction obeying the Michaelis–Menten kinetics and respiratory quotient.
MATHEMATICAL FORMULATION OF THE MODEL
Blood–Tissue Exchange Unit and Nomenclature
The configuration of the blood–tissue exchange (BTEX) unit for the present study of oxygen (O2), carbon dioxide (CO2), bicarbonate ( ), and hydrogen ion (H+) transport and exchange in the heart is similar to the geometry of a classical Krogh cylinder model, e.g., see Li et al.51 as illustrated in Fig. 1. The BTEX unit consists of four concentric regions: The red blood cells (RBC), plasma, interstitial fluid (ISF), and parenchymal cells. Convective flow is Fr (ml g−1 min−1), and is one-dimensional, not accounting directly for intravascular velocity profiles. These regions are separated by the membranes of RBC, capillary, and parenchymal cells, each of which is characterized by its permeability–surface area product, PS. Because the capillary–tissue exchange length, L, that of the BTEX unit, is almost 1 mm,6 the model uses partial differential equations7,9,11 to account for concentration gradients along the length. The anatomical volumes of these regions are denoted by Vrbc, Vpl, Visf, and Vpc (units ml g−1), their fractional water spaces by Wrbc, Wpl, Wisf, and Wpc (unitless), and corresponding volumes of distribution by , and , which are the anatomical volumes times their fractional water spaces, e.g. .
FIGURE 1.

Schematic diagram of an axially distributed four-region blood–tissue exchange model for convection, diffusion, permeation, reaction, and binding of O2, CO2, , and H+ transport and exchange in the heart. Endothelial cells are neglected. For the four species, there are 4 four-region models in parallel. Consumption of O2 and production of CO2 occurs only in parenchymal cells, ignoring oxygenases elsewhere. Parameter values are shown in Table 1.
The radial diffusion (perpendicular to the capillary length) of a species (O2, CO2, , or H+) within a region (RBC, plasma, ISF, or parenchymal cells) is treated as if instantaneous because the radial diffusion distances are only a few microns (maximum of about 8 microns for half intercapillary distances in the heart) and the relaxation times for radial gradients are very short, a few milliseconds, compared to the average capillary transit times of a second or so.9 This assumption is further justified, for the heart, by there usually being four capillaries around each myocyte. Additional evidence was found in experiments by Deussen and Bassingthwaighte27 in which oxygen was observed to be flow-limited in its exchange with tissue when oxygen consumption was blocked by cyanide in RBC-perfused rabbit hearts, thus illustrating that neither the set of membranes from RBC to mitochondria nor radial diffusion caused any hindrance to exchange (not reported in the Deussen and Bassingthwaighte,27 paper). Given the rapid dissipation of intracapillary radial concentration gradients, the RBC can be well represented as a central column of fluid surrounded by plasma, a situation mathematically similar to Hb being dispersed throughout the plasma.20,51 (This assumption fails at low hematocrits, Hct, as shown by Hellums36). The RBC and plasma move by plug flow with different velocities; RBC move faster than the plasma, being in the higher velocity central stream. Plasma has zero velocity at the capillary wall, but because the radial diffusion is so fast the velocity profile is considered uniform at the mean velocity of the fluid. This contrasts with arterial velocity profiles because the peak velocity is about 1.6 times the average velocity.5 The small vessel (capillary) hematocrits average perhaps three-fourth of large vessel hematocrits, a Fahraeus–Lindquist effect32 with RBC velocities being 30–50% higher than plasma velocities. The blood flow (Fbl) in the capillary is assumed to be steady, so the RBC and plasma flows (Frbc and Fpl) can be considered as constants. Fbl, Frbc, and Fpl are in units of ml min−1 (g of tissue)−1.
In the blood space (RBC and plasma), there is both convection and diffusion (axial dispersion). The axial dispersion within a region is characterized by a pseudo diffusion or dispersion coefficient D (units cm2 s−1). Dpl characterizes the overall axial dispersion in the plasma by the combined processes of molecular diffusion, axial velocity distribution, flow disturbances, eddy currents, and mixing accompanying RBC rotation. Thus, the value of Dpl is much higher than the coefficient of molecular diffusion in the plasma. It is about 1 × 10⁻⁴ cm2 s−1 for O2.51 We consider it to be approximately the same for CO2, , and H+. Drbc characterizes the overall axial dispersion of RBC (as RBC are suspended particles in the plasma) via all the above processes, except that axial molecular diffusion of Hb is negligible. Thus, Drbc is about 5 to 10 × 10−5 cm2 s−1.51 The dispersion coefficient of a solute species within RBC is considered to have the same dispersion coefficient as RBC. The axial transport (along the capillary length, L) of a species in the extra-vascular region (ISF and parenchymal cells) is due to axial molecular diffusion dissipating any concentration gradients, and its effect on the shapes of concentration–time curves is augmented by irregularity in the alignments of the capillaries in sets of neighboring BTEX units.
Offset positioning of starting and ending points of neighboring capillaries results not only in heterogeneity of axial diffusion distances, reducing the effective lengths and reducing the axial concentration gradients,16,17 but also allows tracer solutes to take a short path from near the entrance of one capillary to the exit region of another, having quantitatively the same effect as enhanced extra-vascular axial diffusion. Accordingly, tracer water dilution curves show a small amount of diffusional shunting from inflow to outflow.8 To account for the heterogeneity in D/L, values of Disf and Dpc are higher than the normal intra-myocardial diffusion coefficients.56,64 Following the method of Safford et al.57 for serial/parallel diffusion through and around cells and accounting for the heterogeneity in D/L, we set the values for dispersion coefficients Disf and Dpc for all small solutes to 1 × 10⁻⁴ cm2 s−1.27,51 The dispersion smooths axial gradients in each region but does not influence estimation of O2 consumption rates.
The transmembrane transport (permeation) of a species across the membranes is assumed to be passive and is characterized by the permeability surface area product parameters PS (units ml min−1 g−1), i.e., the product of barrier permeability, P (cm min−1), and surface area, S (cm2 g−1). The PS is the barrier conductance for the solute: Permeability P is a diffusion coefficient in the barrier material Dm divided by the barrier thickness dm (i.e., P = Dm/dm). Solute species dissolving in the phospholipid bilayer have high Ps. The permeation of occurs through the band-3 anion transporter and that of H+ through the proton channels, thus their PSs are about an order of magnitude lower than those for dissolved gases such as O2 and CO2 (see Table 1 for values), and yet are still so high that the barrier has almost no influence on the kinetics of tracer transport. (However, the transport of CO2 is slowed when carbonic anhydrase is inhibited, not because of a change in membrane PS, but because of slow transformation from bicarbonate to CO2, the form in which most of the flux occurs.)
TABLE 1.
Representative values of parameters used in model simulation (for more description on a particular parameter, see the appropriate running text).
| Symbol | Definition | Value | Unit | Ref. | |
|---|---|---|---|---|---|
| αO2 | Solubility of O2 in water at body temperature | 1.46 × 10⁻⁶ | M mmHg−1 PO2) | 35 | |
| αCO2 | Solubility of CO2 in water at body temperature | 3.27 × 10⁻⁵ | M mmHg−1 PCO2) | 2 | |
| βrbc | Buffering capacity in RBC | 54 × 10−3 | M pH−1 unit | 41,58 | |
| βpl | Buffering capacity in plasma | 6 × 10⁻³ | M pH−1 unit | 41,58 | |
| βisf | Buffering capacity in ISF | 24 × 10−3 | M pH−1 unit | * | |
| βpc | Buffering capacity in PC | 45 × 10−3 | M pH−1 unit | * | |
| CHbrbc | Concentration of Hb in the water space of RBC | 7.2 × 10⁻³ | M | 27, 51,* | |
| CMbpc | Concentration of Mb in the water space of PC | 0.5 × 10⁻³ | M | 27,51 | |
| sDr | Dispersion coefficient of species ‘s’ in region ‘r’ | 1 × 10⁻⁴ | cm2 s−1 | 17, 27, 51,* | |
| Fbl | Flow of blood | 1 | ml min−1 g−1 | 9,27,51 | |
| Frbc | Flow of RBC (Hct × Fbl) | 0.45 | ml min−1 g−1 | 51,* | |
| Fpl | Flow of plasma (Fbl − Frbc) | 0.55 | ml min−1 g−1 | 51,* | |
| Hct | Large-vessel hematocrit | 0.45 | ml ml−1 | 51 | |
| Hctcap | Capillary hematocrit [see Eq. (14d)] | 0.34 | ml ml−1 | 51,* | |
| kf1 | Modified rate constant in forward direction of CO2 hydration reaction ( ) | 0.12 | s−1 | 39, 40, 41,* | |
| kb1 | Modified rate constant in backward direction of CO2 hydration reaction ( ) | 162,000 | M−1 s−1 | 39, 40, 41,* | |
|
|
Ionization constant for H2CO3 | 5.5 × 10⁻⁴ | M | 39,40,41 | |
|
|
Equilibrium constant for hydration of CO2 ( ) | 1.35 × 10⁻³ | Unitless | * | |
| K1 | Equilibrium constant for the overall CO2 hydration reaction ( ) | 7.43 × 10⁻⁷ | M | 39, 40, 41,* | |
|
|
Ionization constant for HmNHCOOH | 1 × 10⁻⁶ | M | 1,41 | |
|
|
Equilibrium constant for uptake of CO2 by reduced hemoglobin ( ) | 29.5 | M−1 | * | |
| K2 | Equilibrium constant for the overall uptake of CO2 by reduced hemoglobin ( ) | 2.95 × 10⁻⁵ | Unitless | 1,41 | |
|
|
Ionization constant for O2HmNHCOOH | 1 × 10⁻⁶ | M | 1,41 | |
|
|
Equilibrium constant for uptake of CO2 by oxygenated hemoglobin ( ) | 25.1 | M−1 | * | |
| K3 | Equilibrium constant for the overall uptake of CO2 by oxygenated hemoglobin ( ) | 2.51 × 10⁻⁵ | Unitless | 1,41 | |
|
|
Proportionality equilibrium constant for uptake of O2 by hemoglobin [see Eq. (6)] | 202123 | M−1 | ||
|
|
Ionization constant for | 2.63 × 10⁻⁸ | M | 1 | |
|
|
Ionization constant for | 1.91 × 10⁻⁸ | M | 1 | |
| Km | Michaelis–Menten constant for cytochromic-c oxidation in PC | 7 × 10⁻⁷ | M | 17,31 | |
| Krbc | Catalytic factor in CO2 hydration reaction in RBC | 13,000 | Unitless | 39, 40, 41 | |
| Kpl | Catalytic factor in CO2 hydration reaction in plasma | 100 | Unitless | * | |
| Kisf | Catalytic factor in CO2 hydration reaction in ISF | 5000 | Unitless | * | |
| Kpc | Catalytic factor in CO2 hydration reaction in PC | 10,000 | Unitless | * | |
| L | Length of the capillary | 1 | mm | 6,9,27,51 | |
| n0 | Exponent on [O2]/[O2]S in expression for | 1.7 | Unitless | ||
| n1 | Exponent on [H+]S/[H+] in expression for | 1.06 | Unitless | ||
| n2 | Exponent on [CO2]S/[CO2] in expression for | 0.12 | Unitless | ||
| PO2,art | Standard O2 partial pressure in the arterial end | 100 | mmHg | 51, 58 | |
| PCO2,art | Standard CO2 partial pressure in the arterial end | 40 | mmHg | 58 | |
| pHpl,art | Standard pH level in plasma in the arterial end (pHpl,art = − log[H+]pl,art) | 7.4 | Unitless | 41,58 | |
| pHrbc,art | Standard pH level in RBC in the arterial end (pHrbc,art = − log[H+]rbc,art) | 7.24 | Unitless | 41,58 | |
|
|
Level of PO2 at which Hb is 50% saturated by O2 | 26.8 | mmHg | 22, 45, 66 | |
|
|
Level of PO2 at which Mb is 50% saturated by O2 | 2.39 | mmHg | 17,59,60 | |
| (o,c)PSrbc | Permeability surface area product of the RBC membrane for O2 and CO2 | 1000 | ml min−1 g−1 | 51 | |
| (o,c)PScap | Permeability surface area product of the capillary membrane for O2 and CO2 | 200 | ml min−1 g−1 | 51 | |
| (o,c)PSpc | Permeability surface area product of the PC membrane for O2 and CO2 | 2000 | ml min−1 g−1 | 51 | |
| (b,h)PSrbc | Permeability surface area product of the RBC membrane for and H+ | 100 | ml min−1 g−1 | * | |
| (b,h)PScap | Permeability surface area product of the capillary membrane for and H+ | 20 | ml min−1 g−1 | * | |
| (b,h)PSpc | Permeability surface area product of the PC membrane for and H+ | 200 | ml min−1 g−1 | * | |
| RQ | Respiratory quotient (rate CO2 production divided by rate O2 consumption) | 0.8 | Unitless | 44,58 | |
| Rrbc | Gibbs–Donnan ratio across the RBC membrane | 0.69 | Unitless | 41,58,66 | |
| Rcap | Gibbs–Donnan ratio across the capillary membrane | 0.63 | Unitless | * | |
| Rpc | Gibbs–Donnan ratio across the PC membrane | 0.79 | Unitless | * | |
| Rvel | Ratio of RBC to plasma velocity | 1.6 | Unitless | 6,32,51 | |
| Vmax | Maximum rate of cytochromic oxidation in PC | 2.5 × 10⁻⁶ | mol min−1 g−1 | 17,51 | |
| Vcap | Anatomical volume of capillary | 0.07 | ml g−1 | 6,9,27,51 | |
| Vrbc | Anatomical volume of RBC (Hctcap × Vcap) | 0.024 | ml g−1 | 51,* | |
| Vpl | Anatomical volume of plasma (Vcap − Vrbc) | 0.046 | ml g−1 | 51,* | |
| Visf | Anatomical volume of ISF | 0.2 | ml g−1 | 27,51 | |
| Vpc | Anatomical volume of PC | 0.7 | ml g−1 | 27,51 | |
|
|
Volume of distribution (water space) in a region ‘r’ | Vr × Wr | ml g−1 | 51,* | |
| Wrbc | Fractional water space of RBC | 0.72 | ml ml−1 | 51,* | |
| Wpl | Fractional water space of plasma | 0.94 | ml ml−1 | 51 | |
| Wisf | Fractional water space of ISF | 0.92 | ml ml−1 | 51,* | |
| Wpc | Fractional water space of PC | 0.8 | ml ml−1 | 51 |
Note. Left superscripts denote substrate, s; oxygen, o; carbon dioxide, c; hydrogen ion, h; and bicarbonate, b.
Calculated or correlated from the data in the literature.
The consumption of O2 and production of CO2 occurs only in parenchymal cells, ignoring oxygenases elsewhere, and is characterized by the “gulosity” parameter ∘Gpc (units ml min−1 g−1); ∘Gpc is dependent on intracellular oxygen concentration, assuming Michaelis–Menten kinetics, which is effectively zero-order when PO2 is high compared to its Km (which is the case usually) and first-order when O2 concentration is low. The CO2 is produced inside the parenchymal cells from oxidative metabolism of glucose, proteins, and fatty acids. The ratio of the rate of CO2 production to the rate of O2 consumption is the respiratory quotient RQ: it is 1.0 for glucose metabolism, 0.8 for protein metabolism, and 0.7 for fat metabolism. In myocardium, RQ is normally around 0.8, indicating more fat usage than glucose.
The formation of is governed by the CO2 hydration reaction which, in aqueous solution, is slow. However, in RBC, ISF, and parenchymal cells this reaction is facilitated by the enzyme carbonic anhydrase in cytosol and on the membranes. The membranes of RBC, capillary, and parenchymal cells are fairly permeable to (through the band-3 transporter), allowing dissipation of gradients. Charge neutrality is attained by the diffusion of chloride ions (Cl−) from a region of higher negative charge to a region of higher positive charge (the chloride shift) until the Gibbs–Donnan electrochemical equilibrium conditions are reached39–41,58:
| (1a) |
| (1b) |
| (1c) |
where Rrbc, Rcap, and Rpc (unitless) are the Gibbs–Donnan ratios across the membranes of RBC, capillary, and parenchymal cells. Under standard physiological conditions, pH in plasma, RBC, ISF, and parenchymal cells is about 7.4, 7.24, 7.2, and 7.1, respectively. Thus, Rrbc = 0.69, Rcap = 0.63, and Rpc = 0.79. The transport of Cl− is not calculated in the model, but its regional equilibrium concentrations can be calculated from these equations.
Dynamic Mass Balance Equations for O2, CO2, , and H+
The governing equations for each of the four species (O2, CO2, , and H+) in each of the four regions (RBC, plasma, ISF, and parenchymal cells) of the BTEX unit are formulated by considering the detailed biophysical and biochemical phenomena discussed above with the constraint of mass conservation. The molar concentrations C(x, t), are functions of time (t) and axial distance (x) along the capillary of length (L, cm).
The nomenclature is based on that approved by the American Physiological Society10: sCr and sDr denote the concentration and axial dispersion coefficient of a species “s” in a region “r”; sP Sm denotes the permeability surface area product for a species, s, across a membrane, m; s is one of the species O2, CO2, , and H+ (pre-superscripted as o, c, b, and h), r is one of the regions RBC, plasma, ISF, and parenchymal cells (subscripted as rbc, pl, isf, and pc), and m is one of the membranes RBC, capillary, and parenchymal cells (subscripted as rbc, cap, and pc). Table 1 lists parameters, representative values, and units.
Equations for Oxygen
Oxygen is transported in the plasma and ISF only in a dissolved form. However, in RBC and parenchymal cells it is transported in the dissolved form as well as in combination with Hb and myoglobin (Mb) as oxyhemoglobin (HbO2) and oxymyoglobin (MbO2). The dissolved O2 in RBC and parenchymal cells is assumed to be in constant equilibrium with the HbO2 and MbO2 assuming that the kinetics of O2 binding to Hb and Mb are fast compared with those of the transport processes. See Dash and Bassingthwaighte26 for detailed reaction schema and kinetic parameters. The equations which follow use the equilibrium constants for the binding. The regional transport equations for convection, diffusion, permeation, and reaction are
| (2a) |
| (2b) |
| (2c) |
| (2d) |
where CHbO2 and CMbO2 are the concentrations of hemoglobin- and myoglobin-bound O2 in RBC and parenchymal cells. The concentration of dissolved O2 in a region r, ∘Cr, is related to the partial pressure of O2 in that region, PO2,r, by Henry’s law: ∘Cr = αO2 × PO2,r, where αO2 is the solubility of O2 in water.
Equations for CHbO2 and CMbO2
One mole of Hb can bind with four moles of O2 and one mole of Mb can bind with one mole of O2, so the concentrations of Hb- and Mb-bound O2(CHbO2 and CMbO2) can be calculated from the O2 saturations of Hb and Mb (SHbO2 and SMbO2) using
| (3) |
where CHbrbc and CMbpc are the concentrations of Hb and Mb in the water spaces of RBC and parenchymal cells. With an Hb content of 0.333 g ml−1 RBC (0.15 g ml−1 blood, Hct = 0.45), an RBC water fraction of 0.72 ml ml−1 RBC, and MWHb = 64, 458 for the tetramer, then CHbrbc = 7.2 mM. Myoglobin concentrations in myocardial cell vary widely among species, but this example model used those in rabbit hearts, an Mb content of 0.0067 g ml−1 cell (0.005 g ml−1 tissue and cell volume fraction in tissue of 0.75 ml ml−1 tissue), a myocyte water fraction of 0.8 ml ml−1 cell, and MWMb = 16, 800, gives CMbpc = 0.5 mM.
Equations for SHbO2 and SMbO2
Of the several mathematical formulas available for describing the relationship of PO2 to the O2 saturation of Hb and Mb, SHbO2 and SMbO2 (see Popel54 for a review), the modified Hill equation for SHbO2 of Dash and Bassingthwaighte26 allows the effects of intra-RBC pH, PCO2, 2,3-DPG and temperature as well as the nonlinear O2–CO2 interactions to be incorporated into the model for simultaneous O2 and CO2 transport and exchange during transients. The expressions for SHbO2 and SMbO2 are
| (4) |
where KHbO2 (with units M−1) is a function of PO2, PCO2, and pH, or equivalently ∘Crbc,c Crbc, and hCrbc, and KMbO2 (M−1) are given by
| (5) |
and (with units M−1) is given by
| (6) |
The equilibrium constants , and and the empirical exponents n0, n1, and n2 are as defined in Dash and Bassingthwaighte26 (see Table 1 for values). The subscript S refers to values in standard physiological conditions at 37°C. The concentration of 2,3-DPG is assumed fixed at 4.65 mM. is the value of PO2 at which Mb is 50% saturated by O2; 59,60; the for human hemoglobin is about 26.8 mmHg.
Michaelis–Menten Kinetics for Oxygen Consumption
The consumption of oxygen is facilitated by the mitochondrial cytochrome-c oxidase reaction and regulated via the availability of substrates (ADP, Pi, NADH, and FADH) to mitochondrial electron transport chain. The oxygen consumption in Eq. (2d) is the product of a “gulosity” ∘Gpc (with units of a clearance or flow) times the concentration, with ∘Gpc for MM kinetics being
| (7) |
where Vmax (mol min−1 g−1) is the maximal rate of O2 consumption and Km is the Michaelis constant. Under standard physiological conditions, Vmax is about 2.5 × 10⁻⁶ mol min−1 g−1 and Km about 7 × 10⁻⁷ M (which corresponds to about 0.5 mmHg in the units of partial pressure as αO2 = 1.46 × 10⁻⁶ M mmHg−1.17,31,51 The estimate of Km about 0.7 μM is a functional one that makes excellent sense relative to myoglobin about 2.39 mmHg. Furthermore, the Km value from in vitro measurements on isolated mitochondria are generally found to be 0.5–1 Torr Po2, about 0.7 μM [O2]. A Km value of 0.7 μM is also in agreement with the “apparent” Km value of 0.8 μM estimated by Korzeniewski and Zoladz49 for the cytochrome-c oxidase reaction.
Equations for Carbon Dioxide
CO2 along with other metabolic by-products such as water (H2O) has a positive net flux from tissue to effluent blood. It undergoes reactions during its transport and exchange process.26,37 In all regions, CO2 is transported in both dissolved form and as bicarbonate ions, . In RBC, it is also in combination with hemoglobin as carbamino hemoglobin, HbCO2, which is assumed to be in constant equilibrium with the dissolved CO2. The partial differential equations for CO2 in the four regions are
| (8a) |
| (8b) |
| (8c) |
| (8d) |
where Krbc, Kpl, Kisf, and Kpc (unitless) are the catalytic factors for CO2 hydration reaction due to the presence of enzyme carbonic anhydrase in the four regions of the BTEX unit; Kpl is small, perhaps less than 100, but Krbc, Kisf, and Kpc are of the order of 10,000; also and . These parameters are obtained from Hill et al.,39–41 Salathe et al.,58 and Huang and Hellums.44 The last term in each of the equations represents the net rate of transformation of CO2 to or from bicarbonate. In Eq. (8d), the rate of production of CO2 inside the parenchymal cells is expressed as the rate of consumption of O2 times the respiratory quotient, RQ. The concentration of dissolved CO2 in a region r, cCr, is related to the partial pressure of CO2 in that region, PCO2,r , by Henry’s law: cCr = αCO2 × PCO2,r , where αCO2 is the solubility of CO2 in water. At body temperature (T = 37°C), αCO2 = 3.27 × 10⁻⁵ M mmHg−1.
Equations for CHbCO2 and SHbCO2
As one mole of Hb binds with 4 moles of CO2, the concentration of Hb-bound CO2 (CHbCO2) can be calculated from CO2 saturation of hemoglobin (SHbCO2) using the formula:
| (9) |
In present notations, the equation for SHbCO2 from26 is given by
| (10) |
where KHbCO2 (a function of PO2, PCO2, and pH, or ∘Crbc, cCrbc, and hCrbc) is given by
| (11) |
Thus, Eq. (10) for carbon dioxide and Eq. (4) for oxygen can both be calculated directly from the ambient concentrations of the free unbound solutes at each instant in time, critical to obtaining rapid computation. Equation (6) defines .
Equations for Bicarbonate Ions
The amount of CO2 transported as bicarbonate ions ( ) is governed by the CO2 hydration reaction. At equilibrium or steady state, the exchange of through the band-3 anion channel is governed by the Gibbs–Donnan electrochemical equilibrium conditions: Eqs. (1a)–(1c). The dynamics of transport and exchange of , indicated by the left superscript b, in the four regions are given by
| (12a) |
| (12b) |
| (12c) |
| (12d) |
As for the CO2 equations, the last terms in Eqs. (12a)–(12d) represent the net rate of formation of , and are the same as the last terms in Eqs. (8a)–8d.
Equations for Hydrogen Ions and Acid–Base Balance
Because the reactions of O2 and CO2 with Hb, Mb, and are influenced greatly by variation in pH,26 the transport and exchange of hydrogen ions (H+) must be incorporated into any model for O2, CO2, and . Variation in pH due to the CO2 hydration reaction is controlled by the buffering action of bicarbonate ( ) in both blood and tissue. It is characterized by the buffering capacity parameter, β, which is the amount of base added, or equivalently acid removed, per unit pH change: β = +Δ[base]/ΔpH = −Δ [acid]/ΔpH. Here, the acid is H2CO3 (carbonic acid) and the base is . As for , the exchange of H+ through the band-3 proton channels at equilibrium or steady state is governed by the Gibbs–Donnan electrochemical equilibrium conditions: Eqs. (1a)–(1c). The four-region equations are
| (13a) |
| (13b) |
| (13c) |
| (13d) |
where βrbc, βpl, βisf, and βpc (with units M pH−1 unit) are the buffering capacities in the four regions of the BTEX unit; βpl is small, but βrbc, βisf, and βpc are high; we choose βpl = 6 mM pH−1 unit, βrbc = 54 mM pH−1 unit, βisf = 24 mM pH−1 unit, and βpc = 45 mM pH−1 unit from Hill et al.39–41 Salathe et al.,58 and Huang and Hellums.44
Equations for Capillary Hematocrits and RBC and Plasma Volumes
The capillary hematocrits (Hctcap) are lower than the large-vessel hematocrits (Hct) by the Fahraeus–Lindquist effect3,32,43 and consequently the RBC velocity (νrbc) is higher than the plasma velocity (νpl), and the erythrocytes’ mean transit times through the coronary system is shorter than that of plasma.9 The result is a “red cell carriage effect”33 whereby solutes carried within RBCs travel faster than plasma proteins. In this model, Hct, blood flow (Fbl), capillary volume (Vcap), and the ratio of RBC to plasma velocity (Rvel) are known. The standard values for myocardial blood flow are Hct = 0.45, Fbl = 1 ml min−1g−1, Vcap = 0.07 ml g−1, and Rvel = 1.6. The Hctcap, RBC and plasma flows (Frbc and Fpl), their volumes (Vrbc and Vpl), and their velocities (νrbc and νpl) are calculated through the following equations,51 the values of which are presented in Table 1 for standard physiological conditions:
| (14a) |
| (14b) |
| (14c) |
| (14d) |
The water fractions of various spaces are given by Wpl = 0.94, Wrbc = 0.72, Wisf = 0.92, Wpc = 0.8.51 The anatomical volumes of ISF and parenchymal cells are given by Visf = 0.2 ml g−1 and Vpc = 0.7 ml g−1, so the water spaces or volumes of distribution of these two regions are about 0.18 and 0.56 ml g−1.9
Steady-State Extraction and the Consumption Rate of Oxygen
The fractional steady-state extraction of O2(Ess) and its consumption rate (MRO2) can be obtained from total O2 content in the arterial and venous blood (∘CTot Art): and ∘CTot Ven):
| (15) |
where
| (16) |
The MRO2 in Eq. (15) equals the integral of ∘Gpc∘Cpc over the axial length L in Eq. (2d).
Computational Methods
To obtain the solutions for concentration profiles, one must prescribe initial and boundary conditions for the governing partial differential equations (2a)–(2d), (8a)– (8d), (12a)–(12d), and (13a)–(13d). For equilibrium/steady-state solutions, the initial conditions are chosen arbitrarily, sCr(x, t) = sCr0(x). The boundary conditions at the entrance to the capillary are defined by Robin or Danckwerts conditions such that the convective inflow is balanced by the diffusive upstream efflux into the inflow:
| (17) |
where vr is the velocity, F • L/Vr, and D is the diffusion coefficient, as applied to both RBC and plasma regions, and where sCin is the concentration of the species ‘s’ (O2, CO2, , and H+) in the inflowing arterial blood, where plasma and RBC solutes are assumed to have equilibrated prior to entry into the exchange region at x = 0. These can be computed from standard arterial PO2, PCO2, and pH (see Table 1). The concentration of at the arterial end is obtained using the Henderson–Hasselbalch equation and Gibbs–Donnan electrochemical equilibrium condition.26
At the downstream end of the capillary and at both the upstream and downstream ends in all the stagnant extravascular regions, the boundaries are reflecting, meaning that the derivatives are zero so that there is no flux across the boundary:
| (18) |
The model is coded and run in the JSim model simulation environment23 and is solved by invoking either the LSFEA (Lagrangian Sliding Fluid Element Algorithm,13) or TOMS690 Chebychev Polynomial Algorithm19 or TOMS731 Moving-Grid Algorithm21 from our library of numerical PDE solvers. LSFEA is the fastest of these, even though accurate solutions at the inlet require a finer grid or a larger number of axial segments than do the TOMS algorithms.13 In contrast, TOMS731 is considerably faster than TOMS690, and the solutions are equally accurate. All the results presented in this paper were obtained using the TOMS731 solver with 51 axial grid points. The time step of integration is adaptively controlled by the solver. The solver computes the concentrations of total O2 in RBC and parenchymal cells (oCrbc + CHbO2 and oCpc + CMbO2) and total CO2 in RBC (cCrbc + CHbCO2) at each axial grid point at each time point. The concentrations of free O2 in RBC and parenchymal cells (oCrbc and oCpc) and free CO2 in RBC (cCrbc) are then obtained iteratively from the coupled Eqs. (4), (5), (9), and (10).
This model’s capabilities extend those of the previous models,20,27,51,55 and it is computationally fast in spite of its comprehensive nature, so this model is our preferred vehicle for data analysis for oxygen-related studies, for example for 15O-oxygen studies using positron emission tomography where many regions of interest are analyzed within an organ. The model is available for download and public use from the Physiome website at: http:/nsr.bioeng.washington.edu/jsim/models/webmodel/NSR/Exchange_O2_CO2_HCO3_and_H/
RESULTS: MODEL BEHAVIOR AND FUNCTIONALITY
The Default Parameter Set
The model requires many parameters, and while there are many sources for partial information, it has not been possible to find a consistent set of values in the literature. Consequently, a self-consistent set of parameter values were chosen to represent realistic normal physiological conditions; as listed in Table 1 with references. Where the value of a parameter was not available, known relationships to other parameters (correlation) were used to constrain the missing parameter value. When applying the model to data analysis or simply making predictions from the model, the aim is to fix the values for as many parameters as possible, and thereby to minimize the degrees of freedom for data fitting or exploring behavior under varying physiological conditions. Known physicochemical parameters can be fixed. Anatomic parameters can often be fixed or markedly constrained using data coming from other experiments than the one being analyzed; parameters for which there is low sensitivity, e.g., cell volumes and water spaces, fit into this category.65 In fitting the model to actual experimental data (e.g., tracer-dilution outflow curves following the injection of tracer-labeled 15O-oxygen in PET imaging studies) to estimate the physiological parameters of particular interest, oxygen consumption, the RQ, or response times for a change in metabolism, all but a few parameters need to be determined by optimization to fit data.27,51
With Table 1’s parameter values, the effects of blood flow, hematocrits, arterial PO2, and oxygen consumption on the concentration profiles can be studied by changing parameter values one at a time, a kind of sensitivity analysis. The results presented later in Figs. 2–6, give a portrayal of the model functions and the model’s utility in exploring physiological interventions.
FIGURE 2.

The simulated steady-state axial profiles of O2, CO2, , and H+ in the four regions of the BTEX unit at standard physiological conditions for which the parameter values are presented in Table 1. Axial dispersion coefficients (sDr) for all species in all regions were assigned the value 1 × 10⁻⁴ cm2 s−1. Vmax = 2.5 μmol min−1g−1 and Km = 7.7 × 10⁻⁷ M.
FIGURE 6.

Effect of varying O2 consumption Vmax on the steady-state axial profile of H+ ions (pH) in the four regions of the BTEX unit. Inflow pHrbc and PHpl were fixed at 7.24 and 7.4. Axial dispersion coefficients were fixed at 10−4 cm2 s−1. Fbl = 1 ml min−1 g−1.
Axial Profiles at Standard Physiological Conditions
The computed steady-state axial profiles for O2, CO2, , and H+ in the four regions of the blood–tissue exchange unit using the standard parameter values presented in Table 1 are shown in Fig. 2. The local ∘Gpc at each x is defined by Eq. (7). Oxygen PO2 (left upper) decays along the capillary, while the concentrations of metabolic products are all rising, PCO2 (right upper), bicarbonate [ ] (left lower), and H+ ion (right lower), in all four regions (RBC, plasma, ISF, and parenchymal cells). The arterial inflow concentrations were constant at PO2 = 100 mmHg, PCO2 = 40 mmHg, pHpl = 7.4, pHrbc = 7.24, , and . In the venous outflow, the computed solutions were PO2 = 39 mmHg, PCO2 = 46.5 mmHg, pHpl = 7.36, pHrbc = 7.2, , and . These simulated results are in good agreement with the literature and standard physiological observations (e.g., see Huang and Hellums37 and Hellums et al.44).
Figure 2 shows steep gradients in O2, more or less exponentially decaying, while the increasing concentrations in CO2, , and H+ show considerably smaller gradients because they are heavily buffered. In contrast to the exponential decay in dissolved free O2 concentration, the Hb-bound O2 concentration decays very nearly linearly from a saturation, SHbO2 = 0.98 at the entrance to SHbO2 = 0.74 at the exit. This is due to the nonlinear (sigmoid) nature of the oxyhemoglobin dissociation curve and nonlinear–nonlinear interaction of sigmoid–exponential curves. The trend in Hb-bound CO2 concentration was opposite, though HbCO2 increased only slightly along the capillary length. The steady-state O2 extraction at the venous end was 25.4%. The average intracellular O2 consumption, MRO2, was under these conditions equal to Vmax, 2.5 μ mol min−1g−1, so the intracellular O2 level was sufficient to saturate the cytochrome-c and to put cellular respiration into the zero-order mode, nearly constant at all positions along the BTEX unit. The [O2] in RBC and plasma as well as in ISF and parenchymal cells were close to each other, indicating the RBC and plasma as well as ISF and parenchymal cells regions were equilibrated with O2. However, even with ∘P Scap at the rather high value of 200 ml g−1 min−1 there was an [O2] gradient across the capillary wall, which no experimental evidence has either corroborated or contradicted, suggesting that this permeability is underestimated. In contrast, [CO2] was in close equilibrium in all four regions of the blood–tissue exchange unit (except near the arterial end), as there was negligible gradient in [CO2] across the membranes. The [ ] and [H+] were found to vary negligibly in axial direction (probably due to the buffering action of ) and were in equilibrium in different regions obeying the Gibbs–Donnan electrochemical equilibrium conditions given by Eqs. (1a)–(1c). The pH inside the parenchymal cells, driven by the production of CO2 in this oversimplified model of metabolism, is too low compared to observed pHs in normal myocardium, simply because there is no representation of H+ ion consumption by the processes of oxidative metabolism in the model. This lack reduces all regional pHs compared to those for a fully-developed metabolic model.
Effect of Varying Blood Flow, Hematocrit, and Arterial PO2 on Axial Profiles
The delivery of O2 to the tissue is determined mainly by three factors: Capillary blood flow, hematocrit, and arterial PO2. These also affect the axial profiles of O2, CO2, , and H+. All these have similar qualitative effects and can be explained from the behavior of one of the factors. The effect of varying capillary blood flow (Fbl) on steady-state axial profiles of O2, CO2, and H+ in the four regions of the blood–tissue exchange unit are shown in Figs. 3 and 4. Other parameters, including the conditions at the arterial end, are fixed at the standard physiological values presented in Table 1. The steady-state axial profiles of (not shown) can be deduced from the steady-state axial profiles of PCO2 and pH (using the Henderson–Hasselbalch equation). Figure 3 actually shows the steady-state axial variations of PO2 and PCO2 in RBC and parenchymal cells for Fbl = 1.5, 1.0, 0.5 ml min−1 g−1. The profiles of PO2 and PCO2 in plasma and ISF are not included in these plots because these profiles almost match with those in RBC and parenchymal cells. Figure 4 shows the steady-state axial profile of pH in RBC, plasma, ISF, and parenchymal cells for the same three values of Fbl.
FIGURE 3.

Effect of varying capillary blood flow (Fbl) on steady-state axial profiles of O2 and CO2 (PO2 and PCO2) in RBC and parenchymal cell (PC) regions of the BTEX unit. Inflow PO2 and PCO2 were fixed at 100 and 40 mmHg. Axial dispersion coefficients were fixed at 10−4 cm2 s−1. Vmax = 2.5 μmol min−1 g−1.
FIGURE 4.

Effect of varying capillary blood flow (Fbl) on the steady-state axial profile of H+ ions (pH) in the four regions of the BTEX unit. Inflow pHrbc and pHpl were fixed at 7.24 and 7.4. Axial dispersion coefficients were fixed at 10−4 cm2 s−1. Vmax =2.5 μmol min−1 g−1.
It is seen that as the capillary blood flow (perfusion or O2 supply) decreases with the O2 consumption, while Vmax (O2 demand) remains constant, the concentration of O2 in the blood–tissue exchange unit decreases. However, the PO2 does not go to zero anywhere. With arterial PO2 = 100 mmHg, Vmax = 2.5 μ mol min−1 g−1, and Fbl = 1.5, 1.0, 0.5 ml min−1 g−1, we see that the venous PO2 is 46, 39, 27 mmHg and O2 extraction is 17.3, 25.4, 48.1%. A decrease in blood flow also results in an increase in the concentrations of CO2, H+, and in the system. Thus, a severe blood flow decrease (ischemia) can result in acute hypoxia and acidosis (lower pH) inside the parenchymal cells and affect the normal cellular function.
Effect of Varying Oxygen Consumption on Axial Profiles
The effect of varying O2 consumption Vmax on steady-state axial profiles O2, CO2, and H+ in the four regions of the blood–tissue exchange unit is shown in Figs. 5 and 6. Other parameters, including the conditions at the arterial end, are fixed at the standard physiological values presented in Table 1. Figure 5 shows the steady-state axial variations of PO2 and PCO2 in RBC and parenchymal cells for Vmax = 2.5, 5.0, 7.5 μmol min−1 g−1. Figure 6 shows the steady-state axial variation of pH in RBC, plasma, ISF, and parenchymal cells for the same three values of Vmax. These results are consistent with the results in Figs. 3 and 4, i.e., the increasing O2 consumption Vmax (O2 demand) has similar qualitative effects on the species concentration profiles as does decreasing capillary blood flow (perfusion or O2 supply). Both cause decreases in the regional O2 concentration and increases in the regional concentrations of CO2, H+, and in the system. Quantitatively the differences between the regional concentration profiles are larger with varying Vmax than with varying Fbl, using the same relative increments, comparing Fig. 6 with Fig. 4. With arterial PO2 = 100 mmHg, Fbl = 1 ml min−1 g−1, and Vmax = 2.5, 5.0, 7.5 μmol min−1 g−1, the venous PO2 is seen to vary from 39 to 26 to 20 mmHg and O2 extraction is seen to vary from 25.4 to 50.2 to 66.8%. With Vmax = 5.0 μmol min−1 g−1 the downstream end of the parenchymal cells has a PO2 of 10 mmHg and pH of 7.03. With Vmax = 7.5 μmol min−1 g−1, the downstream half of the parenchymal cells has a PO2 < 5 mmHg and pH of 7.01. Therefore, when there is an increasing energy demand and O2 consumption (associated with exercise), unless the capillary blood flow and O2 supply increase to meet the energy demand, the normal cellular function will be severely affected.
FIGURE 5.
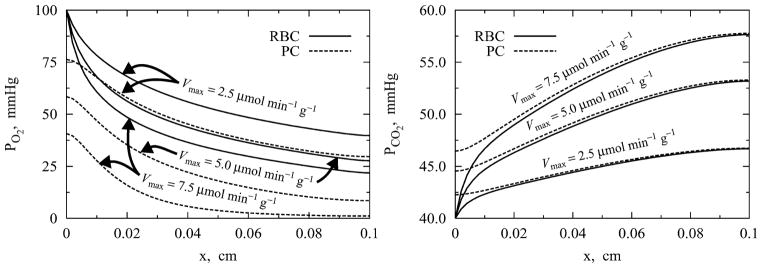
Effect of varying O2 consumption Vmax on steady-state axial profiles of O2 and CO2 (PO2 and PCO2) in RBC and parenchymal cell (PC) regions of the BTEX unit. Inflow PO2 and PCO2 were fixed at 100 and 40 mmHg. Axial dispersion coefficients were fixed at 10−4 cm2 s−1. Fbl = 1 ml min−1 g−1.
It may be noted here that in acute situations with very low blood flow (Fbl) or very high oxygen consumption (Vmax) the blood PO2 can become very low (below 20 mmHg) in the downstream end of the blood–tissue exchange region, and the HbO2 saturation will fall below 30%. Our model for HbO2 saturation26 begins to lose accuracy below SHbO = 30%, so the computed solutions are less accurate in this regime of low PO2.
DISCUSSION AND CONCLUDING REMARKS
Potential Applications
This model is the start of, or a part of, whole-body metabolic modeling for systems physiology. While it encompasses only the simultaneous transport and exchanges of O2, CO2, , and H+ in the microcirculation, it links these processes to the metabolism of O2 and therefore to the whole realm of intracellular metabolism. Augmenting such a model by adding biochemical systems for intermediary metabolism, oxidative phosphorylation, NAD/NADH reactions, the tricarboxylic acid cycle, and hydrogen balance will improve the characterization of spatial profiles and representation of kinetics during transients. Through whole-body representation of multiple organs, such a model can be expanded into a model for glucose metabolism, for example.
The model itself is worthwhile as a basic vehicle for data analysis for whole-organ studies by multiple indicator dilution techniques, by positron emission tomographic or NMR image sequences. For application to BOLD (blood oxygen level dependent) NMR, one has only to pull out the signal for Hb rather than HbO [where HbO really represents Hb(O2)4]. As a component of a model further developed to include mitochondrial oxygen and carbon dioxide kinetics, and linked into a whole-organ model by adding the arterial and venous transport systems, one will be able to evaluate the basis for the delays in responses to changes in oxygen utilization with changes in cardiac contractile performance. This has been a puzzle: “Is it mitochondrial delay or is it merely a transport time?”
What is modeled here has been well known for years, but the complexity of the problem and the slowness of computation inhibited developing full sets of equations for practical applications. The model is free for general use and available for download. Investigators anywhere can explore the model behavior with or without delving into the code by going to the website for JSim.23 This fits with current trends toward open-source software and widespread collaboration in research. Models including the O2–CO2 interactions were presented by Huang and Hellums44 and Ye et al.,67 but for different reasons neither of their approaches lends itself to the quantitative analysis of experimental data from transients in venous PO2 or tracer 15O-oxygen in positron emission tomography (PET) imaging studies. The model of44 accounts for radial diffusion, but is computationally slow, making it impractical for routine fitting of experimental time courses from PET imaging studies by automated iterative parameter adjustment optimization. The model of Ye et al.67 was compartmental, thereby failing to account for axial gradients along the capillary, and therefore lacking the critical narrow impulse response required to fit high-resolution data of the sort analyzed by Deussen and Bassingthwaighte27 and Li et al.51 The current model solves the first of these problems by an approximation (for radial diffusion) and by using highly efficient computational algorithms for Hb/HbO and for the blood–tissue exchange, and the second by using very efficient partial rather than ordinary differential equations.
This general model can readily be applied to arterioles and venules and to other organs (e.g., the lungs) for gaining insight into the processes of O2 and CO2 transport and exchange as well as acid–base regulation along the length of the microcirculatory exchange regions from arterioles to venules.
Improvements Over Prior Models
The current model improves our previous blood–tissue exchange models of O2 transport and metabolism20,27,51 for it uses the analytically invertible expressions of Dash and Bassingthwaighte26 for oxyhemoglobin (HbO2) and carbamino hemoglobin (HbCO2) dissociation curves which explicitly account for the effects of PO2, PCO2, pH, and nonlinear O2–CO2 interactions in computing PO2 and PCO2 from the total O2 and CO2 concentrations (∘Crbc + CHbO2 and cCrbc + CHbCO2) in RBC at each axial and time grid point. This reduces the computation time by about a factor of 20 compared to solving the Adair-type equations by iteration.26
Computational efficiency is a major issue in analyzing the data from PET imaging studies of tracer-labeled 15O-oxygen because of the broad heterogeneity of flows and metabolism in the heart (e.g., see King et al.,47 Caldwell et al.,24 reviews by Bassingthwaighte et al.14 The steady-state spatial distribution of regional blood flows within organs is always broad, having coefficients of variation of 25% or more, depending on the tissue under study and the ambient humoral, nervous, and metabolic conditions.9,47 To allow an approximate description of spatial heterogeneity at the level of spatial resolution of about 0.5–1% of the heart mass (the resolution used for PET analysis) and still account for the heterogeneity within the observed region-of-interest, our capillary–tissue exchange model can be incorporated into a multicapillary configuration in which the blood–tissue exchange regions are composed of a set of parallel, independent capillary–tissue exchange units such as those described.27,48
The O2 consumption in such small tissue regions can be measured directly using the tracer kinetics of 15O-oxygen in PET imaging51 and in isolated perfused rabbit hearts.27 For standard PET imaging data analysis, one uses 30–100 regions of interest within the LV myocardium, so efficiency is very important. To extend our current nontracer model for the analysis of tracer 15O-oxygen from PET imaging studies, it needs to be integrated with an identical model for tracer 15O-oxygen and its product, tracer 15O-water, which is formed in the mitochondria. The steady-state solutions of the current model will provide the volumes of distribution (virtual volumes) for the tracer 15O-oxygen that accounts for the Hb binding space and water space. The current model differs from that of Li et al.51 in the sense that the virtual volumes will be functions of PO2, PCO2, and pH, and therefore will vary under varying physiological conditions.
Assessment of the Model’s Features
As reviewed in detail by Hellums et al.,37 there are a number of issues to be addressed in any integrated model that contains simplifications or approximations of the real geometry and physiology. These issues include (1) the exchanges across the arterioles and venules walls and the complexity of diffusional interactions among the capillaries, arterioles, and venules, (2) the radial gradients in blood, particularly in arterioles and venules, and in tissues, (3) the increase in intracapillary diffusional resistance due to the spacings between RBC in the capillary, (4) the existence of a continuous disequilibrium between O2 and Hb and between O2 and Mb during steady states involving diffusion and consumption (and likewise for CO2 with Hb), (5) the anion exchanges ( and Cl−) across the membranes, and (6) at the level of molecular interactions, the release of approximately 0.7 H+ and binding of 60 H2O molecules25 when O2 binds to Hb.
The components of Issue 1, arteriolar and venular exchanges, can be handled approximately, using three or more BTEX units in series, as was done.27 The first serves as the arteriole, the second as the capillary–tissue region and the third as the venule. The parameters for the volumes and permeabilities of the arteriolar and venular sections are adjusted to match reality. The resistances between blood and tissue are the sum of those of the vessel walls (with a minor degree of O2 consumption by the smooth muscle and other cells) and of the loose aureolar connective tissue surrounding the vessels and allowing their expansion and contraction. Further, the arrangement in many tissues including the heart where each arteriole is accompanied by two venules (venae comitantes6) means that some oxygen diffuses from arterioles to interstitium to venules without passing by the muscle cells. While this is most obvious for heat exchange,9 it is a major factor in shaping the impulse responses for tracer water16 and oxygen17; this can be accounted for, again approximately but rather well, by increasing the Disf, the dispersion coefficient in the interstitial fluid space, to allow graded fluxes between the upstream and downstream ends of the capillary–tissue exchange unit, which accounts approximately for the asynchrony or offsettedness of capillary entrances and exits. An improved treatment would include the arterio-venous exchanges directly in addition to the dispersion.
Compensating for the omission of radial gradients (Issue 2) is important. O2 and CO2 gradients will be poorly represented in arterioles and venules. Radial diffusion in 20–40-micron diameter vessels takes longer than in capillaries where RBCs rub along the capillary wall; decreasing P Scap can give a good approximation to this enlarged resistance when the resistance and fluxes are calculated from a more detailed model such as that of Huang and Hellums.44 Their model tested very well against the data on 1.5 mm diameter tubes from Dorson and Voorhees28 on O2 and CO2 exchange. Fortunately the fluxes across walls of arterioles and venules are small,44,67 so finding an exact correction is not critical. As for intra-tissue diffusion, with half-intercapillary distances of about 8 microns in the heart,6 the diffusion relaxation times are short enough (τ = R2/2D or about 30 ms maximum) that the radial gradients are almost dissipated within one time step for the numerical solution, allowing us to consider them negligible within the shorter distances across each of the radial regions.
Issue 3 relates to the hematocrit-dependency of the effective blood–tissue exchange, defined by Hellums36 in a nicely principled analysis: Transfer of O2 is faster when plasmatic gaps between RBC are smaller. Others29,30,34,37,44 discussed that even in steady-state modeling there was an influence of RBC spacing in the capillary on the efficiency of O2 transfer from blood to the tissue when the hematocrit was lower than 20%. This is not directly addressed in the current model, but the reduction in oxygen transfer due to the decreased PO2 within the plasmatic gaps can be well approximated, as far as delivery to the tissue is concerned, by an appropriate reduction in P Scap.
Slow release of O2 from Hb (Issue 4) retards exchange into peripheral tissues. Slow dissociation reduces the effective free O2 concentration at the RBC membrane and reduces transmembrane flux,37 exactly analogous to the situation for albumin-facilitated diffusion of fatty acid in plasma when there is endothelial uptake.4 Likewise, slow association retards RBC uptake of O2 in the lung, contributing to any alveolar–arterial O2 concentration difference. Knowing the rate constants and the dimensions involved allows translation into an equivalent increase in the membrane resistance. While the rate constants for CO2 binding with Hb are known, those for O2 binding are concentration-dependent and treated empirically, as described by Hellums et al.37, their Eq. (7), where the “on” and “off” rates are defined as a function of HbO2 saturation to account for the cooperativity.
Slow anion exchange (Issue 5) may be important at the RBC membrane because a delay in and Cl− exchange influences the pH inside the RBC. This would slow the pH change along the length of the exchange region, retarding the rise of pH and carbamino formation in the capillary blood (Fig. 2) and slowing CO2 loss in the lung. This is not accounted for in our present model.
Finally, Issue 6: There is the release of about 0.7 mole H+ per mole of O2 binding to Hb, and 1.5–2 moles H+ per mole of CO2 binding to Hb,42 that are not included in the present model, but could be added stoichiometrically to the equation for H+ fluxes. In going from a PO2 of 40–100 mmHg, 1 mole of Hb goes from 75 to 98% saturated, a gain of 23%. With [Hb] = 7.2 mM (Table 1), the O2 binding would displace about 0.7 times 0.23 times 7.2 mM, a change in [H+] of 1.16 mM, over 3 pH units. Since CO2 binds less readily to HbO2 than to Hb, and since in the lung the CO2 is coming off when O2 is going on, and vice versa in the systemic tissue, the net H+ exchange is always smaller than 1.16 mM. Because the amount of CO2 bound to Hb is much less than O2, there is still a net H+ balance dominated by the O2 binding or release.
While it is important to address the preceding six issues in any model of O2 and CO2 exchange, the present model is comprehensive enough that the model parameters can be varied to fit many different physiological and pathological conditions. For example, one can look at the distributions of O2, CO2, , and H+ and the regulation of acid–base balance in tissue cells in normoxia, hypoxic hypoxia (low arterial PO2), and anemic hypoxia (low hematocrits) conditions, and with varying arterial plasma or RBC pH. The results shown in this paper (Figs. 3–6) are the simulated concentration profiles with decreasing blood flow (Fbl) and increasing O2 consumption (Vmax). These cases correspond to the ischemic or low-perfusion (low Fbl) and exercise or higher energy demand (high Vmax) conditions. The transient behavior of these profiles at the onset of exercise (step increase in Vmax) from steady state can be computed and analyzed in understanding the dynamics of O2–CO2 exchange and acid–base balance.
The respiratory quotient RQ (the ratio of CO2 production to O2 consumption) was fixed at an average value of 0.8 (protein metabolism). While RQ can vary from 0.7 (fat metabolism) to 1.0 (carbohydrate metabolism), a model for a regulated change in CO2 production would require the model to include the major metabolic pathways (glycolysis, glycogenolysis, and TCA cycle) and oxidative phosphorylation15,49 along with the present model to complete the link between O2 consumption and CO2 and H+ production in the parenchymal cells.
There are 16 axial dispersion coefficients (sDr; 4 species × 4 regions) and 12 permeability surface area products (sP Sm; 4 species × 3 membranes) in the current model. There is neither enough information nor a real necessity to set them all at distinct values, because the gas exchanges between regions are so rapid. As discussed above and in the “Mathematical Formulation of the Model” section, the Ds were assigned higher values than the pure molecular diffusion coefficients to account for the heterogeneities of spacing and capillary entrance regions. The radial diffusion is a separate issue. While the true membrane PSs are high, and must be for O2 whose exchange is almost flow-limited in the microcirculation,51 they are reduced somewhat to account for the retarding influences of diffusion as discussed above. The PSs for O2 and CO2 are set at the values used for O2 by Li et al.51 in their studies of PET data analysis. The PSs for and H+ are set one order of magnitude lower than those for O2 and CO2, because their molecular polarity reduces transmembrane transport compared to nonpolar solutes.
In conclusion, the present model describes physiologically realistic features of O2 transport, exchange, and metabolism, including the simultaneous CO2 transport and exchange and acid–base balance. It is rather general and is widely applicable to measuring O2 consumption in the heart and other organs. The model parameters can be varied to simulate different physiological situations. The model is computationally efficient, so the tracer transients can be computed quickly, favoring this model as a preferred vehicle for routine data analysis (e.g., in PET imaging studies).
Acknowledgments
This research was supported by the National Simulation Resource Facility for Circulatory Mass Transport and Exchange via the grants P41-RR1243 from NCRR/NIH and R01-EB001973 from NIBIB/NIH. RKD was partially supported by the Center for Modeling Integrated Metabolic Systems (MIMS) via grant P50-GM66309 from NIGMS/NIH. The authors are grateful to the reviewers for their useful comments and suggestions. The model code is available at http://nsr.bioeng.washington.edu/ and can be run there via an applet supported by NIH/NIBIB R01-EB001973.
APPENDIX: ERRATA IN THE 2004 PUBLICATION OF THE HbO2 AND HbCO2 DISSOCIATION CURVES
Dash and Bassingthwaighte (2004): The article by Dash and Bassingthwaighte (Ann Biomed Eng 32: 1676–1693, 2004) appeared in print without galley proofs having been sent to either of the authors for review and correction. Errors in print setting were such that the equations essential to reproducing the scientific work needed to be reprinted in order to make the present paper understandable and the original work reproducible. A corrected version was printed by the publisher in 2010 “Dash RK and Bassingthwaighte JB. Erratum to: Blood HbO2 and HbCO2 dissociation curves at varied O2, CO2, pH, 2,3-DPG and Temperature Levels. Ann Biomed Eng 38(4): 1683-1701, 2010.” This 2010 version presents the correct equations and text as background for reproducing the work. This appendix corrects the errors in the 2004 printing and shows in Correction 6 a simplification of the calculation.
Correction 1
On page 1678 under MATHEMATICAL FORMULATIONS, Beginning at the end of paragraph 1, are a series of corrections to the equations 2a–f, where an upper case K is to be used instead of an erroneous lower case k:
“The governing reactions are:
CO2 hydration reaction – buffering of CO2:
| (2a) |
CO2 binding to HmNH2 chains – HmNHCOO− buffering of CO2:
| (2b) |
CO2 binding to O2HmNH2 chains – O2HmNHCOO− buffering of CO2:
| (2c) |
O2 binding to HmNH2 chains – one-step kinetics using the PO2 -dependent values of the rates of association and dissociation to accounts for the cooperativity.
| (2d) |
Ionization of HmNH2 chains – pH buffering:
| (2e) |
Ionization of O2HmNH2 chains – pH buffering:
| (2f) |
Correction 2
On page 1679, in the last sentence of this same section, and ending just above the section heading “Equilibrium Relations” the “ ” should be replaced by the upper case in two places:
“To account for this through our one-step kinetic approach in reaction (2d), we use the equilibrium “constant” a function of O2 partial pressure PO2; also depends on the levels of pH, PCO2, 2,3-DPG concentration, and temperature inside the RBCs4.”
Correction 3
All of Equations 3 and 4 require corrections to the upper versus lower case Ks and the kfs in the section on Equilibrium Relations:
| (3a) |
| (3b) |
| (3c) |
| (3d) |
| (3e) |
| (3f) |
| (3g) |
| (3h) |
| (3i) |
where the equilibrium constants and are defined by
| (4) |
Correction 4
In Appendix A, Eq. A.2 should be corrected to read:
| (A.2) |
Correction 5
The last sentence in the paragraph below Eq. A.3 should correct Rrbc to read:
“The value of Rrbc is about 0.6913–15,31,38. Multiplying [CO2]bl by 22.256 converts the units of molar to ml of CO2 per ml of blood.”
Correction 6
The first sentence of the paragraph above Eq. A.4 should correct H2O:
Correction 7
In Appendix B, Eqs. B.1 to B.3 should be corrected re and Kfact and the latter part of the first paragraph corrected to read: “
| (B.1) |
where (with units M−(1+n0)) is given by Equations 13 and 14:
| (B.2) |
The P50 is defined as before by Eq. (11) and the kinetic terms Kratio and Kfact are defined by Eqs. (18) and (14b). The Hill exponent in the expression for SHbO2 is now 1 + n0 and apparent Hill coefficient is now independent of [O2]. This makes SHbO2 analytically invertible, when PCO2, pH, [DPG] and T are known. The inverted equation for [O2] is given by
| (B.3) |
It is clear from Eq. (2) that can be determined completely using only the P50 = P50([H+], [CO2], [DPG], T) data which is given by Eq. (11). This avoids the calculations of Kratio and Kfact which involves the complex computations of the empirical indices n1, n2, n3, and n4 using Eqs. (20a) to (20d). This also simplifies the computation of SHbO2 from [O2] and vice-versa significantly. However, in the computation of SHbCO2 from [CO2] and vice-versa (not shown in this appendix), the calculations of Kfact and Kratio are essential as the P50 data for 50% HbCO2 saturation is not available in the literature.”
References
- 1.Antonini E, Brunori M. Hemoglobin and Myoglobin in their Reactions with Ligands. Amsterdam: North Holland; 1971. p. 436. [Google Scholar]
- 2.Austin WH, Lacombe E, Rand PW, Chatterjee M. Solubility of carbon dioxide in serum from 15 to 38°C. J Appl Physiol. 1963;18:301–304. doi: 10.1152/jappl.1963.18.2.301. [DOI] [PubMed] [Google Scholar]
- 3.Barbee JH, Cokelet GR. The Fahraeus effect. Microvasc Res. 1971;3:6–16. doi: 10.1016/0026-2862(71)90002-1. [DOI] [PubMed] [Google Scholar]
- 4.Barta E, Sideman S, Bassingthwaighte JB. Facilitated diffusion and membrane permeation of fatty acid in albumin solutions. Ann Biomed Eng. 2000;28:331–345. doi: 10.1114/1.274. [DOI] [PMC free article] [PubMed] [Google Scholar]
- 5.Bassingthwaighte JB. Plasma indicator dispersion in arteries of the human leg. Circ Res. 1966;19:332–346. doi: 10.1161/01.res.19.2.332. [DOI] [PMC free article] [PubMed] [Google Scholar]
- 6.Bassingthwaighte JB, Yipintsoi T, Harvey RB. Microvasculature of the dog left ventricular myocardium. Microvasc Res. 1974;7:229–249. doi: 10.1016/0026-2862(74)90008-9. [DOI] [PMC free article] [PubMed] [Google Scholar]
- 7.Bassingthwaighte JB. A concurrent flow model for extraction during transcapillary passage. Circ Res. 1974;35:483–503. doi: 10.1161/01.res.35.3.483. [DOI] [PMC free article] [PubMed] [Google Scholar]
- 8.Bassingthwaighte JB, Yipintsoi T, Knopp TJ. Diffusional arteriovenous shunting in the heart. Microvasc Res. 1984;28:233–253. doi: 10.1016/0026-2862(84)90020-7. [DOI] [PMC free article] [PubMed] [Google Scholar]
- 9.Bassingthwaighte JB, Goresky CA. Modeling in the analysis of solute and water exchange in the microvasculature. In: Renkin EM, Michel CC, editors. Handbook of Physiology. Sect. 2, The Cardiovascular System. Vol IV, The Microcirculation. Bethesda, MD: Am. Physiol. Soc; 1984. pp. 549–626. [Google Scholar]
- 10.Bassingthwaighte JB, Chinard FP, Crone C, Goresky CA, Lassen NA, Reneman RS, Zierler KL. Terminology for mass transport and exchange. Am J Physiol Heart Circ Physiol. 1986;250:H539–H545. doi: 10.1152/ajpheart.1986.250.4.H539. [DOI] [PMC free article] [PubMed] [Google Scholar]
- 11.Bassingthwaighte JB, Wang CY, Chan IS. Blood–tissue exchange via transport and transformation by endothelial cells. Circ Res. 1989;65:997–1020. doi: 10.1161/01.res.65.4.997. [DOI] [PMC free article] [PubMed] [Google Scholar]
- 12.Bassingthwaighte JB, King RB, Roger SA. Fractal nature of regional myocardial blood flow heterogeneity. Circ Res. 1989;65:578–590. doi: 10.1161/01.res.65.3.578. [DOI] [PMC free article] [PubMed] [Google Scholar]
- 13.Bassingthwaighte JB, Chan IS, Wang CY. Computationally efficient algorithms for capillary convection-permeation-diffusion models for blood–tissue exchange. Ann Biomed Eng. 1992;20:687–725. doi: 10.1007/BF02368613. [DOI] [PubMed] [Google Scholar]
- 14.Bassingthwaighte JB, Beard DA, Li Z. The mechanical and metabolic basis of myocardial blood flow heterogeneity. Basic Res Cardiol. 2001;96:582–594. doi: 10.1007/s003950170010. [DOI] [PMC free article] [PubMed] [Google Scholar]
- 15.Bassingthwaighte JB. The modelling of a primitive “sustainable” conservative cell. Philos Trans R Soc Lond A. 2001;359:1055–1072. doi: 10.1098/rsta.2001.0821. [DOI] [PMC free article] [PubMed] [Google Scholar]
- 16.Beard DA, Bassingthwaighte JB. Advection and diffusion of substances in biological tissues with complex vascular networks. Ann Biomed Eng. 2000;28:253–268. doi: 10.1114/1.273. [DOI] [PMC free article] [PubMed] [Google Scholar]
- 17.Beard DA, Bassingthwaighte JB. Modeling advection and diffusion of oxygen in complex vascular networks. Ann Biomed Eng. 2001;29:298–310. doi: 10.1114/1.1359450. [DOI] [PMC free article] [PubMed] [Google Scholar]
- 18.Beard DA. Computational framework for generating transport models from databases of microvascular anatomy. Ann Biomed Eng. 2001;29:837–843. doi: 10.1114/1.1408920. [DOI] [PubMed] [Google Scholar]
- 19.Berzins M, Dew PM. Algorithm 690: Chebyshev polynomial software for elliptic-parabolic systems of PDEs. ACM Trans Math Softw. 1994;17:178–206. [Google Scholar]
- 20.Beyer RP, Bassingthwaighte JB, Deussen AJ. A computational model of oxygen transport from red blood cells to mitochondria. Comput Methods Prog Biomed. 2002;67:39–54. doi: 10.1016/s0169-2607(00)00146-2. [DOI] [PMC free article] [PubMed] [Google Scholar]
- 21.Blom JG, Zegeling PA. Algorithm 731: A moving grid-interface for systems of one-dimensional time-dependent partial differential equations. ACM Trans Math Softw. 1994;20:194–214. [Google Scholar]
- 22.Buerk DG, Bridges EW. A simplified algorithm for computing the variation in oxyhemoglobin saturation with pH PCO2, T and DPG. Chem Eng Commun. 1986;47:113–124. [Google Scholar]
- 23.Butterworth E, Li Z. J Sim a Java-based simulation system for modeling analysis of experimental data. Seattle, Washington: 2000. http://nsr.bioeng.washington.edu/ [Google Scholar]
- 24.Caldwell JH, Martin GV, Raymond GM, Bassingthwaighte JB. Regional myocardial flow and capillary permeability–surface area products are nearly proportional. Am J Physiol Heart Circ Physiol. 1994;267:H654–H666. doi: 10.1152/ajpheart.1994.267.2.H654. [DOI] [PubMed] [Google Scholar]
- 25.Colombo MF, Rau DC, Parsegian VA. Protein solvation in allosteric regulation: A water effect on hemoglobin. Science. 1992;256:655–659. doi: 10.1126/science.1585178. [DOI] [PubMed] [Google Scholar]
- 26.Dash RK, Bassingthwaighte JB. Erratum to: Blood HbO2 and HbCO2 dissociation curves at varied O2, CO2, pH, 2,3-DPG and Temperature Levels. Ann Biomed Eng. 2010;38(4):1683–1701. doi: 10.1007/s10439-010-9948-y. [DOI] [PMC free article] [PubMed] [Google Scholar]
- 27.Deussen A, Bassingthwaighte JB. Modeling [15O]oxygen tracer data for estimating oxygen consumption. Am J Physiol Heart Circ Physiol. 1996;270:H1115–H1130. doi: 10.1152/ajpheart.1996.270.3.H1115. [DOI] [PMC free article] [PubMed] [Google Scholar]
- 28.Dorson WJ, Jr, Voorhees M. Limiting models for the transfer of CO2 and O2 in membrane oxygenators. Trans Am Soc Artif Intern Organs. 1974;20A:219–226. [PubMed] [Google Scholar]
- 29.Federspiel WJ, Sarelius IH. An examination of the contribution of red cell spacing to the uniformity of oxygen flux at the capillary wall. Microvasc Res. 1984;27:273–285. doi: 10.1016/0026-2862(84)90059-1. [DOI] [PubMed] [Google Scholar]
- 30.Federspiel WJ, Popel AS. A theoretical analysis of the effect of the particulate nature of blood on oxygen release in capillaries. Microvasc Res. 1986;32:164–189. doi: 10.1016/0026-2862(86)90052-x. [DOI] [PMC free article] [PubMed] [Google Scholar]
- 31.Goldman D, Popel AS. A computational study of the effect of capillary network anastomoses and tortuosity on oxygen transport. J Theor Biol. 2000;206:181–194. doi: 10.1006/jtbi.2000.2113. [DOI] [PubMed] [Google Scholar]
- 32.Gonzalez F, Bassingthwaighte JB. Heterogeneities in regional volumes of distribution and flows in the rabbit heart. Am J Physiol Heart Circ Physiol. 1990;258:H1012–H1024. doi: 10.1152/ajpheart.1990.258.4.H1012. [DOI] [PMC free article] [PubMed] [Google Scholar]
- 33.Goresky CA, Bach GG, Nadeau BE. Red cell carriage of label: Its limiting effect on the exchange of materials in the liver. Circ Res. 1975;36:328–351. doi: 10.1161/01.res.36.2.328. [DOI] [PubMed] [Google Scholar]
- 34.Groebe K, Thews G. Effects of red cell spacing and red cell movement upon oxygen release under conditions of maximally working skeletal muscle. In: Rakusan K, Biro GP, Goldstick TK, Turek Z, editors. Oxygen Transport to Tissue XI. New York: Plenum Press; 1989. pp. 175–185. [DOI] [PubMed] [Google Scholar]
- 35.Hedley-Whyte J, Laver MB. O2 solubility in blood and temperature correction factors for PO2. J Appl Physiol. 1964;19:901–906. doi: 10.1152/jappl.1964.19.5.901. [DOI] [PubMed] [Google Scholar]
- 36.Hellums JD. The resistance to oxygen transport in the capillaries relative to that in the surrounding tissue. Microvasc Res. 1977;13:131–136. doi: 10.1016/0026-2862(77)90122-4. [DOI] [PubMed] [Google Scholar]
- 37.Hellums JD, Nair PK, Huang NS, Ohshima N. Simulation of intraluminal gas transport processes in the microcirculation. Ann Biomed Eng. 1996;24:1–24. doi: 10.1007/BF02770991. [DOI] [PubMed] [Google Scholar]
- 38.Hill AV. The possible effects of the aggregation of the molecules of haemoglobin on its dissociation curves. J Physiol. 1910;40:iv–vii. [Google Scholar]
- 39.Hill EP, Power GG, Longo LD. A mathematical model of carbon dioxide transfer in the placenta and its interaction with oxygen. Am J Physiol Cell Physiol. 1973;224:283–299. doi: 10.1152/ajplegacy.1973.224.2.283. [DOI] [PubMed] [Google Scholar]
- 40.Hill EP, Power GG, Longo LD. Mathematical simulation of pulmonary O2 and CO2 exchange. Am J Physiol Cell Physiol. 1973;224:904–917. doi: 10.1152/ajplegacy.1973.224.4.904. [DOI] [PubMed] [Google Scholar]
- 41.Hill EP, Power GG, Longo LD. Kinetics of O2 and CO2 exchange. In: West JB, editor. Bioengineering Aspects of the Lung. New York: Marcel Dekker; 1977. pp. 459–514. [Google Scholar]
- 42.Hlastala MP, Woodson RD. Saturation dependency of the Bohr effect: Interactions among H+, CO2 and DPG. J Appl Physiol. 1975;38:1126–1131. doi: 10.1152/jappl.1975.38.6.1126. [DOI] [PubMed] [Google Scholar]
- 43.House SD, Lipowsky HH. Microvascular hematocrit and red cell flux in rat cremaster muscle. Am J Physiol Heart Circ Physiol. 1987;252:H211–H222. doi: 10.1152/ajpheart.1987.252.1.H211. [DOI] [PubMed] [Google Scholar]
- 44.Huang NS, Hellums JD. A theoretical model for gas transport and acid/base regulation by blood flowing in microvessels. Microvasc Res. 1994;48:364–388. doi: 10.1006/mvre.1994.1062. [DOI] [PubMed] [Google Scholar]
- 45.Kelman GR. Digital computer subroutine for the conversion of oxygen tension into saturation. J Appl Physiol. 1966;21:1375–1376. doi: 10.1152/jappl.1966.21.4.1375. [DOI] [PubMed] [Google Scholar]
- 46.Kettunen MI, Gröhn OHJ, Silvennoinen MJ, Penttonen M, Kauppinen RA. Quantitative assesment of balance between oxygen delivery and consumption in the rat brain after transient ischemia with T2-BOLD magnetic resonance imaging. J Cereb Blood Flow Metab. 2002;22:262–270. doi: 10.1097/00004647-200203000-00003. [DOI] [PubMed] [Google Scholar]
- 47.King RB, Bassingthwaighte JB, Hales JRS, Rowell LB. Stability of heterogeneity of myocardial blood flow in normal awake baboons. Circ Res. 1985;57:285–295. doi: 10.1161/01.res.57.2.285. [DOI] [PMC free article] [PubMed] [Google Scholar]
- 48.King RB, Raymond GM, Bassingthwaighte JB. Modeling blood flow heterogeneity. Ann Biomed Eng. 1996;24:352–372. doi: 10.1007/BF02660885. [DOI] [PMC free article] [PubMed] [Google Scholar]
- 49.Korzeniewski B, Zoladz JA. A model of oxidative phosphorylation in mammalian skeletal muscle. Biophys Chem. 2001;92:17–34. doi: 10.1016/s0301-4622(01)00184-3. [DOI] [PubMed] [Google Scholar]
- 50.Krogh A. The number and distribution of capillaries in muscles with calculations of the oxygen pressure head necessary for supplying the tissue. J Physiol (Lond) 1919;52:409–415. doi: 10.1113/jphysiol.1919.sp001839. [DOI] [PMC free article] [PubMed] [Google Scholar]
- 51.Li Z, Yipintsoi T, Bassingthwaighte JB. Nonlinear model for capillary–tissue oxygen transport and metabolism. Ann Biomed Eng. 1997;25:604–619. doi: 10.1007/bf02684839. [DOI] [PMC free article] [PubMed] [Google Scholar]
- 52.Nair PK, Buerk DG, Whalen WJ. Cat carotid body oxygen metabolism and chemoreception described by a two-cytochrome model. Am J Physiol Heart Circ Physiol. 1986;250:H202–H207. doi: 10.1152/ajpheart.1986.250.2.H202. [DOI] [PubMed] [Google Scholar]
- 53.Ogawa S, Menon RS, Tank DW, Kim SG, Merkle H, Ellermann JM, Ugurbil K. Functional brain mapping by blood oxygenation level-dependent contrast magnetic resonance imaging. A comparison of signal characteristics with a biophysical model. Biophys J. 1993;64:803–812. doi: 10.1016/S0006-3495(93)81441-3. [DOI] [PMC free article] [PubMed] [Google Scholar]
- 54.Popel AS. Theory of oxygen transport to tissue. Crit Rev Biomed Eng. 1989;17:257–321. [PMC free article] [PubMed] [Google Scholar]
- 55.Rose CP, Goresky CA. Limitations of tracer oxygen uptake in the canine coronary circulation. Circ Res. 1985;56:57–71. doi: 10.1161/01.res.56.1.57. [DOI] [PubMed] [Google Scholar]
- 56.Safford RE, Bassingthwaighte JB. Calcium diffusion in transient and steady states in muscle. Biophys J. 1977;20:113–136. doi: 10.1016/S0006-3495(77)85539-2. [DOI] [PMC free article] [PubMed] [Google Scholar]
- 57.Safford RE, Bassingthwaighte EA, Bassingthwaighte JB. Diffusion of water in cat ventricular myocardium. J Gen Physiol. 1978;72:513–538. doi: 10.1085/jgp.72.4.513. [DOI] [PMC free article] [PubMed] [Google Scholar]
- 58.Salathe EP, Fayad R, Schaffer SW. Mathematical analysis of carbon dioxide transfer by blood. Math Biosci. 1981;57:109–153. [Google Scholar]
- 59.Schenkman KA, Marble DR, Burns DH, Feigl EO. Myoglobin oxygen dissociation by multiwavelength spectroscopy. J Appl Physiol. 1997;82:86–92. doi: 10.1152/jappl.1997.82.1.86. [DOI] [PubMed] [Google Scholar]
- 60.Schenkman KA, Marble DR, Burns DH, Feigl EO. Optical spectroscopic method for in vivo measurement of cardiac myoglobin oxygen saturation. Appl Spectrosc. 1999;53:332–338. [Google Scholar]
- 61.Secomb TW, Hsu R, Beamer NB, Coull BM. Theoretical simulation of oxygen transport to brain by networks of microvessels: Effects of oxygen supply and demand on tissue hypoxia. Microcirculation. 2000;7:237–247. [PubMed] [Google Scholar]
- 62.Shishido F, Uemura K, Inugami A, Ogawa T, Yamaguchi T, Kanno I, Murakami M, Tagawa K, Yasui N. Remote effects in MCA territory ischemic infarction: A study of regional cerebral blood flow and oxygen metabolism using positron computed tomography and 15O labeled gases. Radiat Med. 1987;5:36–41. [PubMed] [Google Scholar]
- 63.Singh MP, Sharan M, Aminataei A. Development of mathematical formulae for O2 and CO2 dissociation curves in the blood. IMA J Math Appl Med Biol. 1989;6:25–46. [Google Scholar]
- 64.Suenson M, Richmond DR, Bassingthwaighte JB. Diffusion of sucrose, sodium, and water in ventricular myocardium. Am J Physiol. 1974;227:1116–1123. doi: 10.1152/ajplegacy.1974.227.5.1116. [DOI] [PMC free article] [PubMed] [Google Scholar]
- 65.Vinnakota K, Bassingthwaighte JB. Myocardial density and composition: A basis for calculating intracellular metabolite concentrations. Am J Physiol Heart Circ Physiol. 2004;286:H1742–H1749. doi: 10.1152/ajpheart.00478.2003. [DOI] [PubMed] [Google Scholar]
- 66.Winslow RM, Samaja M, Winslow NJ, Rossi-Bernardi L, Shrager RI. Simulation of continuous blood O2 equilibrium over physiological pH, DPG, and PCO2 range. J Appl Physiol: Respir Environ Exercise Physiol. 1983;54:524–529. doi: 10.1152/jappl.1983.54.2.524. [DOI] [PubMed] [Google Scholar]
- 67.Ye GF, Moore TW, Buerk DG, Jaron D. A compartmental model for oxygen-carbon dioxide coupled transport in the microcirculation. Ann Biomed Eng. 1994;22:464–479. doi: 10.1007/BF02367083. [DOI] [PubMed] [Google Scholar]