

Abstract
Delivery of therapeutic agents selectively to tumor tissue, which is referred as “targeted delivery,” is one of the most ardently pursued goals of cancer therapy. Recent advances in nanotechnology enable numerous types of nanoparticles (NPs) whose properties can be designed for targeted delivery to tumors. In spite of promising early results, the delivery and therapeutic efficacy of the majority of NPs are still quite limited. This is mainly attributed to the limitation of currently available tumor models to test these NPs and systematically study the effects of complex transport and pathophysiological barriers around the tumors. In this study, thus, we developed a new in vitro tumor model to recapitulate the tumor microenvironment determining the transport around tumors. This model, named tumor-microenvironment-on-chip (T-MOC), consists of 3-dimensional microfluidic channels where tumor cells and endothelial cells are cultured within extracellular matrix under perfusion of interstitial fluid. Using this T-MOC platform, the transport of NPs and its variation due to tumor microenvironmental parameters have been studied including cut-off pore size, interstitial fluid pressure, and tumor tissue microstructure. The results suggest that T-MOC is capable of simulating the complex transport around the tumor, and providing detailed information about NP transport behavior. This finding confirms that NPs should be designed considering their dynamic interactions with tumor microenvironment.
Keywords: Cancer, tumor microenvironment, microfluidics, nanoparticle transport
Introduction
Targeted delivery of drugs and imaging agents to tumors can significantly improve the efficacy of cancer treatment and diagnosis by minimizing systemic toxicity and non-specific accumulation at non-targeted tissues [1, 2]. Recent development of nanotechnology enables synthesis of numerous types of nanometer size structures, collectively called “nanoparticles” (NPs), as delivery vehicles for targeted delivery. These NPs include liposomes, polymer micelles, dendrimers, drug nanocrystals, nanorods, nanotubes, and drug-polymer conjugates [3, 4]. Many of these NPs were designed exploiting the difference in cut-off pore size between normal and tumor vasculature, so called “Enhanced Permeation and Retention” (EPR) effect [5, 6]. Although improved delivery efficacy has been reported using these NPs, only about 5 % of drugs and imaging agents administered can be delivered to the target tumor [7, 8]. This limited delivery is thought to be caused by complex transport processes after systemic administration and pathophysioloigcal barriers around tumors. These processes include blood flow-driven transport of the NPs, NP-endothelium interactions, extravasation, interstitial transport and cellular uptake as reviewed elsewhere [4, 9]. During this series of transport processes, the elevated interstitial fluid pressure (IFP), lack of functional lymphatic vessels, dense extracellular matrix (ECM) microstructure and high cell packing density pose transport barriers to the tumors. In order to achieve successful targeted delivery, NPs need to be designed in consideration with all these complex transport processes and barriers [4, 10].
Currently available tumor models, however, are limited to properly represent these complex transport processes. Most widely used tumor models are 2D cell monolayers and tumor spheroids [11–13]. These models are generally easy to handle and reproducible, but lack several key features of tumor microenvironment [14]. These architectural and environmental differences further affect the cellular difference in both gene expression and drug resistance [15, 16]. One of the key deficiencies is the fluid dynamics relevant to the tumor microenvironment [17]. Thus, various cancer cell cultures on microfluidic platforms have been developed including 2D cell monolayers on microchannels [18, 19], cells in 3D matrices [14, 20, 21], and spheroids in microchannels [22]. In addition, several recent studies are reported to impose chemical gradients and perfusion of interstitial fluid [23, 24].
Small animal models have been valuable platforms to characterize the in vivo behavior of the NPs, but the models only provide end results with limited mechanistic explanation. Moreover, xenograft models often fail to predict human outcomes due to the largely unknown scaling factors of extrapolation [25, 26]; the mismatch between human cells and mice matrix environments [27, 28]; the difficulties to simulate the heterogeneity of tumor microenvironmental parameters [29]; and the inability to independently control these parameters. Thus, a new model system is greatly desired, in which the tumor microenvironmental parameters can be systematically and independently controlled, but at the same time the dynamic interactions among the fluids, ECM, cells and NPs are maintained.
In this study, a new microfluidic engineered tumor model, named “tumor-microenvironment-on-chip” (T-MOC), was developed to recapitulate the key features of complex transport of drugs and NPs within the tumor microenvironment. The model was a three-dimensional (3D) microfluidic platform culturing human breast cancer cells (MCF-7) and microvascular endothelial cells (MVECs) in 3D tissue architecture. This model system was also tested to systematically characterize the effects of pathophysiological conditions of tumors on the NP transport. The results were further discussed to establish a quantitative and mechanistic understanding of the complex transport NPs. The capability of the developed model was also discussed.
Material and Methods
Microfabrication of the T-MOC
The T-MOC has a 3D structure formed by stacking two layers of microchannels with a porous membrane sandwiched between the layers. The top layer has a 300 μm wide channel simulating the capillary of the tumor vasculature, where NP-suspended fluid will flow along the channel at a physiologically relevant velocity and pressure. The bottom layer includes an interstitial channel with a 1 mm by 2.7 mm central chamber for tumor cells and ECM and two 300 μm wide side channels serving as lymphatics. The top and bottom layer channels have 50 and 100 μm thicknesses, respectively.
The T-MOC was fabricated via a two-step photolithography technique. Briefly, SU-8 photoresist was spin-coated on silicon dioxide (SiO2) wafers, then baked. The wafer was then exposed to UV light through masks with channel configurations of top and bottom layers of the T-MOC. After the post-baking procedure, the wafers were immersed into SU-8 developer solution and rinsed with isopropyl alcohol. Then, a mixture of polydimethylsiloxane (PDMS) and a curing agent was poured on the silicon wafers (i.e., the mold) then baked. After polymerization, the PDMS layers were peeled off from the mold. The PDMS layers were cleaned, and the inlet and outlet ports were punched. A polycarbonate membrane (Cyclopore, Whatman) was treated with 3-aminopropyltriethoxysilane solution and dried, and then bonded between the top and bottom PDMS layers. Additional details of the fabrication and assembly of T-MOC components are provided in Figure S-1 in supplementary information.
Cell and reagents
A human breast cancer cell line (MCF-7) was cultured in DMEM/F12 (Invitrogen, NY, USA) supplemented with fetal bovine serum (FBS), L-glutamine, Penicillin/Streptomycin, and insulin. To mimic the 3D tumor tissue, the MCF-7 cells were seeded in type I collagen solution (BD Biosciences, Bedford, MA) to create tumor tissues with various cell and collagen concentrations. The concentrations used in this study were 1×10⁶, 1×10⁷, 2×10⁷, and 1×10⁸ cells/ml, and 3 and 6 mg/ml of collagen, respectively. The collagen solution was prepared as described previously [30]. The 50μl of un-polymerized cell-laden collagen solution was loaded to the tumor interstitium microchannel. The collagen-loaded T-MOC was placed in an incubation stage (1hour at 37°C) for polymerization. After polymerization, the T-MOC was perfused with culture media and further incubated at 37°C and 5% CO2 conditions.
In order to prepare the functional endothelium on the T-MOC, human microvascular endothelial cells (Life Technologies) were seeded and cultured along its capillary channel when applicable. Briefly speaking, the membrane of the capillary channel was coated with Matrigel (BD Science) to mimic the basement membrane. First, stock solution of Matrigel was diluted at a 1:10 ratio and introduced to the channel. Then, T-MOC chip was incubated at 37°C for 10 minutes, and then washed with cold PBS three times. After the coating, MVECs were collected and suspended in full culture medium at a concentration of 1×10⁷ cells/ml. The cell suspension was infused along the channel, and the cell-loaded chip was incubated at 37°C for 2 hours for attachment. After confirming the attachment, the cells were cultured under slow shear flow exerting shear stress on the cells (~ 0.1 dyne/cm2) up to 3 days.
NP transport on the T-MOC
In order to mimic on T-MOC the complex hydraulic pressure conditions observed in tumors in vivo, the microfluidic device was pressurized by applying different pressures at capillary, interstitial and lymphatic channels. Pressurization was achieved by introducing columns of culture media to the inlet ports of the device. Different pressure configurations were obtained by varying the heights of the culture media reservoirs. In particular, pressures between 5 through 40 mmHg were applied at both ends of interstitial channel while 5 mmHg was applied to the four lymphatic channel inlet ports. The applied capillary pressure was approximately 20 mmHg, consistent with the physiological conditions. To facilitate the transport of NPs along the capillary, a small pressure differential was applied to the ends of the capillary channel (20 mmHg to 19.25 mmHg). The resulting average capillary fluid velocity was measured to be 0.3mm/s. Once the pressurization was completed, fluorescent NPs with various diameters (100, 200, and 500 nm, Duke Scientific, Inc) were introduced to one of the capillary channel culture media reservoirs to obtain a final particle concentration of 1011 particles/ml. Subsequently, the NP solution was observed to enter and move across the capillary channel while also being transported across the membrane and into the interstitial channel. Time-lapse fluorescence images were acquired during this process by an inverted microscope (IX71, Olympus, Japan) using a 10X objective. Imaging was conducted every 10 minutes across a 12-hour span.
NP concentration profiles across the channel at each time point was determined by averaging the fluorescence intensity in x-direction. Particle concentration was then estimated using a linear calibration curve obtained under the similar imaging conditions (Figure S-2). Tumor accumulation was represented by average particle concentration in the interstitium excluding the region underneath the capillary.
Immunofluorescence microscopy
In order to examine cell-cell and cell-ECM interactions of MCF-7 cells on the T-MOC, expressions of membrane and structural proteins - tight junction protein zonula occludens (ZO-1), E-cadherin and type IV collagen were observed via immunofluorescence microscopy. Bovine serum albumin (BSA), phosphate buffered saline (PBS), TritonX-100, and Tween 20 were obtained from Sigma-Aldrich (St. Louis, MO). Primary antibodies of ZO-1 (mouse monoclonal) and E-cadherin (mouse monoclonal) were obtained from Invitrogen (Camarillo, CA); Collagen IV (rabbit polyclonal) was obtained from Millipore (Billerica, MA). All fluorophore-conjugated secondary antibodies were obtained from Invitrogen (Camarillo, CA). The MCF-7 cells on the T-MOC were fixed by perfusing 4% formaldehyde and permeabilized with 0.1% TritonX-100. After blocking with 3% BSA in PBS for 2 hours, primary antibodies were applied to cells against: ZO-1 (1:100), E-cadherin (1:100), and Collagen IV (1:100) then the T-MOCs were incubated overnight at 4°C. Fluorophore-conjugated secondary antibodies, Alexa fluor 488 goat anti-mouse IgG (1:400) and Alexa fluor 555 goat anti-rabbit IgG (1:400) were added and incubated for 40 minutes. Between each step cells were rinsed with PBS containing 0.1% BSA and 0.05% Tween 20. Fluorescence images were obtained using a fluorescence microscope (Olympus IX71, Japan).
Theoretical Analysis of NP Transport
Transport of NPs on the T-MOC was mathematically described by considering the conservation of mass, fluid momentum, and NP concentration during multiple transport processes. The tumor interstitium was assumed to be a porous medium and the fluid flow within the interstitial channel was determined by the Darcy’s Law. The flow in the capillary channel was assumed to be incompressible, laminar and governed by the Navier-Stokes Equation. The fluid and NP fluxes across the membrane were assumed to obey the Starling’s Law and Kedem-Katchansky Formulation [31] respectively. Then, the time dependent interstitial transport of NPs was computed by solving the species conservation law. The details of the computational model are provided in the supplementary information.
Results
In order to recapitulate the complex transport processes around a tumor, the model was designed to mimic a pair of capillary and lymphatic vessels where tumor tissue is sandwiched as shown in Figure 1A. The model has a 3D structure formed by stacking two layers of microchannels with a porous membrane sandwiched between the layers. The top layer has a channel simulating the capillary of the tumor vasculature, and NP-suspended fluid flows along the channel at a physiologically relevant velocity and pressure. The endothelium of the capillary is mimicked by culturing MVECs on a porous membrane so that its cut-off pore size can be controlled by using membranes with different pore sizes. The bottom layer has three channels, that are partitioned with periodic posts. The center channel simulates the tumor interstitium and the two side channels simulate the lymphatics. In the tumor channel, cancer cells grow within 3D collagen matrix, and the interstitial fluid flows through the matrix and exerts elevated IFP. The NPs will be transported through this 3D tissue structure and reach the cancer cells. The fabricated chip is connected to desired pressure reservoir as shown in Figure 1B so that each of the interstitial, capillary and lymphatic fluid pressures (IFP, CFP and LFP, respectively) can be independently controlled.
Figure 1.

Schematic of the tumor-microenvironment-on-chip. (A) Conceptual design: A minimal functional unit of a solid tumor, i.e., a pair of capillary and lymphatic vessels, is mimicked into a 3D microfluidic platform with a 3D structure. The top channel (red) simulates the capillary with endothelium (monolayer of endothelial cells on a nanoporous membrane). NPs can be introduced along this capillary channel. The bottom layer has a center channel (blue) mimicking a 3D tumor microstructure (i.e., cells in 3D matrix) and two side channels simulating the lymphatics (green). (B) Fabricated prototype and schematic of perfusion setup of the T-MOC. The tumor channel will be pressurized to establish the elevated interstitial fluid pressure (IFP). Computational model predictions of (C) IFP and (D) NP concentration in the T-MOC. Color contours show the spatial distribution of IFP and NP concentration in the tumor chamber on plan A-A noted in (B) at 8 hours after the start of NP perfusion in capillary channel. Time-lapse concentration profiles of NPs in the interstitial channel are also shown in (D), bottom. The values are normalized with respect to capillary drug concentration, Cv.
In order to confirm the transport processes in this platform, we performed computational analysis of the fluid and NP transport by modeling the transvascular and interstitial transport using the Darcy’s Law, Kedem-Katchansky formulation and the conservation of chemical species. The predicted distribution of IFP and NP concentration are provided in Figure 1C and 1D. These contours show the spatial distribution of IFP and NP concentration in the tumor chamber on a plan A-A noted in Figure 1B. This section is located 500 μm away from the origin in x-direction. Its location is arbitrarily selected and is representative of transport on device since the transport is approximately uniform across x-direction (Figure S-3 in supplementary information). It is observed that the tumor interstitium channel experiences significantly elevated levels of IFP, especially right underneath the endothelium membrane. This pressure distribution was found to be similar to that in a solid tumor where the IFP are sustained at an elevated level within the tumor but decays to the normal tissue levels near the tumor periphery [32]. Due to the higher capillary and interstitial pressure, convective flow of the interstitial fluid is induced from capillary to lymphatic on the order of 10 μm/s. The NPs are mostly accumulated underneath the membrane, which is analogous to the transvascular transport, i.e., extravasation. The concentration is uniform underneath the membrane along the y-direction, but decreases due to interstitial transport. The bottom panel in Figure 1D shows the z-averaged interstitial concentration of NPs with respect to time from the start of capillary perfusion. NPs that pass through the capillary wall first accumulate just under the membrane, i.e., the gray region. Then, they gradually transport across the interstitium by combined diffusion and convection similar to interstitial transport and lymphatic drainage. The relative amount of accumulation under the membrane and penetration into the tumor interstitium is mainly governed by the hydraulic conductivities of the membrane and collagen gel as well as permeability of membrane to the NP and effective diffusivity and solute velocity of NP in collagen gel. These processes are well analogous to the complex transport around in vivo tumors.
Tissue culture results on the T-MOC are shown in Figure 2. This tumor tissue was constructed by seeding 1×10⁷ cells/ml-collagen mixture solution whose collagen concentration is 6 mg/ml, so that the MCF-7 cells were growing within the 3D ECM architecture in the presence of the interstitial fluid similar to in vivo environments [14, 23]. When the collagen was polymerized (i.e., Day 0), the cells loosely aggregated with distinct cell membrane boundaries as shown in Figure 2A. As the tumor tissue was cultured, the size of the cell aggregates increased and the distinction between the cells diminished. After 3 days, the size of the tumor cell aggregates significantly increased by rapid proliferation of the cells, and the cell boundaries were hardly distinguishable, which mimics the tumor tissue structure very well. Throughout the culture, the viability of the tumor tissue was very high (i.e., typically above 95% as confirmed by the membrane integrity assay). Besides the viability, notable interactions and adhesions among neighboring cells and the ECM are observed as shown in Figure 2B. Two key adhesion molecules - tight junction protein (ZO-1) and E-cadherin confirm the presence of tightly packed cell-cell and cell-ECM adhesions around the cells on the T-MOC, which are the key characteristics of tumor microenvironment in vivo. Type IV collagen, synthesized and secreted by the MCF-7 cells, is also observed around the cells. In addition, formation of MVECs monolayer on the membrane is confirmed as shown in Figure 2C. After polymerization of tumor tissue construct in the interstitial channel, the MVECs were seeded and cultured on the membrane coated with Matrigel under shear flow. After 3 days, the cells covered the membrane well, began to form cell-cell junction, and provided a barrier function.
Figure 2.

Cellular microenvironment on the T-MOC. (A) Tumor cell growth during 3 days culture on the T-MOC. Tumor tissue equivalent (1×10⁷ cells/ml and 6 mg-collagen/ml) was created on the T-MOC and cultured for 3 days. At Day 0, MCF-7 cells, indicated by arrows, loosely aggregated within the collagen matrix. The cells proliferated and bound tightly as individual cells were not discernable in MCF-7 aggregates at Day 3. Scale bar is 300 μm. (B) Immunofluorescence micrographs showed expressions of the tight junction protein, E-cadherin and type IV collagen expression at Day 3. Scale bar is 50 μm. (C) Fluorescence micrographs of endothelial cells cultured on the T-MOC. The cells adhered to the membrane and formed a monolayer similar to endothelium of the tumor microvasculature. The plasma membranes are stained in orange, and the nuclei in purple. Scale bar is 100 μm.
After the fabrication and 3 days culture, we studied the NP transport behavior, particularly the effects of NP size. In order to quantitatively study the transport, fluorescence NPs with different sizes (i.e., 100, 200 and 500 nm in diameter) were introduced along the capillary channel while the T-MOC was imaged under a fluorescence microscope. The spatiotemporal variation of fluorescence intensity was further analyzed to determine the NP concentration profiles. The time-lapse fluorescence images at select time points (Figure 3A) and corresponding concentration profiles at 0.5, 1, 2, 4, 8 and 12 hours (Figure 3B) are presented. For a baseline condition (the cut-off diameter = 400 nm CFP = IFP = 20 mmHg, and LFP = 5 mmHg), time-lapse fluorescence images confirm rapid trans-membrane transport of 100 nm NPs and subsequent diffusion in the tumor channel. The results suggest that the trans-membrane transport is much faster than the interstitial diffusion. As the NP size increases to 200 nm, notable decrease of the trans-membrane transport is observed even though the NP size is still smaller than the cut-off diameter of the membrane. This implies that the size window for targeted delivery in vivo should be narrower than what has been suggested in literature based on EPR paradigm [33]. As the NPs are larger than the membrane pore, no transport into and through the tumor channel is observed. As summarized in Figure 3C, this size difference results in a significant difference in the NP transport away from the vessel wall and tumor accumulation. This implies that NPs need to be designed to be sufficiently smaller than the cut-off pore size of the endothelium to ensure the delivery of therapeutic agents to cancer cells.
Figure 3.

Effects of NP size on the transport processes. Using the T-MOC, effects of NP size on the extravasation and interstitial diffusion can be characterized. Although the cut-off pore size is 400 nm, significant decrease in extravasation is observed for 200 nm NPs. (A) Time-lapse fluorescence images of NP transport. (B) Corresponding concentration profiles. (C) Comparison of the concentration profiles (left) and accumulation (right) of the NPs.
In order to investigate the effects of tumor pathophysiological conditions on the NP transport, the transport of 100 nm NPs were characterized while varying cut-off pore size, IFP, and tissue microstructure. The effects of the cut-off pore size are presented in Figure 4. When the size of cut-off pore and NPs are both 100 nm, no NP transport is observed within the tumor channel. When the pores enlarge to 400 nm, the NP transport into the tumor channel is substantially augmented. However, the transport is not further enhanced as the pores increased to 1,000 nm. This suggests that the difference between the cut-off pore size and the NPs critically affects the NP transport around tumors, but, if the difference is larger than a certain threshold, increase in the pore size or decrease in the NP size have no critical impact. When the cut-off pores were formed by MVECs monolayer on the 1,000 nm membrane, the trans-membrane transport substantially decreases so that overall transport becomes less than that through 400 nm pore membranes.
Figure 4.

Effects of cut-off pore size on the transport processes. (A) Time-lapse fluorescence images of 100 nm NP transport. (B) Corresponding concentration profiles. (C) Comparison of the concentration profiles (left) and accumulation (right) of the NPs.
The effects of tissue microstructure are also shown in Figure 5. It has been known that tumor tissue has dense microstructure caused by high collagen content in the ECM and high cell packing density, which both are thought to be potential transport barriers [33–35]. Interestingly, the increase of the collagen content does not hinder the NP transport substantially. Both penetration of NPs and their tumor accumulation are higher in high collagen content ECM at 8 hours (p-value < 0.05 by Student’s t-test), but the magnitude of the difference is minimal. On the other hand, the high cell packing density not only hinders the interstitial transport, but it also substantially decreases extravasation. Thus, the overall NP accumulation decreases to approximately 80% of that observed in cell-free ECM. This implies that these transport barriers are closely associated with each other, and the collective effects should be considered when the NPs are designed.
Figure 5.

Effects of tissue microstructure on the transport processes. (A) Time-lapse fluorescence images of 100 nm NP transport. (B) Corresponding concentration profiles. (C) Comparison of the concentration profiles (left) and accumulation (right) of the NPs.
The effects of the IFP are presented in Figure 6. When the IFP is lower than the CFP (CFP = 20 mmHg > IFP = 5 mmHg), the NPs rapidly extravasate into the interstitium and diffuse away. As the IFP increases so that it balances with the CFP (i.e., CFP = IFP = 20 mmHg), the NPs still extravasate. This may be associated with the difference between local pressure and overall pressure applied along the interstitial channel. When the IFP became higher than the CFP (CFP = 20 mmHg < CFP = 40 mmHg), no extravasation was observed. It clearly shows that the NP transport is drastically hindered as the IFP becomes higher than the capillary pressure.
Figure 6.

Effects of interstitial fluid pressure on the transport processes. (A) Time-lapse fluorescence images of 100 nm NP transport. (B) Corresponding concentration profiles. (C) Comparison of the concentration profiles (left) and accumulation (right) of the NPs.
The effective diffusivity, Deff, of NPs in the interstitial channel was estimated by fitting a transport model to the concentration profiles as shown in Figure S-4 and the results are presented in Table 1. It is seen that overall, the Deff for T-MOC are within the range of 1 to 5 × 10⁻¹³ m2/s, which is in good agreement with previously reported values based on measurements in vivo for similarly sized liposomes [36]. It is also seen that the addition of cells resulted in a decrease in Deff by a factor of approximately 3 while the ECM concentration and the NP size were found to have little or no effect on Deff.
Table 1.
Effective diffusivity of polystyrene NPs estimated using T-MOC.
| Particle | DH [nm] | Interstitial Medium | Effective Diffusivity [10−13 m2/s] | Goodness of Fit (R2) |
|---|---|---|---|---|
| PS NP | 100 | ECM (3 mg/mL) | 3.3 | 0.84 |
| PS NP | 100 | ECM (6 mg/mL) | 4.5 | 0.94 |
| PS NP | 200 | ECM (6 mg/mL) | 4.4 | 0.94 |
| PS NP | 100 | ECM (6 mg/mL) + MCF-7 | 1.7 | 0.97 |
| Liposome [36] | 152.4 | U87/Mu89 mouse xenograft | 2.97 | - |
Discussion
The developed T-MOC is designed to recapitulate several key features of the tumor microenvironment relevant to the transport of NPs around tumors. First, it mimics a series of complex transport processes through which the NPs are thought to experience in vivo to reach the target cancer cells. Many of these transport processes occur at tissue-tissue interfaces, which lack in currently available in vitro tumor models. In addition, the T-MOC provides the capability to systematically control pathophysiological parameters affecting the transport characteristics. These parameters are the cut-off pore size of the tumor vasculature, elevated tumor IFP, dense ECM microstructure, and high cell packing density. These tumor microenvironmental parameters are highly dynamic, interconnected and vary spatiotemporally [37, 38]. The compounding effects of all these physiological conditions on NP transport are extremely difficult to study using currently available in vitro tumor models as well as in vivo small animal models. As illustrated in the Results section, the present T-MOC platform allows systematic study of the effects of these parameters and can provide useful information to interpret in vivo animal studies and eventually further extrapolate to human outcomes.
The present results illustrate that the environment created in the vicinity of tumor interstitium is associated with elevated levels of hydrostatic pressure. While there were variations in IFP across the interstitial channel due to channel geometry and complexity of pressurization scheme, these variations, predicted by the computational model in Figure 1C, were only prominent near lymphatics. For the case of prescribed IFP = 20 mmHg, the IFP values at locations just under the membrane where it is expected to affect the transvascular NP flux, were only 1–2 mmHg below the prescribed value. Yet this pressure difference could create a net convective solute flux, which could explain the extravasation under the conditions IFP = CFP = 20 mmHg. In addition, the primary sources of pressurization are thought to be the transmission of capillary pressure across the permeable membrane and the restriction of area of the gel boundary through which fluid is transferred from interstitial to lymphatic channels. These features of the microfluidic device are analogous to two conditions that arise in vivo solid tumors, leaky tumor vasculature and poor lymphatic drainage, which are considered to be responsible for the high interstitial fluid pressure levels observed in those tissues [9, 32]. By recreating on a chip the hydrostatic pressure conditions relevant to tumors, our microfluidic platform offers advantages over other platforms to evaluate the barrier function of high IFP in drug delivery.
It was observed that the trans-membrane transport of 100 nm NPs was completely hindered by 100 nm pore membrane, but a small amount of 500 nm NPs could extravasate through a membrane with 400 nm pores. This may be caused by the variation of pore cut-off diameters (Table S-2 in supplementary information). In addition SEM images of membranes in Figure S-2 show overlapping pores that result in larger effective diameters and could allow NPs to pass through. Finally, the variability in particle size is also another factor that can explain this observation.
The NP transport characteristics on the T-MOC are compared with those obtained from small animal models in Figure 7. Overall, in spite of differences in NP’s base materials, their surface properties and consequent pharmocokinetics in blood stream, general trends of NP tumor accumulation and penetration agree well, but the NPs on the T-MOC transport faster than those in vivo. The accumulation of 100 nm NPs at tumor tissue is compared in Figure 7A – 100 nm gold NPs [39, 40], 100 nm polymer micelles in colon (C26) and pancreatic (BxPC3) tumors [41], and 100 nm polystyrene NPs on T-MOC with MVECs layer or MCF-7 cells in 6mg/ml collagen matrix. In order to compare the tumor accumulation results, it has been normalized with the accumulation amount of each NP at 1 hour post injection. All the NPs are accumulated at a similar rate during earlier time period and reach a threshold value around 4 hour post injection. Compared to the in vivo accumulations, the threshold values on the T-MOC platforms are higher. This is thought to be primarily due to continuous perfusion of NPs on the T-MOC platform, in contrast to rapid in vivo clearance from blood stream [2, 7]. In order to accurately mimic the in vivo transport, temporal change of NP concentration in blood should be considered.
Figure 7.
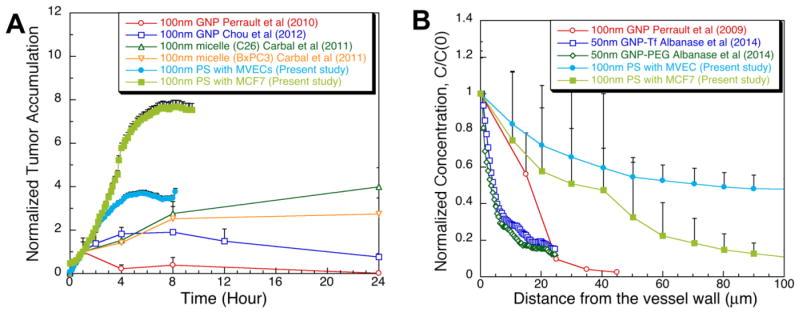
Comparison of NP transport on the T-MOC with the small animal models. (A) Tumor accumulation of NPs: 100 nm gold NPs [39, 40], 100 nm polymer micelles in colon (C26) and pancreatic (BxPC3) tumors [41], and 100 nm polystyrene NPs on T-MOC with MVECs layer or MCF-7 cells in 6mg/ml collagen matrix. All the accumulation results were normalized to the accumulation amount of each NP at 1 hour post injection. (B) Interstitial transport of NPs: 100 nm gold NPs at 8 hours post injection [39], 50 nm gold NPs coated with transferring (Tf) or polyethylene glycol (PEG) at 48 hours post injection, and 100 nm polystyrene NPs on T-MOC with MVECs layer or MCF-7 cells in 6mg/ml collagen matrix at 8 hours post infusion. The spatial concentration was normalized with the concentration at the vessel wall or the edge of the capillary channel. Error bars are shown in only one direction for clarity.
Interestingly, between the accumulations on the T-MOCs, that on the T-MOC with MVECs is much closer to the in vivo results even though it is made with 1000 nm pore membrane. The presence of MVECs on the membrane seems to provide more realistic environment for NP-endothelium and transvascular transport. The combined cell monolayer and nanoporous membrane interacts with nanoparticles in multiple ways and their decreased delivery cannot solely be attributed to the thickness of the monolayer. The cell density variation, i.e., the distribution of inter-cellular gaps as the ones observed in Figure 2C, is considered to be an important factor in defining the locations of high and low permeability across the capillary wall. Since the size of these gaps is observed to be larger than the membrane pore size, we believe the effective cut-off diameter still approaches that of membrane i.e., 1,000 nm. The effective pore density on the other hand is significantly reduced by the presence of cells, which can explain the overall decreased transport. Moreover the transport can occur through either inter-cellular gaps, or trans-cellular conduits, referred as vesiculo-vacuolar organelles [42]. Therefore size and density of these conduits across the endothelial layer are also expected to contribute to vascular permeability. The transport across the combined cell and membrane layer on the T-MOC platform warrants further characterization.
The penetration depth into tumor interstitial space is compared in Figure 7B – 100 nm gold NPs at 8 hours post injection [39], 50 nm gold NPs coated with transferring (Tf) or polyethylene glycol (PEG) at 48 hours post injection, and 100 nm polystyrene NPs on T-MOC with MVECs layer or MCF-7 cells in 6mg/ml collagen matrix at 8 hours post infusion. Similar to the tumor accumulation, NPs penetrate faster on the T-MOC compared to the same size NPs on the in vivo [39]. However, the T-MOC with MCF-7 cells in the interstitial channel provide much closer results to the in vivo study [39] than the T-MOC with MVECs. This implies the importance of cell packing density to the interstitial transport. This comparison also illustrates the major advantage of the T-MOC, which can systematically control the tumor microenvironmental parameters so that the ambiguity of small animal tumor microenvironment can be elucidated.
The present results also imply that NP design criteria for targeted delivery should be further developed considering the dynamic interactions of NPs within the tumor microenvironment. For example, as shown in Figure 3, extravasation of 200 nm NPs substantially decreased even though the cut-off pore size of the membrane was two times larger than the NP size. Although the cut-off pore diameter is still one of the major design criteria for NP-mediated targeted delivery, the size window of effective NP delivery seems to be much narrower than what has been estimated by the EPR effects. In order to deliver the majority of the administered NPs to target tumors through these multiple transport barriers, NPs should be designed in consideration of the complex transport processes in vivo.
Conclusions
In order to develop more effective targeted delivery strategies, quantitative understanding of the dynamic transport behavior of NPs is essential. Currently available tumor models are not adequate to achieve this goal. Conventional static in vitro systems, such as cell monolayers do not provide the right environment to study these complex in vivo transport processes. Small animal xenograft models have been used as a valuable platform to characterize the in vivo behavior of the NPs, but their predictions are not always translated for human outcomes [25, 26]. Even successful animal models only provide end results with limited information on the tumor environmental parameters, which is essential for mechanistic understanding of the in vivo behavior of the NPs. Thus, a new model system is greatly desired, in which the tumor microenvironmental parameters can be systematically and independently controlled, but at the same time the dynamic interactions among the fluids, ECM, cells and NPs are maintained. The present T-MOC can address many of these challenges and can provide high content screening capability of numerous NP designs, which can bridge the gap between different model systems to extrapolate cell culture, and animal models to human response.
Supplementary Material
Acknowledgments
This work was supported by NSF CBET-1009465, NIH CA129287 and Collaboration in Translational Research Award from Indiana Clinical and Translational Sciences Institute, funded in part by UL1 TR000006 from NIH. BH was also supported by B.S.F. Schaefer Award, Discovery Park Fellowship, and an Incentive Grant Program from Purdue University.
Footnotes
Publisher's Disclaimer: This is a PDF file of an unedited manuscript that has been accepted for publication. As a service to our customers we are providing this early version of the manuscript. The manuscript will undergo copyediting, typesetting, and review of the resulting proof before it is published in its final citable form. Please note that during the production process errors may be discovered which could affect the content, and all legal disclaimers that apply to the journal pertain.
References
- 1.Bae YH, Mrsny RJ, Park K. Cancer Targeted Drug Delivery: An Elusive Dream. Springer; 2013. [Google Scholar]
- 2.Kwon IK, Lee SC, Han B, Park K. Analysis on the current status of targeted drug delivery to tumors. J Control Release. 2012;164:108–114. doi: 10.1016/j.jconrel.2012.07.010. [DOI] [PMC free article] [PubMed] [Google Scholar]
- 3.Kim BY-S, Rutka JT, Chan WCC. Nanomedicine. New England Journal of Medicine. 2010;363:2434–2443. doi: 10.1056/NEJMra0912273. [DOI] [PubMed] [Google Scholar]
- 4.Ozcelikkale A, Ghosh S, Han B. Multifaceted transport characteristics of nanomedicine: needs for characterization in dynamic environment. Mol Pharm. 2013;10:2111–2126. doi: 10.1021/mp3005947. [DOI] [PubMed] [Google Scholar]
- 5.Yuan F, Dellian M, Fukumura D, Leunig M, Berk DA, Torchilin VP, Jain RK. Vascular Permeability in a Human Tumor Xenograft: Molecular Size Dependence and Cutoff Size. Cancer Research. 1995;55:3752–3756. [PubMed] [Google Scholar]
- 6.Matsumura Y, Maeda H. A new concept for macromolecular therapeutics in cancer chemotherapy: mechanism of tumoritropic accumulation of proteins and the antitumor agent SMANCS. Cancer Res. 1986;46:6387–6392. [PubMed] [Google Scholar]
- 7.Bae YH, Park K. Targeted drug delivery to tumors: Myths, reality and possibility. Journal of Controlled Release. 2011;153:198–205. doi: 10.1016/j.jconrel.2011.06.001. [DOI] [PMC free article] [PubMed] [Google Scholar]
- 8.Park K. Facing the Truth about Nanotechnology in Drug Delivery. ACS Nano. 2013;7:7442–7447. doi: 10.1021/nn404501g. [DOI] [PMC free article] [PubMed] [Google Scholar]
- 9.Jain RK. Transport of molecules, particles, and cells in solid tumors. Annual Review of Biomedical Engineering. 1999;1:241–263. doi: 10.1146/annurev.bioeng.1.1.241. [DOI] [PubMed] [Google Scholar]
- 10.Cho EJ, Holback H, Liu KC, Abouelmagd SA, Park J, Yeo Y. Nanoparticle Characterization: State of the Art, Challenges, and Emerging Technologies. Molecular Pharmaceutics. 2013;10:2093–2110. doi: 10.1021/mp300697h. [DOI] [PMC free article] [PubMed] [Google Scholar]
- 11.Teicher BA. Tumor models for efficacy determination. Mol Cancer Ther. 2006;5:2435–2443. doi: 10.1158/1535-7163.MCT-06-0391. [DOI] [PubMed] [Google Scholar]
- 12.Kim JB. Three-dimensional tissue culture models in cancer biology. Semin Cancer Biol. 2005;15:365–377. doi: 10.1016/j.semcancer.2005.05.002. [DOI] [PubMed] [Google Scholar]
- 13.Chang TT, Hughes-Fulford M. Monolayer and Spheroid Culture of Human Liver Hepatocellular Carcinoma Cell Line Cells Demonstrate Distinct Global Gene Expression Patterns and Functional Phenotypes. Tissue Engineering: Part A. 2009;15:559–567. doi: 10.1089/ten.tea.2007.0434. [DOI] [PMC free article] [PubMed] [Google Scholar]
- 14.Fischbach C, Chen R, Matsumoto T, Schmelzle T, Brugge JS, Polverini PJ, Mooney DJ. Engineering tumors with 3D scaffolds. Nat Methods. 2007;4:855–860. doi: 10.1038/nmeth1085. [DOI] [PubMed] [Google Scholar]
- 15.Kenny PA, Lee GY, Myers CA, Neve RM, Semeiks JR, Spellman PT, Lorenz K, Lee EH, Barcellos-Hoff MH, Petersen OW, Gray JW, Bissell MJ. The morphologies of breast cancer cell lines in three-dimensional assays correlate with their profiles of gene expression. Mol Oncol. 2007;1:84–96. doi: 10.1016/j.molonc.2007.02.004. [DOI] [PMC free article] [PubMed] [Google Scholar]
- 16.Dufau I, Frongia C, Sicard F, Dedieu L, Cordelier P, Ausseil F, Ducommun B, Valette A. Multicellular tumor spheroid model to evaluate spatio-temporal dynamics effect of chemotherapeutics: application to the gemcitabine/CHK1 inhibitor combination in pancreatic cancer. BMC Cancer. 2012;12:15. doi: 10.1186/1471-2407-12-15. [DOI] [PMC free article] [PubMed] [Google Scholar]
- 17.Swartz MA, Kaipainen A, Netti PA, Brekken C, Boucher Y, Grodzinsky AJ, Jain RK. Mechanics of interstitial-lymphatic fluid transport: theoretical foundation and experimental validation. Journal of Biomechanics. 1999;32:1297–1307. doi: 10.1016/s0021-9290(99)00125-6. [DOI] [PubMed] [Google Scholar]
- 18.Song JW, Gu W, Futai N, Warner KA, Nor JE, Takayama S. Computer-controlled microcirculatory support system for endothelial cell culture and shearing. Anal Chem. 2005;77:3993–3999. doi: 10.1021/ac050131o. [DOI] [PubMed] [Google Scholar]
- 19.Verkman AS. Drug discovery and epithelial physiology. Curr Opin Nephrol Hypertens. 2004;13:563–568. doi: 10.1097/00041552-200409000-00013. [DOI] [PubMed] [Google Scholar]
- 20.Loessner D, Stok KS, Lutolf MP, Hutmacher DW, Clements JA, Rizzi SC. Bioengineered 3D platform to explore cell-ECM interactions and drug resistance of epithelial ovarian cancer cells. Biomaterials. 2010;31:8494–8506. doi: 10.1016/j.biomaterials.2010.07.064. [DOI] [PubMed] [Google Scholar]
- 21.Huang CP, Lu J, Seon H, Lee AP, Flanagan LA, Kim HY, Putnam AJ, Jeon NL. Engineering microscale cellular niches for three-dimensional multicellular co-cultures. Lab on a Chip. 2009;9:1740–1748. doi: 10.1039/b818401a. [DOI] [PMC free article] [PubMed] [Google Scholar]
- 22.Albanese A, Lam AK, Sykes EA, Rocheleau JV, Chan WCC. Tumor-on-a-chip provides an optical window into nanoparticle tissue transport. Nature Communications. 2013;4:2718. doi: 10.1038/ncomms3718. [DOI] [PMC free article] [PubMed] [Google Scholar]
- 23.Polacheck WJ, Charest JL, Kamm RD. Interstitial flow influences direction of tumor cell migraion through competing mechanisms. PNAS. 2011;108:11115–11120. doi: 10.1073/pnas.1103581108. [DOI] [PMC free article] [PubMed] [Google Scholar]
- 24.Walsh CL, Babin BM, Kasinskas RW, Foster JA, McGarry MJ. A multipurpose microfluidics device designed to mimic microenvironment gradients and develop targeted cancer therapeutics. Lab on a Chip. 2009;9:545–554. doi: 10.1039/b810571e. [DOI] [PMC free article] [PubMed] [Google Scholar]
- 25.Stirland DL, Nichols JW, Miura S, Bae YH. Mind the gap: A survey of how cancer drug carriers are susceptible to the gap between research and practice. Journal of Controlled Release. 2013;172:1045–1064. doi: 10.1016/j.jconrel.2013.09.026. [DOI] [PMC free article] [PubMed] [Google Scholar]
- 26.Florence AT. Pharmaceutical nanotechnolgy: More than size. International Journal of Pharmaceutics. 2007;339:1–2. doi: 10.1016/j.ijpharm.2007.06.009. [DOI] [PubMed] [Google Scholar]
- 27.Becher OJ, Holland EC. Genetically engineered models have advantages over xenografts for preclinical studies. Cancer Res. 2006;66:3355–3358. doi: 10.1158/0008-5472.CAN-05-3827. [DOI] [PubMed] [Google Scholar]
- 28.Frese KK, Tuveson DA. Maximizing mouse cancer models. Nature Reviews Cancer. 2007;7:645–658. doi: 10.1038/nrc2192. [DOI] [PubMed] [Google Scholar]
- 29.Damia G, D’Incalci M. Contemporary pre-clinical development of anticancer agents - What are the optimal preclinical models? Eur J Cancer. 2009;45:2768–2781. doi: 10.1016/j.ejca.2009.08.008. [DOI] [PubMed] [Google Scholar]
- 30.Teo KY, DeHoyos TO, Dutton JC, Grinnell F, Han B. Effects of freezing-induced cell-fluid-matrix interactions on the cells and extracellular matrix of engineered tissues. Biomaterials. 2011;32:5380–5390. doi: 10.1016/j.biomaterials.2011.04.008. [DOI] [PMC free article] [PubMed] [Google Scholar]
- 31.Kedem O, Katchalsky A. Thermodynamic analysis of the permeability of biological membranes to non-electrolytes. Biochim Biophys Acta. 1958;27:229–246. doi: 10.1016/0006-3002(58)90330-5. [DOI] [PubMed] [Google Scholar]
- 32.Heldin CH, Rubin K, Pietras K, Ostman A. High interstitial fluid pressure - an obstacle in cancer therapy. Nature Review Cancer. 2004;4:806–813. doi: 10.1038/nrc1456. [DOI] [PubMed] [Google Scholar]
- 33.Fang J, Nakamura H, Maeda H. The EPR effect: Unique features of tumor blood vessels for drug delivery, factors involved, and limitations and augmentation of the effect. Advanced Drug Delivery Reviews. 2011;63:136–151. doi: 10.1016/j.addr.2010.04.009. [DOI] [PubMed] [Google Scholar]
- 34.Netti PA, Berk DA, Swartz MA, Grodzinsky AJ, Jain RK. Role of extracellular matrix assembly in interstitial transport in solid tumors. Cancer Res. 2000;60:2497–2503. [PubMed] [Google Scholar]
- 35.Brown E, Mckee TD, Tomaso Ed, Pluen A, Seed B, Boucher Y, Jain RK. Dynamic imaging of collagen and its modulation in tumors in vivo using second-harmonic generation. Nature Medicine. 2003;9:796–800. doi: 10.1038/nm879. [DOI] [PubMed] [Google Scholar]
- 36.Pluen A, Boucher Y, Ramanujan S, McKee TD, Gohongi T, di Tomaso E, Brown EB, Izumi Y, Campbell RB, Berk DA, Jain RK. Role of tumor-host interactions in interstitial diffusion of macromolecules: Cranial vs. subcutaneous tumors. Proceedings of the National Academy of Sciences of the United States of America. 2001;98:4628–4633. doi: 10.1073/pnas.081626898. [DOI] [PMC free article] [PubMed] [Google Scholar]
- 37.Egeblad M, Rasch MG, Weaver WM. Dynamic interplay between the collaged scaffold and tumor evolution. Current Opinion in Cell Biology. 2010;22:697–706. doi: 10.1016/j.ceb.2010.08.015. [DOI] [PMC free article] [PubMed] [Google Scholar]
- 38.Narang AS, Varia S. Role of tumor vascular architecture in drug delivery. Advanced Drug Delivery Reviews. 2011;63:640–658. doi: 10.1016/j.addr.2011.04.002. [DOI] [PubMed] [Google Scholar]
- 39.Perrault SD, Walkey C, Jennings T, Fischer HC, Chan WCW. Mediating tumor targeting efficiency of nanoparticles through design. Nano Letters. 2010;9:1909–1915. doi: 10.1021/nl900031y. [DOI] [PubMed] [Google Scholar]
- 40.Chou LYT, Chan WCW. Fluorescence-Tagged Gold Nanoparticles for Rapidly Characterizing the Size-Dependent Biodistribution in Tumor Models. Advanced Healthcare Materials. 2012;1:714–721. doi: 10.1002/adhm.201200084. [DOI] [PubMed] [Google Scholar]
- 41.Cabral H, Matsumoto Y, Mizuno K, Chen Q, Murakami M, Kimura M, Terada Y, Kano MR, Miyazono K, Uesaka M, Nishiyama N, Kataoka K. Accumulation of sub-100 nm polymeric micelles in poorly permeable tumours depends on size. Nat Nano. 2011;6:815–823. doi: 10.1038/nnano.2011.166. [DOI] [PubMed] [Google Scholar]
- 42.Feng D, Nagy JA, Pyne K, Hammel I, Dvorak HF, Dvorak AM. Pathways of macromolecular extravasation across microvascular endothelium in response to VPF VEGF and other vasoactive mediators. Microcirculation. 1999;6:23–44. [PubMed] [Google Scholar]
Associated Data
This section collects any data citations, data availability statements, or supplementary materials included in this article.