

Summary
Paused RNA Polymerase (Pol II) is a pervasive feature of Drosophila embryos and mammalian stem cells, but its role in development is uncertain. Here, we demonstrate that there is a spectrum of paused Pol II, which determines the “time to synchrony”--the time required to achieve coordinate gene expression across the different cells of a tissue. To determine whether synchronous patterns of gene activation are significant in development, we manipulated the timing of snail expression, which controls the coordinated invagination of ∼1000 mesoderm cells during gastrulation. Replacement of the strongly paused snail promoter with moderately paused or nonpaused promoters results in stochastic activation of snail expression and the progressive loss of mesoderm invagination. Computational modeling of the dorsal-ventral patterning network recapitulates these variable and bistable gastrulation profiles, and emphasizes the importance of timing of gene activation in development. We conclude that paused Pol II and transcriptional synchrony are essential for coordinating cell behavior during morphogenesis.
Keywords: Pol II pausing, promoter, Drosophila, transcription, synchrony, morphogenesis, temporal coordination, gastrulation, timing
Introduction
The early Drosophila embryo is the premier system for visualizing gene activity in animal development. In a period of just one hour, broadly distributed maternal determinants generate localized patterns of gene activity, including segmentation stripes of gene expression (Chen et al., 2012). A variety of studies suggest that enhancers, typically 300-500 bp in length, are responsible for determining where and when developmental control genes are switched on and off (Ong and Corces, 2011). With few exceptions, localized patterns of expression can be attributed to discrete enhancers located upstream, downstream or within the gene of interest.
The enhancer is therefore seen as the key agent of differential gene activity in animal development (Ong and Corces, 2011). Considerably less is known about the role of the promoter in the regulation of the spatial or temporal limits of gene expression, although they are known to control the rates of RNA synthesis (Juven-Gershon and Kadonaga, 2010). In the simplest view, enhancers determine the limits of gene expression (where and when genes are active), while the promoter controls the levels of expression (e.g., how many transcripts are produced in a given unit of time).
The purpose of this study is to determine whether the promoter regions of developmental control genes can influence the timing or spatial limits of gene expression in the early Drosophila embryo. We were motivated by the recent finding that many developmental control genes contain paused RNA Polymerase (Pol II) prior to their activation during embryogenesis (Adelman and Lis, 2012; Levine, 2011). The function of paused Pol II is uncertain, despite its apparent prevalence (∼30% of all protein coding and noncoding genes) in both Drosophila embryos and mammalian stem cells (Guenther and Young, 2012).
The prototypic example of paused Pol II, Drosophila heat shock genes, underlies rapid induction of gene expression in response to stress (Boehm et al., 2003). There is also evidence that paused Pol II serves to keep promoters “open” by excluding or diminishing the occurrence of positioned nucleosomes that occlude the transcription start site in cultured cells (Gilchrist et al., 2010). Recent quantitative imaging methods suggest that paused Poll II influences synchronous induction of gene expression across the different cells of presumptive tissues in the early Drosophila embryo (Boettiger and Levine, 2009).
In the latter study, quantitative in situ hybridization assays were used to detect the first nascent transcripts encoded by different developmental control genes, within the first 10-20 min after the onset of expression in precellular embryos, ∼2 hrs after fertilization. Genes were classified as synchronous if nascent transcripts were detected in over 50% of the nuclei that will eventually express a given gene, or stochastic if expressed in fewer than 50%. Most paused genes exhibited synchronous patterns of activation, while most nonpaused genes displayed stochastic expression. The evidence linking paused polymerase and synchrony was strictly correlative, and there is no evidence that these modes of activation are significant in development.
Here we employ quantitative imaging (Bothma et al., 2011; Perry et al., 2010), whole-genome Pol II binding assays (Zeitlinger et al., 2007), and BAC transgenesis (Venken et al., 2006) to examine the function of paused Pol II in the early Drosophila embryo. Evidence is presented that minimal promoter sequences, ∼100-200 bp centered around the +1 transcription start site, are sufficient for establishing paused Pol II and mediating rapid, synchronous activation of gene expression in transgenic embryos. Those genes containing high levels of paused Pol II achieve coordinate expression more rapidly than those containing low levels.
To determine whether the “time to synchrony” is important in development, we manipulated the coordinate expression of snail (sna) (Slug/Sna2 in vertebrates), a major determinant of epithelial-mesenchyme transitions (EMT) in animal development. In Drosophila, snail is expressed in ∼1000 cells comprising the presumptive mesoderm (Kosman et al., 1991; Leptin and Grunewald, 1990). These cells undergo coordinated invagination during gastrulation, within 90 min of the onset of snail expression (Leptin, 2005; Sweeton et al., 1991). To determine whether synchronous activation of snail expression is essential for coordinated invagination of the mesoderm, we replaced the native snail promoter with those from moderately paused (short gastrulation; Chordin) or nonpaused (thisbe; Fgf8) genes. These heterologous promoters result in less synchronous patterns of snail activation, and a progressive reduction in mesoderm invagination during gastrulation. We therefore conclude that paused Pol II and transcriptional synchrony are essential for coordinating cell behavior during morphogenesis.
Results
Previous studies suggested a correlation between paused Pol II and synchronous patterns of gene activation in the Drosophila embryo. Moreover, computational analyses identified sequence elements that are associated with promoters containing paused Pol II, including GAGA and pause button (PB) motifs (e.g., Gilchrist et al., 2010; Hendrix et al., 2008; Lee et al., 2008; Shopland et al., 1995). These observations raise the possibility that the core promoter might be sufficient to determine whether a gene is paused or not paused, and activated in a synchronous or stochastic fashion.
As a first step towards testing this possibility we examined the regulation of two Dpp (TGFß) target genes, pannier (pnr; GATA4) and tailup (tup; Islet-1), transcription factors essential for the specification of a variety of dorsal tissues, including the heart (Vincent and Buckingham, 2010). These genes are co-activated in the dorsal ectoderm of 2-hour embryos (e.g., Ashe et al., 2000), but nonetheless display opposite Pol II binding profiles. tup is strongly paused, while pnr lacks Pol II (Zeitlinger et al., 2007). The use of quantitative imaging methods revealed differences in their activation profiles that were missed in previous studies, as discussed below (Figure 1).
Figure 1. BMP/Dpp target genes exhibit distinct coordination profiles.

(A-H) cc14 embryos hybridized with tup and pnr fluorescent (magenta) intronic probes for detecting nascent transcripts (nuclei stained with DAPI (blue)). Raw images for tup and pnr transcripts are shown in B, D, and the corresponding processed images are shown in B′ and D′. Images shown in B and D are magnifications of bracketed regions in A and C. (E-H) tup (E,G) and pnr (F,H) expression during mid (E,F) and late (G,H) cc14. (I,J) Dynamics of gene expression during cc14 based on the fraction of nuclei containing nascent transcripts. (I) Endogenous tup expression (blue) reaches 50% of the complete pattern (t50=26) 15min earlier than does pnr (black) (t50=41). (J) There is a delay in tup dynamics when the minimal promoter of a tup BAC transgene (tupY) is replaced by that of pnr (tupY-PnrPr) (see also Figure S2). The red curves represent the fitted curves (using a cumulative gamma distribution) to the data depicted in panels I and J (see supplementary information, Figure S1 and Table S1). T50 values are determined from these fitted curves.
Temporal Coordination of Dpp Target Genes
tup is activated by high levels of the Dpp gradient while pnr is triggered by low levels (Figure 1A-H) (Ashe et al., 2000). These distinctive spatial expression patterns depend on previously identified tup and pnr enhancers. Quantitative imaging methods reveal that they also exhibit dissimilar temporal profiles (Figure 1E-I).
It was previously shown that tup contains paused Pol II and is activated in a synchronous fashion, whereas, pnr lacks Pol II and exhibits stochastic expression (Boettiger and Levine, 2009). We developed high-resolution confocal visualization and novel image segmentation methods to measure the “time to synchrony”, the degree of temporal coordination in gene activation during nuclear cleavage cycle (cc) 14, the one-hour interval preceding gastrulation (Figure 1A-H). The ∼6000 cells comprising the pregastrula embryo are synchronized within the cell cycle, thereby permitting direct comparisons of transcriptional coordination. Quantitative FISH assays permit detection of nascent transcripts shortly after the onset of gene expression (e.g., Bothma et al., 2011). In this assay, activation is defined as the time it takes for 50% of the nuclei to express nascent transcripts (t50). Using a cumulative gamma distibution, we fit a curve to each experimental dataset (see Figure S1, Supplemental Information). t50 values are calculated by measuring the fraction of nuclei that express a given gene for each fitted activation profile. Pregastrula cc14 embryos are selected based on nuclear density and embryo morphology and then ordered relative to one another based on the fraction of the expression pattern containing nascent transcripts. The collections are designed to ensure that embryos are distributed in an unbiased way across the entirety of cc14. This approach allows us to measure the t50 values with an accuracy of +/- 5 min (see Table 1, Figure S1, Table S1 and Supplemental Information).
Table1.
Summary of the t50 values for all the constructs used in this study.
T50 corresponds to the time it takes for an embryo to show nascent transcription in 50% of the pattern. T50 is an estimated time, based on the measured activated kinetics of many embryos (see also Figure S1 and Table S1)
| Promoter | t50 Time (min) | Uncertainty from simulations (min) |
|---|---|---|
| PnrPr Endo | 41 | 3 |
| TupPr Endo | 26 | 3 |
| Tup-Y BAC | 32 | 3 |
| Tup-Y-PnrPr BAC | 53 | 2 |
| PnrE-TupPr NelfE/Spt5 | 39 | 4 |
| PnrE-TupPrShort | 31 | 3 |
| PnrE-TupPr Trl | 30 | 4 |
| PnrE-TupPr | 15 | 3 |
| PnrE-SnaPr | 24 | 3 |
| PnrE-Hsp70Pr | 28 | 4 |
| PnrE-SogPr | 38 | 4 |
| PnrE-ThsPr | 55 | 2 |
| PnrE-PnrPr | 74 | 4 |
| SnaE-SnaPr | 3 | 2 |
| SnaE-SogPr | 22 | 4 |
| SnaE-ThsPr | 40 | 3 |
| SnaE-PnrPr | 42 | 3 |
| SogE-TupPr | 1 | 0.6 |
| SogE-SnaPr | 1 | 0.6 |
| SogE-PnrPr | 35 | 7 |
The endogenous tup and pnr genes exhibit distinct t50 activation profiles: tup achieves t50 expression ∼26 min after the onset of cc14, while pnr does not exhibit comparable expression for another 15 min (Table 1). This represents a significant delay since the entire cc14 interphase extends for just 55 min (see below). To determine whether these divergent temporal expression profiles are due to enhancer or promoter sequences, we created a BAC transgene encompassing the entire tup transcription unit and flanking regulatory DNAs that recapitulates the rapid and synchronous activation profile of the endogenous tup locus (Figure 1J, Figure S2). In these experiments the tup transcription unit was replaced with the yellow reporter gene to facilitate detection of nascent transcripts (Perry et al., 2010). There is a slight delay in the t50 value of the BAC transgene (∼32 min) as compared with the endogenous tup locus (∼26 min) (Table 1), which is likely due to the heterologous site of transgene insertion, a slower rate of yellow transcription, or the use of heterozygous embryos to measure expression of BAC transgenes (see Figure 1I, J and legends).
We next examined the activation profile obtained upon replacement of the paused tup promoter with the non-paused pnr promoter (Figure 1J, Figure S2). The modified BAC transgene is identical to the control, except for the substitution of just 200 bp centered around the +1 transcription start site of the pnr promoter (Figure S3). The modified transgene was inserted into the same chromosomal location as the control transgene, thereby permitting direct quantitative comparisons of their activation dynamics. Surprisingly, this 200 bp substitution within the large 60 kb BAC transgene is sufficient to convert the rapid and synchronous tup-yellow expression pattern into a slow and stochastic mode of activation (Figure 1J).
The modified transgene exhibits a t50 value of 53 min, which is considerably slower than the t50 values seen for the endogenous tup locus (26 min) or unmodified tup BAC transgene (32 min). It is somewhat slower than the t50 value seen for the endogenous pnr locus (41 min), although the differential timing of the tup vs. pnr promoters (Δt50), is similar for the endogenous loci and BAC transgenes, at 15 min and 21 min, respectively (Table 1). These findings suggest that the pnr promoter, not enhancers, is the prime determinant of its slow and stochastic activation profile during development.
Minimal Promoter Sequences are Sufficient to Establish Paused Pol II
The preceding results suggest that minimal promoter sequences might be sufficient to determine whether a gene is activated in a synchronous or stochastic fashion. To determine whether they are also sufficient for determining the presence or absence of paused Pol II, we analyzed minigenes containing the pnr intronic enhancer (pnrE), tup promoter (tupPr), and yellow reporter gene (pnrE>tupPr/yellow). This minigene exhibits synchronous expression in the the dorsal ectoderm of wild-type embryos (see below), but is inactive in Toll10b mutants due to the absence of Dpp signaling (Schneider et al., 1991). Both the endogenous tup locus and the minigene nonetheless contain paused Pol II in these “silent” Toll10b embryos (Figure 2A,B); as expected, the endogenous pnr locus lacks paused Pol II (Zeitlinger et al., 2007) (Table S2). Permanganate footprint assays identified hypersensitive thymidine residues at positions +48 and +51 nucleotides downstream of the tup transcription start site in transgenic embryos (Figure 2C), strengthening the evidence that the stalled Pol II identified at the tup promoter represents promoter-proximal paused Pol II.
Figure 2. The minimal promoter mediates paused Pol II.
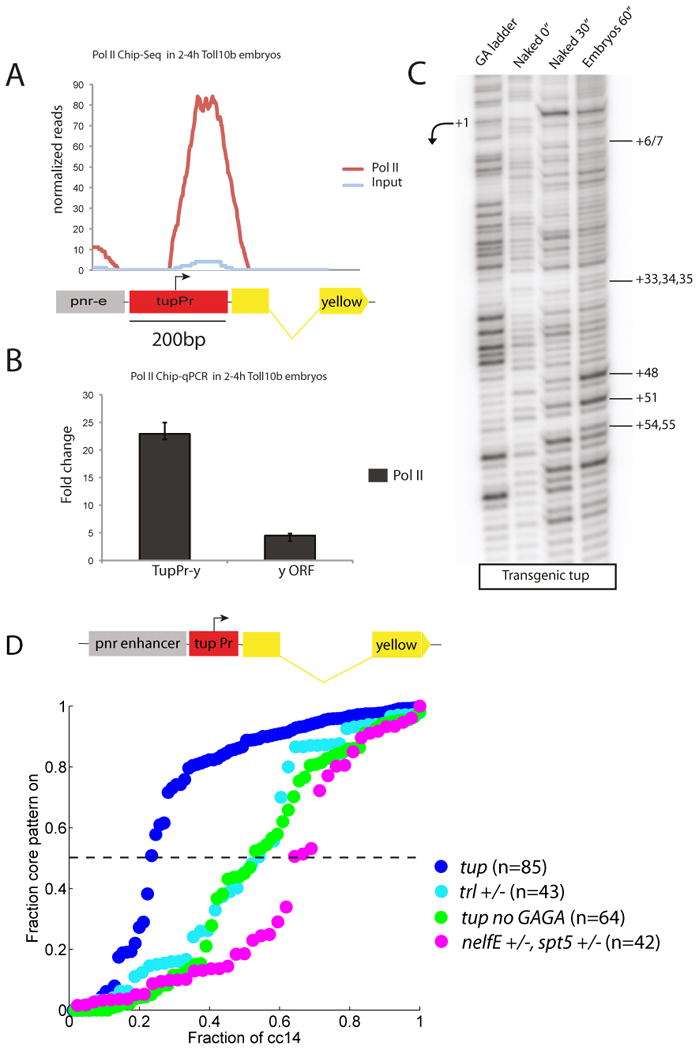
(A) Pol II Chip-Seq reads of the pnr/tup transgene in a tissue where it is silent. (B) Pol II ChIP followed by qPCR showing enrichment at the tupPr/yellow junction. Error bars represent SD. (C) Permanganate footprinting reveals a promoter-proximal “transcription bubble” in mutant embryos where the tupPr/yellow transgene is silent. (D) Reduced levels of maternal Trl (turquoise) or NelfE/Spt5 (pink) cause a delay in the expression profile of the pnrE>tupPr transgene. A similar effect is observed with a truncated version of the tup promoter lacking the upstream GAGA sites.
Thus, the 200 bp tup promoter region is sufficient for the establishment of paused Pol II (and synchronous expression, as shown below). It contains key signatures of paused promoters (Gilchrist et al., 2010; Hendrix et al., 2008; Lee et al., 2008; Shopland et al., 1995), including 5′ GAGA elements located ∼100 bp upstream of the transcription start site, and PB motifs positioned +54 to +64 bp downstream of the start site, in the vicinity of the hypersensitive thymidine residues identified by permanganate protection assays (Figure 2C and Figure S3). We therefore conclude that minimal promoter sequences are sufficient to establish paused Pol II in vivo, in the Drosophila embryo. In principle, any gene can be artificially “paused” or “de-paused” by exchanging minimal promoter sequences. Such an approach may be relevant to the stem cell field since some of the key determinants of pluripotency (e.g., Nanog) exhibit stochastic expression among the different ICM cells of mouse embryos (Kalmar et al., 2009; Nichols and Smith, 2011).
Promoter-Associated Elements Influence Transcriptional Synchrony
To establish a sharper connection between “pausing elements” in the tup promoter and transcriptional synchrony, we expressed the pnrE>tupPr/yellow transgene in embryos containing diminished levels of the GAGA-binding protein, GAF (or Trl). Previous studies implicated GAGA and Trl in the stable association of paused Pol II within the proximal promoter of Hsp70 (Fay et al., 2011; Lee et al., 1992; Shopland et al., 1995). The tup promoter region contains GAGA elements located ∼100 bp upstream of the transcription start site (Figure S3), and whole-genome assays confirm GAF/Trl binding to this region in the Drosophila embryo (Schuettengruber et al., 2009). Reduced levels of Trl caused an ∼20 min delay in the activation of the pnrE>tupPr/yellow transgene, as compared with wild-type embryos (Figure 2D, Table1), similar to the activation profile mediated by the nonpaused thisbe promoter (see below). An equivalent delay is observed with a truncated tup promoter lacking upstream GAGA elements, but retaining all core elements such as the INR (Figure 2D, Table1). These studies suggest a close correlation between Trl/GAGA and the temporal coordination of gene activation.
The stability of paused Pol II also depends on negative elongation factors, such as NELF and Spt5, which bind nascent transcripts shortly after the onset of transcription (Gilchrist et al., 2010; Li and Gilmour, 2011). There is an ∼ 30 min delay in the activation profile of the pnrE>tupPr/yellow transgene in embryos containing reduced levels of NelfE and Spt5 (Figure 2D, Table1). Thus, the preceding findings suggest a close correlation between minimal promoter sequences, paused Pol II and the time to synchrony in the Drosophila embryo.
A Spectrum of Synchrony
Whole-genome Pol II ChIP-Seq assays suggest that genes might not be simply paused or nonpaused, and activated in a strictly synchronous or stochastic fashion. Instead, there are different levels of Pol II in the promoter regions of genes previously identified as stalled or not stalled (Figure 3F; see Zeitlinger et al., 2007). Normalized levels of paused Pol II were measured in vivo in dorsal-ventral patterning mutants containing a single embryonic tissue, in which the gene in question is silent (Figure 3F). For example, tup is not expressed in Toll10b mutant embryos since they contain only mesoderm due to the transformation of ectoderm into mesoderm. Conversely, snail is not expressed in gd7 mutant embryos, which display the reciprocal transformation of mesoderm into ectoderm. The tup and snail (sna) promoters contain significantly more Pol II sequence reads than sog in “silent” mutant embryos, even though all three genes were classified as stalled or paused in previous studies (Zeitlinger et al., 2007). Similarly, thisbe contains more Pol II than pnr, even though both genes were classified as nonstalled. Tup is consistently seen to contain the highest levels of promoter-proximal Pol II read counts in a variety of tissues (Gaertner et al., 2012).
Figure 3. A spectrum of synchrony.
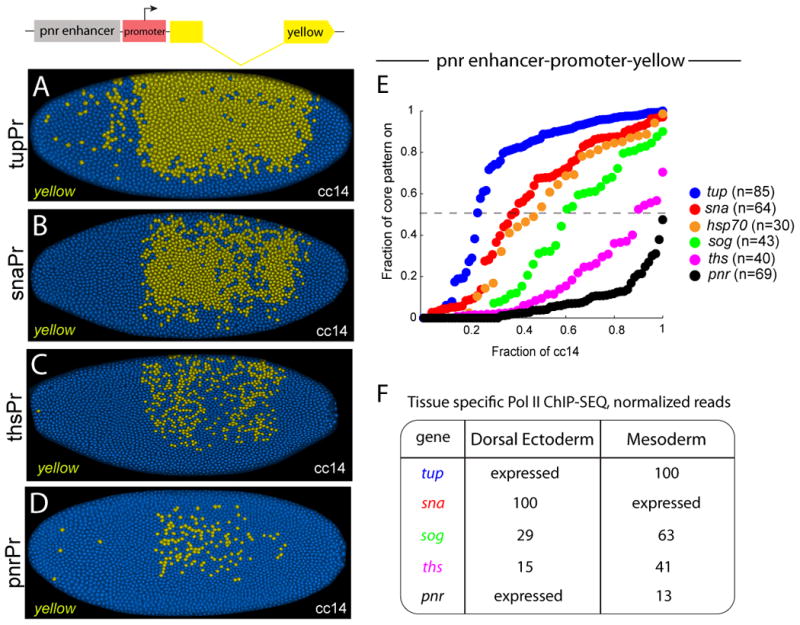
The pnr intronic enhancer (PnrE) was placed upstream of the tup, sna, Hsp70, sog, ths and pnr promoters (Pr) (see diagram in upper left). (A-D) Examples of transgenic embryos stained with a yellow intronic probe at the midpoint of cc14. The tupPr mediates synchronous expression in the dorsal ectoderm (A), while the pnrPr mediates stochastic expression (D). (E) Temporal coordination profiles during cc14. The tup promoter provides the rapid coordination profile, while the pnr promoter exhibits the slowest coordination. Sog and ths give intermediate. (F) Relative amounts of Pol II at the promoter regions of inactive genes. For actively expressed genes, we denote them as “expressed”, the normalized Pol II reads are provided in TableS2.
To investigate the significance of these different levels of Pol II, we analyzed the expression of a series of minigenes containing the pnr enhancer (pnrE) and six different promoter sequences encompassing a spectrum of paused Pol II (Figure S3). Remarkably, the activation profiles of these minigenes mirror the levels of Pol II binding (Figure 3E and Table 1). The tup promoter contains the highest levels of Pol II and exhibits a t50 value of just ∼15 min. This is followed by progressively slower profiles for sna (t50 = 24 min), hsp70 (28 min), and sog (38 min), which contain successively lower levels of Pol II.
Finally, the promoter regions of the nonpaused genes ths and pnr exhibit the slowest activation dynamics, although ths is somewhat faster (t50 = 55 min) than pnr (t50 = 74 min). A similar correlation between the levels of paused Pol II and the time to synchrony was seen for minigenes containing the sog intronic enhancer, which mediates activation in the neurogenic ectoderm (Figure S4 A-D, Table1), and for the distal snail enhancer in the mesoderm (see below).
Transcriptional synchrony and rates of RNA synthesis
The preceding findings demonstrate that the same enhancer can produce a spectrum of activation profiles in the ectoderm of early embryos. To determine the feasibility of manipulating the timing of gene expression in the presumptive mesoderm, we placed the distal (shadow) snail enhancer (snaE) (Dunipace et al., 2011; Perry et al., 2010) upstream of the sna, sog, ths, and pnr promoters and yellow reporter gene (Figure 4A-C). We observed similar relative t50 values as those obtained with the pnr enhancer (Figure 3; Table 1). The snail promoter mediates a t50 value of 3 minutes, while the more weakly paused sog promoter exhibits a 19 min delay in the t50 profile (Figure 4D, Table 1). As expected, the nonpaused ths and pnr promoters mediate even slower activation profiles (t50 = 40 and 42 min, respectively). The snaE enhancer mediates more rapid onset of expression in cc14 than the pnrE enhancer, probably due to the earlier availability of activators (e.g., Dorsal and Twist) in the mesoderm as compared with the dorsal ectoderm (e.g., pSmad). Nonetheless, after upstream activators initiate expression, the detailed temporal dynamics (t50 activation) are determined by the different promoter sequences.
Figure 4. Minimal promoters are sufficient to perturb snail temporal coordination.

The distal snail enhancer (snaE) was placed upstream of the snaPr (A), sogPr (B), and thsPr (C) promoters attached to the yellow reporter gene (see diagram in upper left). (A-C) Processed images after fluorescent in situ hybridization using a yellow intronic probe. (D) Temporal coordination profiles during cc14. (E) High resolution confocal image of yellow mRNAs encoded by the snaE>snaPr/yellow minigene. Arrowheads: individual cytoplasmic mRNAs; arrow: nascent transcripts. (F) Bar graph showing the estimated promoter strenght from the pnr, ths and sna promoters just prior to gastrulation (see Experimental Procedures and Figure S4). Error bars represent SD.
The sna, sog, and ths promoters provide a nice spectrum of activation during cc14 (t50 values of 3, 22, and 40 min, respectively), and seem ideally suited for manipulating the synchrony of snail expression in the presumptive mesoderm. Our choice of snail stems from the short lag time, less than 90 min, between the onset of transcription and morphogenesis—the coordinate invagination of the ventral mesoderm during gastrulation (see below). However, the accurate interpretation of any changes in gastrulation arising from the use of heterologous promoters requires an understanding of the relationship between t50 activation profiles and the levels of gene expression.
We expected promoters mediating slow synchrony profiles (e.g., ths) to produce weaker expression than those mediating rapid synchrony (e.g., sna promoter). Single molecule in situ hybridization assays (smFISH) (Boettiger and Levine, 2013) were employed to measure the number of yellow mRNAs produced by different yellow minigenes, snaE>pnrP/yellow, snaE>thsP/yellow, and snaE>snaP/yellow (Figure 4E). As expected, the “slow” minigenes produce lower levels of yellow mRNAs than the “fast” genes. The pnr, ths, and sna promoters produce 30 ± 10, 60 ± 20 and 100 ± 30 mRNAs/cell, respectively, in the mesoderm prior to invagination.
Modeling methods were used to estimate promoter strength based on activation kinetics (see Supplemental Information and Figure S4E-I). The different levels of yellow mRNAs produced by the ths and sna promoters can be attributed to their respective t50 activation profiles. The snaE>thsP/yellow minigene is expressed at lower levels than snaE>snaP/yellow due to its slower synchrony profile. However, once activated in a given cell, the ths promoter appears to mediate a similar rate of RNA synthesis as the sna promoter (see Supplemental Information and Figure S4E-I). Similarly, quantitative measurements suggest that the sog promoter mediates a similar rate of expression as the snail and ths promoters once activated (see below). In contrast, the low levels of yellow mRNAs produced by the pnr promoter probably result from the combination of a slow synchrony profile and a lower rate of RNA synthesis. Thus, we focused on the use of the ths and sog promoters to examine the consequences of “desynchronizing” the onset of snail expression.
Transcriptional synchrony is essential for coordinate invagination
A 25 kb snail BAC transgene encompassing the snail transcription unit, proximal enhancer, and neighboring Tim17B2 locus (which harbors the distal snail shadow enhancer) was shown to be sufficient to rescue the gastrulation defects of sna-/sna-mutant embryos (Dunipace et al., 2011; Perry et al., 2010). However, there is evidence that the proximal enhancer might attenuate snail expression by impeding access of the distal enhancer to the sna promoter (Dunipace et al., 2011) (data not shown). Consequently, we removed this enhancer in order to obtain a more direct assessment of the contributions of the different promoters in coordinating mesoderm invagination. It is important to note that the distal enhancer is sufficient for complete rescue of the gastrulation defects of sna-/sna- mutant embryos and the development of fully viable adult flies (Dunipace et al., 2011).
We employed recombineering methods to create a series of snail BAC transgenes that contain either sog or ths promoter sequences in place of the native sna promoter (replacement of ∼100-110 bp; see Figure S3). The three BAC transgenes (native sna promoter, sog promoter, or ths promoter) exhibit distinctive patterns of activation during the onset of cc14 (Figure 4G-I), concomitant with the levels of paused Pol II and the t50 synchrony values seen for the snail minigenes (Figure 4A-D).
There is a tight correlation between these activation profiles and the extent to which mesoderm invagination is rescued in sna-/sna- embryos (Figure 5). Thus, the “native” transgene containing the strongly paused sna promoter mediates a coordinated ventral furrow and robust invagination of the mesoderm (Figure 5A-D). In contrast, the transgene containing the moderately paused sog promoter produces truncated furrows (Figure 5E-H) (n=18/22), but occasionally induces nearly complete furrows approaching those seen in wild-type embryos (Figure 5G,G′) (n=4/22). Finally, the nonpaused ths promoter produces highly variable phenotypes, ranging from the complete absence of invagination (n=11/16), to erratic pockets of ingressing cells (n=3/16) (Figure 5I,J), and rarely, extended grooves of invaginating cells (n=2/16) (Figure 5K,K′). Snail mRNAs and protein are detected only in the invaginating cells of partially rescued embryos exhibiting truncated furrows or isolated pockets of ingression (Figure 5D,H,L; Figure S5 A-F). These studies suggest that the time to synchrony is a critical determinant of coordinate cell behavior in development (see below).
Figure 5. Stochastic expression of snail results in gastrulation defects.

Transgenic rescue embryos stained with a snail (sna) probe (in red) at gastrulation stages (A-C, E-G, I-K) and correspondant invaginating cells false colored in green (A′-C′, E′-G′, I′-K′) . (A-C) When sna expression is driven by a snaBAC-sna promoter lacking the primary enhancer, all embryos gastrulate normally (A, C′). Variable gastrulation defects are obtained when the sna promoter is replaced by the moderately paused sog promoter (E-G). Most embryos show pockets of ingressing cells (E, E′) and “half furrow” (F, F′) and occasional embryos show a normal furrow (G, G′). When sna is artificially depaused by replacing its promoter by the ths promoter sequence (I-K), most embryos fail to gastrulate (I-J′) but rare embryos exibit an extended groove of invaginating cells (K, K′). (D, H, L) Transgenic embryos stained with snail (red) and twist (green) antibodies at gastrulation when the ventral furrow is invaginating. See also Figure S5.
Computational Models of Gastrulation Variability
We constructed a mathematical model (Figure 6A-C) to explain the highly variable gastrulation phenotypes seen for the sna BAC transgenes containing the sog and ths promoters. Bistability of snail expression is often observed in the anterior third of the embryo encompassing ∼300 of the ∼1,000 cells comprising the ventral furrow (e.g., Figure 5E′,F′,K′). This model makes use of the wealth of knowledge about the transcription networks governing the dorsal-ventral patterning of the Drosophila embryo (reviewed by Rushlow and Shvartsman, 2012). It also draws on recent dynamic imaging of the Dorsal nuclear gradient (Kanodia et al., 2011; Kanodia et al., 2009; Liberman et al., 2009; Reeves et al., 2012), which revealed a slight narrowing of the gradient in anterior regions. Our model also invokes snail autoregulation, which is suggested by the rapid loss of snail transcripts (Hemavathy et al., 1997) and yellow transcripts from a sna BAC transgene (Figure S5G-J) in sna-/sna- null embryos. We explored different mechanisms of autoregulation and obtained the most faithful results with an indirect model, whereby Snail represses a localized ectodermal repressor via a double negative feedback loop (see Supplemental Information and Figure S6).
Figure 6. Modeling gastrulation variability: the importance of coordination.

(A) Mesodermal region of a DAPI stained embryo to show the segmentation process of the nuclei. The panel below is a schematic illustrating the neighbors (j) of a given mesodermal nuclei (i). We allow for nearest neighbor diffusion where i′th nucleus is diffusive coupled to its nearest neighbors that share a boundary (j=1:6 in this case). (B) Simplified mathematical model for Snail dynamic expression in a given nucleus (i). The key parameters are: the timing of snail activation in the particular nuclei, the concentration of the neurogenic repressor (Rep) and the concentration of activators like Dorsal (k1), number of nearest neighbors (NN) and the strength of the diffusive coupling between nuclei (D). (C) Activation curves computationaly obtained for three different promoters, sna, sog and ths. (D-F) Results of computational simulations when snail temporal coordination is affected, t50 values are indicated. See also Figures S5, S6 and S7.
Computational simulations consistently produce uniform ventral furrows when the onset of sna expression is rapid and uniform (t50 = 0-4 min after the onset of cc14) (Figure 6C,D), as seen for the native snail promoter (Figure 4I). However, slightly less coordinated patterns of activation (t50 = 4-7 min), e.g., sog promoter (Figure 4H), produce highly variable ventral furrows (Figure 6E). As the coordination is further reduced (t50 = 7-12 min) (Figure 6F), most simulations show a complete loss of the furrow, although a small fraction of simulations produce half furrows in the posterior half of the embryo, as seen for the ths promoter (Figure 4G).
The bistable, all or none invagination of the anterior mesoderm can be explained by the combination of reduced levels of the Dorsal gradient, variable activation of Snail expression and delayed synthesis of critical threshold levels of the Snail repressor (Figure 6E,F). The key insight from these simulations is that short-range diffusion among neighboring nuclei can produce sufficient levels of Snail repressor to rescue small but not large patches of snail-expressing nuclei. The decision to maintain or repress snail expression occurs during a very tight time window, ∼10-20 min after the onset of gastrulation. The key parameter underlying bistability is the time to synchrony since similar results are obtained when computer simulations are performed with a range of Hill coefficients for sna regulation and different diffusion rates for the Snail protein (see Figure S7).
Discussion
Through a combination of BAC transgenesis, whole genome ChIP assays, quantitative imaging, and computational modeling, we obtained evidence that the time to synchrony is a critical determinant of coordinate cell behavior in the Drosophila embryo. Genes containing high levels of paused Pol II are activated in a more rapid and coordinated fashion than those containing intermediate or low levels. It is conceivable that paused Pol II will prove to be an essential feature of other patterning processes requiring rapid coordination of gene expression and cell behavior. For example, pausing of Notch signaling components (e.g., Hes) might help coordinate expression of the “clock” genes underlying somitogenesis in vertebrate embryos (Saga, 2012), which occurs on a time scale similar to mesoderm specification and invagination in Drosophila (∼90 min from the onset of snail transcription to the formation of the ventral furrow).
Model for the developmental timing of gene activation
Recent studies in S2 cells suggest that developmentally regulated genes tend to contain either paused Pol II or inhibitory nucleosomes (Gilchrist et al., 2010). RNAi-mediated depletion of NELF led to reduced levels of paused Pol II and a concomitant increase in promoter-positioned nucleosomes. These studies prompted the proposal that paused Pol II might render genes poised for activation by excluding the formation of inhibitory nucleosomes at the core promoter.
It is possible that nonpaused genes mediate slow activation dynamics due to cell-cell variation in the eviction of inhibitory nucleosomes at the core promoter. If occupied by an inhibitory nucleosome, a distal enhancer will not be able to stimulate transcription as it engages the promoter. Either the enhancer must await repositioning or dynamic turnover of inhibitory nucleosomes to allow recruitment of Pol II. Either way, this process might be inherently stochastic, resulting in cell to cell variations in the onset of transcription.
In principle, this model can account for the spectrum of activation profiles seen for genes containing different levels of paused Pol II. A gene containing high levels, such as tup, is more likely to contain Pol II than an inhibitory nucleosome in a given cell at a given time as compared with genes containing little or no paused Pol II (e.g., ths and pnr, respectively). Consequently, upon induction, strongly paused genes exhibit synchronous patterns of activation since most of the promoters in the different cells of a tissue contain Pol II. In contrast, genes containing little or no paused Pol II are more likely to contain an inhibitory nucleosome in a given cell at a given time, resulting in variable delays in the onset of gene expression. Thus, the ratio of poised and inhibited states might determine the time to synchrony.
The sna gene contains lower levels of Pol II than the tup promoter (Gaertner et al., 2012). When attached to the pnrE enhancer it mediates a t50 activation profile of 24 min (Table 1), which is similar to the prototypic paused hsp70 promoter but significantly slower than the tup promoter (15 min) (see Figure 3). Recent studies in cultured cells suggest that transcription initiation can be dissociated from subsequent rounds of Pol II recruitment for p53 target genes, resulting in rapid rates of activation but low steady-state levels of mRNAs (Morachis et al., 2010). It has been suggested that strongly paused genes are not necessarily expressed at high levels due to the dwelling of Pol II within the proximal promoter at every round of transcription following activation (Gilchrist et al., 2012; Lin et al., 2011). This could reduce the rate of RNA synthesis by lowering the frequency of elongating Pol II complexes. In contrast, promoters containing weaker pausing elements might achieve higher loading of Pol II complexes due to shorter dwell times.
We propose that there is a “trade-off” between timing and levels of gene expression at paused genes. Genes containing moderate levels of paused Pol II, such as hsp70 and sna, might achieve an optimal balance between excluding inhibitory nucleosomes for synchronous activation and efficient loading of Pol II complexes. Evidence for this model is seen for the tup promoter. It mediates rapid and synchronous activation of a sna BAC transgene, but significantly weaker expression than the sna promoter (see Figure S5K-M).
Dynamic control of the dorsal-ventral patterning network
The gene regulatory network underlying the spatial control of dorsal-ventral patterning has been extensively studied (reviewed by Rushlow and Shvartsman, 2012). Considerably less is known about the temporal dynamics of this process. Indeed, developmental timing has only recently become a critical focus of study, even in well-defined systems such as the patterning of the vertebrate neural tube (Balaskas et al., 2012). Here we have shown that perturbing coordinate activation of the snail expression pattern leads to various invagination defects during gastrulation. Computational modeling (Figure 6) highlights the importance of timing in producing these defects. Delayed and asynchronous patterns of activation uncouples Snail from the other components of the dorsal-ventral patterning network, resulting in variable gaps and bistability of the ventral furrow, particularly in the anterior mesoderm. Indeed, this uncoupling results in the expression of high levels of the Dorsal and Twist activators in regions that fail to invaginate due to the delay in Snail expression (e.g., Figure 5H,L). This uncoupling of sna expression from its activators provides a vivid illustration of the importance of temporal dynamics in the control of complex developmental processes. A static gene network based on a simple Dorsal gradient affinity model does not appear to be sufficient to capture the intricacies of mesoderm morphogenesis.
The dorsal-ventral patterning network amplifies small changes in the levels of the dynamic Dorsal gradient to produce all or none patterns of sna expression. We believe that the key agent of this all or none, bistable expression of Snail is the anti-repression of competitive ectodermal repressors (Hemavathy et al., 1997). This indirect mechanism of Snail autoregulation may be the basis for producing the unusually sharp border of Snail expression at the boundary between the mesoderm and neurogenic ectoderm. This border determines whether cells become fully committed to EMT at gastrulation. Delays in coordinate sna expression are amplified by the dorsal-ventral patterning network to produce bistable gaps in the ventral furrow, particularly in anterior regions where there are slightly diminished levels of Dorsal nuclear transport.
Spectrum of pausing and cell fate decisions
Our results indicate that the continuum of Pol II pausing seen for different promoters leads to a continuum of temporal coordination in gene activation, spanning from highly stochastic to synchronous. As discussed above, synchronous activation of transcription is essential for coordinating mesoderm invagination, however the stochastic regulation of gene expression is sometimes used to provide flexibility in cell fate specification within a tissue (Eldar and Elowitz, 2010; Losick and Desplan, 2008). For example, stochastic specification mechanisms underly fate decisions in the Drosophila eye and human immune system (Duffy et al., 2012; Losick and Desplan, 2008), whereby cells must adopt alternate fates to achieve a distribution of distinct functions. For example, there is a 70:30 distribution of alternative ommatidial identities in the eyes of higher diptera that has been conserved for ∼120 MYA (Losick and Desplan, 2008). Similarly, flexibility in the behavior of B lymphocytes is important for immune regulation (Duffy et al., 2012). Modulating the levels of paused Pol II could help tune the proportion of cells that adopt different fates through such stochastic specification mechanisms.
In summary, we have presented evidence that the promoter is a key agent for coordinating gene expression in the different cells of an embryonic tissue. Minimal promoter sequences are sufficient to establish paused Pol II and mediate synchronous patterns of gene expression. There is a tight correlation between the levels of paused Pol II, the time to synchrony, and the coordination of mesoderm invagination. We therefore propose that promoters ensure exquisite control of the complex cellular processes underlying morphogenesis.
Experimental Procedures
Fly Genetics
The following fly lines were used for this study: Sna (Bl3078), NelfE (Bl1569), Spt5 (Bl8352), Trl (TrlR67), landing site line “VK33” (Bl 24871). Toll10b is a maternal dominant gain of function mutation (Schneider et al., 1991); transgenes were introduced through the males. The genetic procedure used for the snail BACs rescue experiments was performed as described previously (Perry et al., 2010). For more details, see information in the Extended Experimental Procedures.
Recombineering, Cloning and Transgenesis
BAC Recombineering was performed as described previously (Venken et al., 2006). The following CHORI BACs were used: tup BAC (84.8kb, shortened to 60kb) (CH321-68I16), sna BAC CHORI CH322-18I14-1). Sources of plasmid used and fly transgenesis using targeted integration are described in the Extended Experimental Procedures and Table S3.
Fluorescent In Situ Hybridization and Quantitative Imaging Methods
FISH experiments were performed as described in (Bothma et al., 2011). Embryos were imaged on a Carl Zeiss LSM 700 Laser Scanning microscope, equipped with a motorized stage. Images were computationally segmented to localize nuclei and nascent transcripts of mRNA. More extensive details on the image analysis are included in the Extended Experimental Procedures.
In order to measure the time to synchrony, activation curves were generated by quantifying the number of nuclei exhibiting nascent transcripts for various embryos at various time points during cc14. By fitting a cumulative gamma distribution, the t50 parameter was evaluated. Detailed description of this assay is provided in the Extended Experimental Procedures.
Pol II ChIP-SEQ
Pol II ChiP has been performed as described in (Zeitlinger et al., 2007) using a Pol II antibody (CTD4H8, Millipore). Methods empoyed for libraries generation and ChIP-Seq analysis are detailed in the Extended Experimental Procedures.
Modeling
A detailed description of the mathematical model used to predict the evolution of the Snail protein is provided in the Extended Experimental Procedures. Briefly, ordinary differential equations were used with the following key parameters: the timing of Snail activation, the concentration of a repressor and that of an activator (Dorsal), the number of nearest neighbors and the diffusion between nuclei.
Supplementary Material
Highlights.
Minimal promoter sequences are sufficient to establish paused RNA polymerase.
Levels of paused polymerase determine the timing of transcription.
Stochastic activation of snail expression disrupts mesoderm invagination.
Paused Pol II and transcriptional synchrony coordinate gastrulation.
Acknowledgments
The authors are grateful to Alistair Boettiger for sharing his ideas about Snail autoregulation. We also thank Mike Perry and Valerie Hilgers for their insightful discussions, Didier Rocancourt for help with artwork, and Lily Mirels and Eileen Wagner for comments on the manuscript. M.L. is the recipient of a Human Frontier fellowship. This work was funded by grants from the NIH, GM46638 to M.S.L. and GM47477 to D.S.G.. M.L. and J.P.B. initiated efforts to create a stochastic pattern of snail activation. They also worked closely to determine activation profiles of both endogenous genes and transgenes containing minimal promoter sequences. J.P.B. conceived the use of esg as a means for identifying sna-/sna- mutant embryos. M.L. worked closely with L.S. and D.S.G. to document the sufficiency of minimal promoter sequences in establishing paused RNA Polymerase II via permanganate protection assays. She also worked closely with E.E, K.C., J.J., and J.Z. to document the spectrum of Pol II binding at different promoters via whole-genome ChIP-Seq assays. J.P.B. performed the imaging and developed the segmentation algorithms needed to determine t50 activation profiles. He also performed imaging to count mRNAs and analyzed the models exploring the relationship between timing and levels of gene expression. J.P.B modelled the dynamics of Snail protein expression. M.L. and E.E. designed and created minigenes and BAC transgenes. M.L. performed the genetic crosses. C.T. injected all the plasmid transgenes and Bestgene injected all the BAC transgenes. S.N helped M.L. and J.P.B. to collect and stain embryos. M.L., J.P.B. and M.S.L wrote the manuscript.
Footnotes
Accession Numbers: All data have been submitted to GEO under the accession number GSE36310
Supplemental Information: Supplemental Information includes Extended Results, Extended Experimental Procedures, 7 Figures and two tables and can be found with this article online at : X.
Publisher's Disclaimer: This is a PDF file of an unedited manuscript that has been accepted for publication. As a service to our customers we are providing this early version of the manuscript. The manuscript will undergo copyediting, typesetting, and review of the resulting proof before it is published in its final citable form. Please note that during the production process errors may be discovered which could affect the content, and all legal disclaimers that apply to the journal pertain.
References
- Adelman K, Lis JT. Promoter-proximal pausing of RNA polymerase II: emerging roles in metazoans. Nat Rev Genet. 2012;13:720–731. doi: 10.1038/nrg3293. [DOI] [PMC free article] [PubMed] [Google Scholar]
- Ashe HL, Mannervik M, Levine M. Dpp signaling thresholds in the dorsal ectoderm of the Drosophila embryo. Development. 2000;127:3305–3312. doi: 10.1242/dev.127.15.3305. [DOI] [PubMed] [Google Scholar]
- Balaskas N, Ribeiro A, Panovska J, Dessaud E, Sasai N, Page KM, Briscoe J, Ribes V. Gene regulatory logic for reading the Sonic Hedgehog signaling gradient in the vertebrate neural tube. Cell. 2012;148:273–284. doi: 10.1016/j.cell.2011.10.047. [DOI] [PMC free article] [PubMed] [Google Scholar]
- Boehm AK, Saunders A, Werner J, Lis JT. Transcription factor and polymerase recruitment, modification, and movement on dhsp70 in vivo in the minutes following heat shock. Mol Cell Biol. 2003;23:7628–7637. doi: 10.1128/MCB.23.21.7628-7637.2003. [DOI] [PMC free article] [PubMed] [Google Scholar]
- Boettiger AN, Levine M. Synchronous and stochastic patterns of gene activation in the Drosophila embryo. Science. 2009;325:471–473. doi: 10.1126/science.1173976. [DOI] [PMC free article] [PubMed] [Google Scholar]
- Boettiger AN, Levine M. Rapid Transcription Fosters Coordinate snail Expression in the Drosophila Embryo. Cell Rep. 2013;3:8–15. doi: 10.1016/j.celrep.2012.12.015. [DOI] [PMC free article] [PubMed] [Google Scholar]
- Bothma JP, Magliocco J, Levine M. The snail repressor inhibits release, not elongation, of paused Pol II in the Drosophila embryo. Curr Biol. 2011;21:1571–1577. doi: 10.1016/j.cub.2011.08.019. [DOI] [PMC free article] [PubMed] [Google Scholar]
- Chen H, Xu Z, Mei C, Yu D, Small S. A system of repressor gradients spatially organizes the boundaries of Bicoid-dependent target genes. Cell. 2012;149:618–629. doi: 10.1016/j.cell.2012.03.018. [DOI] [PMC free article] [PubMed] [Google Scholar]
- Duffy KR, Wellard CJ, Markham JF, Zhou JH, Holmberg R, Hawkins ED, Hasbold J, Dowling MR, Hodgkin PD. Activation-induced B cell fates are selected by intracellular stochastic competition. Science. 2012;335:338–341. doi: 10.1126/science.1213230. [DOI] [PubMed] [Google Scholar]
- Dunipace L, Ozdemir A, Stathopoulos A. Complex interactions between cis-regulatory modules in native conformation are critical for Drosophila snail expression. Development. 2011;138:4075–4084. doi: 10.1242/dev.069146. [DOI] [PMC free article] [PubMed] [Google Scholar]
- Eldar A, Elowitz MB. Functional roles for noise in genetic circuits. Nature. 2010;467:167–173. doi: 10.1038/nature09326. [DOI] [PMC free article] [PubMed] [Google Scholar]
- Fay A, Misulovin Z, Li J, Schaaf CA, Gause M, Gilmour DS, Dorsett D. Cohesin selectively binds and regulates genes with paused RNA polymerase. Curr Biol. 2011;21:1624–1634. doi: 10.1016/j.cub.2011.08.036. [DOI] [PMC free article] [PubMed] [Google Scholar]
- Gaertner B, Johnston J, Chen K, Wallaschek N, Paulson A, Garruss AS, Gaudenz K, De Kumar B, Krumlauf R, Zeitlinger J. Poised RNA polymerase II changes over developmental time and prepares genes for future expression. Cell Rep. 2012;2:1670–1683. doi: 10.1016/j.celrep.2012.11.024. [DOI] [PMC free article] [PubMed] [Google Scholar]
- Gilchrist DA, Dos Santos G, Fargo DC, Xie B, Gao Y, Li L, Adelman K. Pausing of RNA polymerase II disrupts DNA-specified nucleosome organization to enable precise gene regulation. Cell. 2010;143:540–551. doi: 10.1016/j.cell.2010.10.004. [DOI] [PMC free article] [PubMed] [Google Scholar]
- Gilchrist DA, Fromm G, dos Santos G, Pham LN, McDaniel IE, Burkholder A, Fargo DC, Adelman K. Regulating the regulators: the pervasive effects of Pol II pausing on stimulus-responsive gene networks. Genes Dev. 2012;26:933–944. doi: 10.1101/gad.187781.112. [DOI] [PMC free article] [PubMed] [Google Scholar]
- Guenther MG, Young RA. Grounded: transcriptional pausing in naive mESCs. Cell Stem Cell. 2012;10:484–485. doi: 10.1016/j.stem.2012.04.016. [DOI] [PubMed] [Google Scholar]
- Hemavathy K, Meng X, Ip YT. Differential regulation of gastrulation and neuroectodermal gene expression by Snail in the Drosophila embryo. Development. 1997;124:3683–3691. doi: 10.1242/dev.124.19.3683. [DOI] [PubMed] [Google Scholar]
- Hendrix DA, Hong JW, Zeitlinger J, Rokhsar DS, Levine MS. Promoter elements associated with RNA Pol II stalling in the Drosophila embryo. Proc Natl Acad Sci U S A. 2008;105:7762–7767. doi: 10.1073/pnas.0802406105. [DOI] [PMC free article] [PubMed] [Google Scholar]
- Juven-Gershon T, Kadonaga JT. Regulation of gene expression via the core promoter and the basal transcriptional machinery. Dev Biol. 2010;339:225–229. doi: 10.1016/j.ydbio.2009.08.009. [DOI] [PMC free article] [PubMed] [Google Scholar]
- Kalmar T, Lim C, Hayward P, Munoz-Descalzo S, Nichols J, Garcia-Ojalvo J, Martinez Arias A. Regulated fluctuations in nanog expression mediate cell fate decisions in embryonic stem cells. PLoS Biol. 2009;7:e1000149. doi: 10.1371/journal.pbio.1000149. [DOI] [PMC free article] [PubMed] [Google Scholar]
- Kanodia JS, Kim Y, Tomer R, Khan Z, Chung K, Storey JD, Lu H, Keller PJ, Shvartsman SY. A computational statistics approach for estimating the spatial range of morphogen gradients. Development. 2011;138:4867–4874. doi: 10.1242/dev.071571. [DOI] [PMC free article] [PubMed] [Google Scholar]
- Kanodia JS, Rikhy R, Kim Y, Lund VK, DeLotto R, Lippincott-Schwartz J, Shvartsman SY. Dynamics of the Dorsal morphogen gradient. Proc Natl Acad Sci U S A. 2009;106:21707–21712. doi: 10.1073/pnas.0912395106. [DOI] [PMC free article] [PubMed] [Google Scholar]
- Kosman D, Ip YT, Levine M, Arora K. Establishment of the mesoderm-neuroectoderm boundary in the Drosophila embryo. Science. 1991;254:118–122. doi: 10.1126/science.1925551. [DOI] [PubMed] [Google Scholar]
- Lee C, Li X, Hechmer A, Eisen M, Biggin MD, Venters BJ, Jiang C, Li J, Pugh BF, Gilmour DS. NELF and GAGA factor are linked to promoter-proximal pausing at many genes in Drosophila. Mol Cell Biol. 2008;28:3290–3300. doi: 10.1128/MCB.02224-07. [DOI] [PMC free article] [PubMed] [Google Scholar]
- Lee H, Kraus KW, Wolfner MF, Lis JT. DNA sequence requirements for generating paused polymerase at the start of hsp70. Genes Dev. 1992;6:284–295. doi: 10.1101/gad.6.2.284. [DOI] [PubMed] [Google Scholar]
- Leptin M. Gastrulation movements: the logic and the nuts and bolts. Dev Cell. 2005;8:305–320. doi: 10.1016/j.devcel.2005.02.007. [DOI] [PubMed] [Google Scholar]
- Leptin M, Grunewald B. Cell shape changes during gastrulation in Drosophila. Development. 1990;110:73–84. doi: 10.1242/dev.110.1.73. [DOI] [PubMed] [Google Scholar]
- Levine M. Paused RNA polymerase II as a developmental checkpoint. Cell. 2011;145:502–511. doi: 10.1016/j.cell.2011.04.021. [DOI] [PMC free article] [PubMed] [Google Scholar]
- Li J, Gilmour DS. Promoter proximal pausing and the control of gene expression. Curr Opin Genet Dev. 2011;21:231–235. doi: 10.1016/j.gde.2011.01.010. [DOI] [PMC free article] [PubMed] [Google Scholar]
- Liberman LM, Reeves GT, Stathopoulos A. Quantitative imaging of the Dorsal nuclear gradient reveals limitations to threshold-dependent patterning in Drosophila. Proc Natl Acad Sci U S A. 2009;106:22317–22322. doi: 10.1073/pnas.0906227106. [DOI] [PMC free article] [PubMed] [Google Scholar]
- Lin C, Garrett AS, De Kumar B, Smith ER, Gogol M, Seidel C, Krumlauf R, Shilatifard A. Dynamic transcriptional events in embryonic stem cells mediated by the super elongation complex (SEC) Genes Dev. 2011;25:1486–1498. doi: 10.1101/gad.2059211. [DOI] [PMC free article] [PubMed] [Google Scholar]
- Losick R, Desplan C. Stochasticity and cell fate. Science. 2008;320:65–68. doi: 10.1126/science.1147888. [DOI] [PMC free article] [PubMed] [Google Scholar]
- Morachis JM, Murawsky CM, Emerson BM. Regulation of the p53 transcriptional response by structurally diverse core promoters. Genes Dev. 2010;24:135–147. doi: 10.1101/gad.1856710. [DOI] [PMC free article] [PubMed] [Google Scholar]
- Nichols J, Smith A. The origin and identity of embryonic stem cells. Development. 2011;138:3–8. doi: 10.1242/dev.050831. [DOI] [PubMed] [Google Scholar]
- Ong CT, Corces VG. Enhancer function: new insights into the regulation of tissue-specific gene expression. Nat Rev Genet. 2011;12:283–293. doi: 10.1038/nrg2957. [DOI] [PMC free article] [PubMed] [Google Scholar]
- Perry MW, Boettiger AN, Bothma JP, Levine M. Shadow enhancers foster robustness of Drosophila gastrulation. Curr Biol. 2010;20:1562–1567. doi: 10.1016/j.cub.2010.07.043. [DOI] [PMC free article] [PubMed] [Google Scholar]
- Reeves GT, Trisnadi N, Truong TV, Nahmad M, Katz S, Stathopoulos A. Dorsal-ventral gene expression in the Drosophila embryo reflects the dynamics and precision of the dorsal nuclear gradient. Dev Cell. 2012;22:544–557. doi: 10.1016/j.devcel.2011.12.007. [DOI] [PMC free article] [PubMed] [Google Scholar]
- Rushlow CA, Shvartsman SY. Temporal dynamics, spatial range, and transcriptional interpretation of the Dorsal morphogen gradient. Curr Opin Genet Dev. 2012;22:542–546. doi: 10.1016/j.gde.2012.08.005. [DOI] [PubMed] [Google Scholar]
- Saga Y. The synchrony and cyclicity of developmental events. Cold Spring Harb Perspect Biol. 2012;4:a008201. doi: 10.1101/cshperspect.a008201. [DOI] [PMC free article] [PubMed] [Google Scholar]
- Schneider DS, Hudson KL, Lin TY, Anderson KV. Dominant and recessive mutations define functional domains of Toll, a transmembrane protein required for dorsal-ventral polarity in the Drosophila embryo. Genes Dev. 1991;5:797–807. doi: 10.1101/gad.5.5.797. [DOI] [PubMed] [Google Scholar]
- Schuettengruber B, Ganapathi M, Leblanc B, Portoso M, Jaschek R, Tolhuis B, van Lohuizen M, Tanay A, Cavalli G. Functional anatomy of polycomb and trithorax chromatin landscapes in Drosophila embryos. PLoS Biol. 2009;7:e13. doi: 10.1371/journal.pbio.1000013. [DOI] [PMC free article] [PubMed] [Google Scholar]
- Shopland LS, Hirayoshi K, Fernandes M, Lis JT. HSF access to heat shock elements in vivo depends critically on promoter architecture defined by GAGA factor, TFIID, and RNA polymerase II binding sites. Genes Dev. 1995;9:2756–2769. doi: 10.1101/gad.9.22.2756. [DOI] [PubMed] [Google Scholar]
- Sweeton D, Parks S, Costa M, Wieschaus E. Gastrulation in Drosophila: the formation of the ventral furrow and posterior midgut invaginations. Development. 1991;112:775–789. doi: 10.1242/dev.112.3.775. [DOI] [PubMed] [Google Scholar]
- Venken KJ, He Y, Hoskins RA, Bellen HJ. P[acman]: a BAC transgenic platform for targeted insertion of large DNA fragments in D. melanogaster. Science. 2006;314:1747–1751. doi: 10.1126/science.1134426. [DOI] [PubMed] [Google Scholar]
- Vincent SD, Buckingham ME. How to make a heart: the origin and regulation of cardiac progenitor cells. Curr Top Dev Biol. 2010;90:1–41. doi: 10.1016/S0070-2153(10)90001-X. [DOI] [PubMed] [Google Scholar]
- Zeitlinger J, Stark A, Kellis M, Hong JW, Nechaev S, Adelman K, Levine M, Young RA. RNA polymerase stalling at developmental control genes in the Drosophila melanogaster embryo. Nat Genet. 2007;39:1512–1516. doi: 10.1038/ng.2007.26. [DOI] [PMC free article] [PubMed] [Google Scholar]
Associated Data
This section collects any data citations, data availability statements, or supplementary materials included in this article.