
Figure 2.
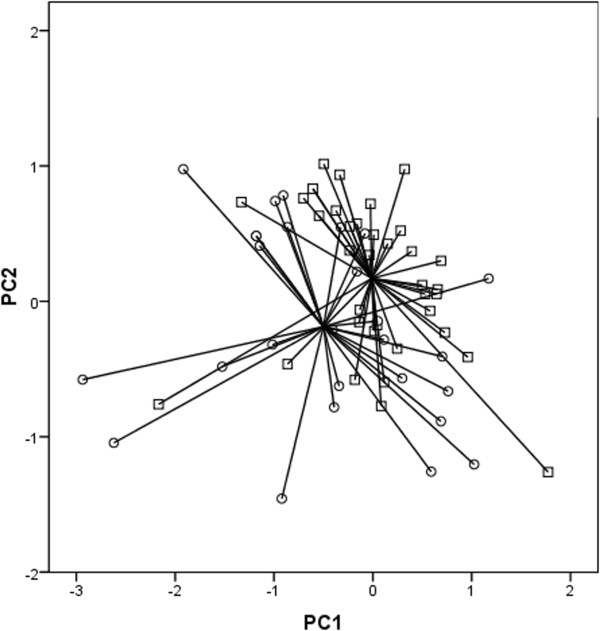
Two dimensional PCA plot between healthy subjects (squares) and patients with lung cancer (circles). Electronic nose could discriminate the two groups with a classification accuracy of 72% when breath samples were collected with a previously standardised collection procedure. The difference was significant (p = 0.02).