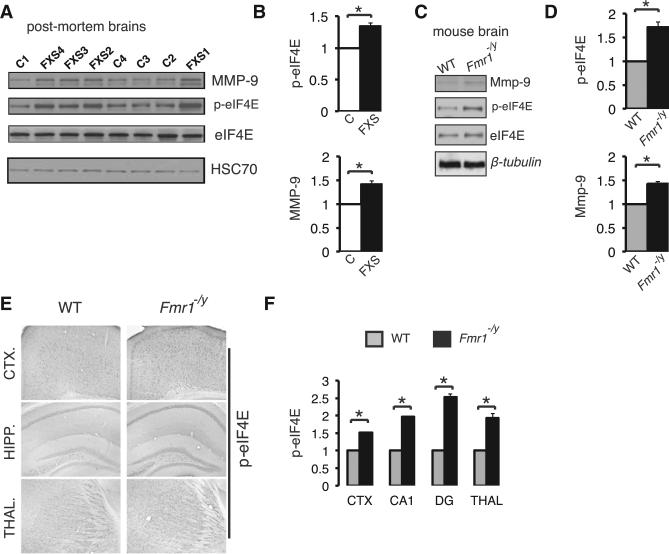
Figure 1. Elevated Phosphorylation of eIF4E and Increased Expression of MMP-9 in Postmortem Brains from FXS Patients and in Fmr1 −/y Mouse Brain.
(A) Western blot analysis of lysates from frontal cortex or hippocampus from control “C” (n = 9) and FXS patients “FXS” (n = 8; see Figure S2). Representative images of immunoblots probed with antibodies against the indicated proteins are shown. HSC70 was the loading control.
(B) Quantification of western blots from (A). Protein amounts of phospho-eIF4E and MMP9 are normalized to total eIF4E and HSC70 (n = 3 for each group) and presented as fold change relative to control.
(C) Western blot analysis of whole-brain lysates from Fmr1 −/y and wild-type (WT) littermates (n = 3 for each group). Representative images of immunoblots probed with antibodies against the indicated proteins are shown; β-tubulin was the loading control.
(D) Quantification of data in (C) for phopshoeIF4E and Mmp9 protein amounts (n = 3 for each group), normalized to eIF4E and β-tubulin, respectively, and presented as fold change relative to WT.
(E) Immunohistochemical DAB staining of cortical (CTX.), hippocampal (HIPP.), and thal amic (THAL.) 50 μm slices from WT and Fmr1 −/y mice. Representative images of slices stained with antibodies against the indicated proteins are shown.
(F) Quantification of immunohistochemical staining in (E) for phopsho-eIF4E (n = 3 for each group; fold change relative to WT). For (A)–(F), Student's t test, *p < 0.05. See also Figure S2.
Data are presented as mean ± SEM (error bars).

