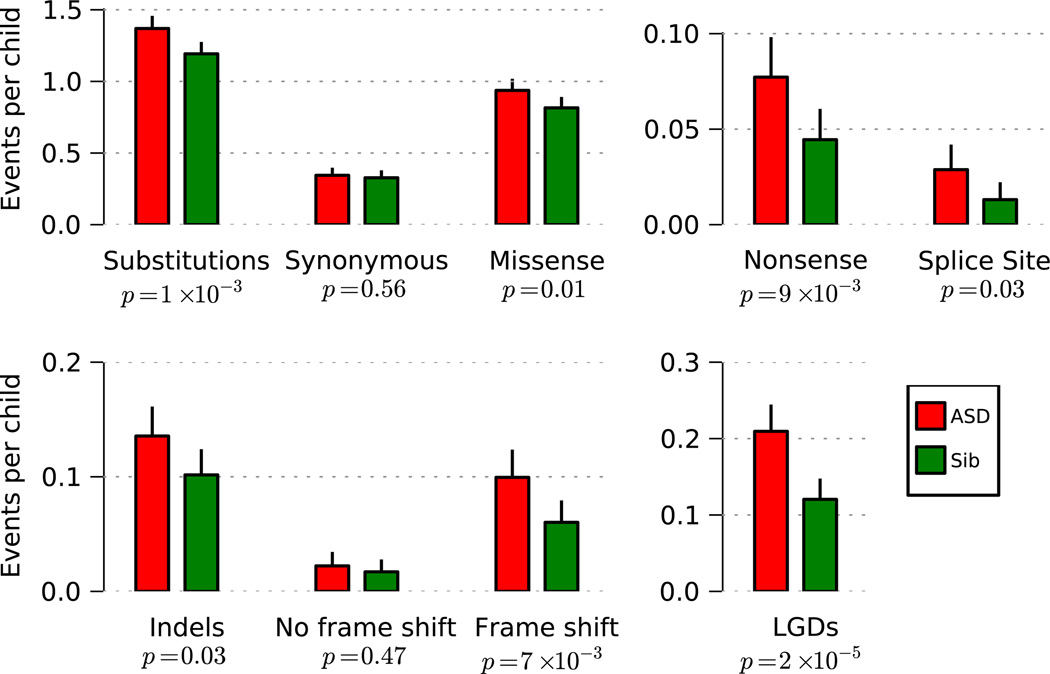
Fig. 1. Rates of de novo events by mutational type in the SSC.
Rates per child are estimated from the 40× joint coverage target region, then extrapolated for the entire exome. Mutation types are displayed by class, and the combined rate for all LGDs is shown at the bottom right. For each event type, the significance between probands and unaffected is given.

