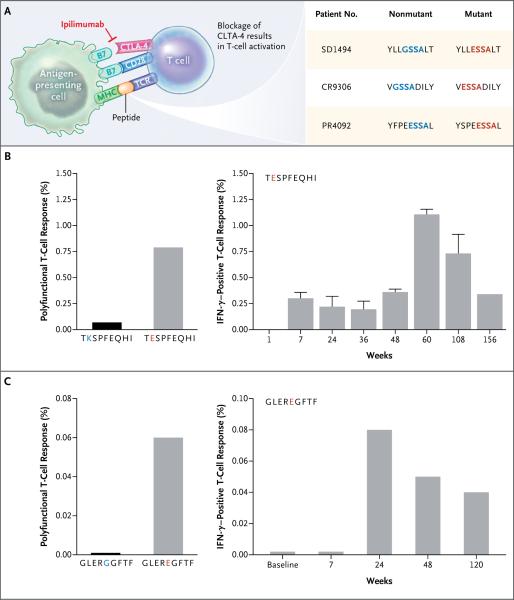
Figure 4. Role of Neoantigens in Activation of T Cells from Patients Treated with CTLA-4 Blockade.
Panel A shows an example of a tetrapeptide substring of human cytomegalovirus. In each case, the nonamer containing the mutation is predicted to bind and be presented by a patient-specific HLA. Panel B shows the dual positive (interferon-γ [IFN-γ] and tumor necrosis factor α [TNF-α]) CD8+ T-cell response to TESPFEQHI and nonmutant peptide TKSPFEQHI and the increase in IFN-γ+ T cells over time. Data from Patient CR9306 are shown. T bars indicate the standard deviation. Panel C shows the dual positive (IFN-γ and TNF-α) CD8+ T-cell response to GLEREGFTF and nonmutant peptide GLERGGFTF and illustrates the increase in peptide-specific T cells 24 weeks after the initiation of treatment with ipilimumab relative to baseline. Data from Patient CR0095 are shown. MHC denotes major histocompatibility complex, and TCR T-cell receptor.

