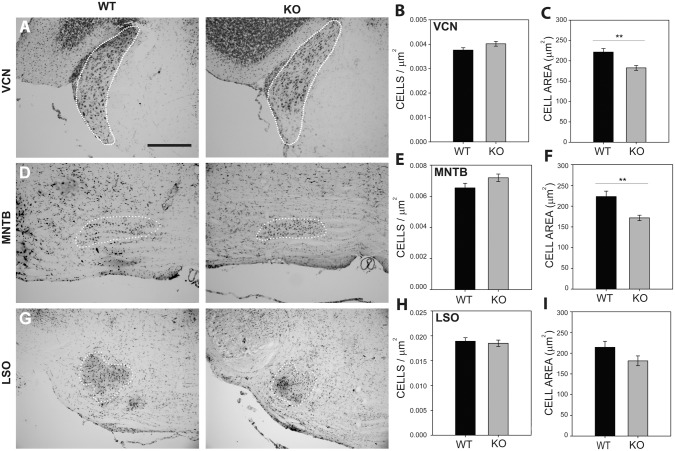
Fig 3. Nissl staining revealed a significant decrease in VCN and MNTB cell area in Fmr1 -/- mice.
Nissl stains were performed on mouse brainstem tissue and the borders of VCN (A), MNTB (D), and LSO (G) were identified in wild type and Fmr1 -/- mice. Cells were counted within these regions and used to calculate cell density for each nucleus. No significant differences in cell density were found in VCN (B), MNTB (E), or LSO (H). Cell area was significantly reduced in Fmr1 -/- mice in VCN (C) and MNTB (F), but not in LSO (I). Scale bar in A, 200 μm; applies to A, D, and G.

