
Fig 4. Wild type (left column) and Fmr1 -/- (right column) brainstem tissue was stained for markers of excitatory and inhibitory inputs.
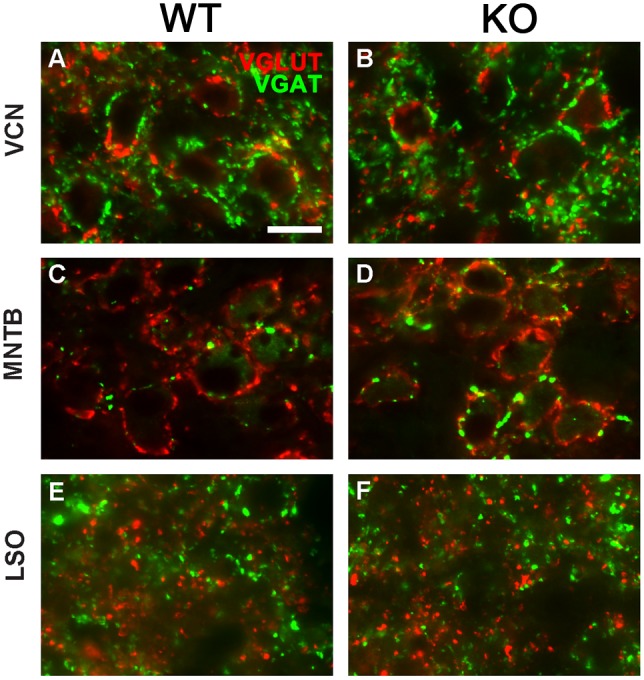
VCN (A-B), MNTB (C-D), and LSO (E-F) were stained for VGLUT (red) and VGAT (green). Scale bar in A, 50 μm; applies to all panels.