

Abstract
Objectives:
The aim of this study was to investigate predictors of progressive cognitive deterioration in patients with suspected non–Alzheimer disease pathology (SNAP) and mild cognitive impairment (MCI).
Methods:
We measured markers of amyloid pathology (CSF β-amyloid 42) and neurodegeneration (hippocampal volume on MRI and cortical metabolism on [18F]-fluorodeoxyglucose–PET) in 201 patients with MCI clinically followed for up to 6 years to detect progressive cognitive deterioration. We categorized patients with MCI as A+/A− and N+/N− based on presence/absence of amyloid pathology and neurodegeneration. SNAPs were A−N+ cases.
Results:
The proportion of progressors was 11% (8/41), 34% (14/41), 56% (19/34), and 71% (60/85) in A−N−, A+N−, SNAP, and A+N+, respectively; the proportion of APOE ε4 carriers was 29%, 70%, 31%, and 71%, respectively, with the SNAP group featuring a significantly different proportion than both A+N− and A+N+ groups (p ≤ 0.005). Hypometabolism in SNAP patients was comparable to A+N+ patients (p = 0.154), while hippocampal atrophy was more severe in SNAP patients (p = 0.002). Compared with A−N−, SNAP and A+N+ patients had significant risk of progressive cognitive deterioration (hazard ratio = 2.7 and 3.8, p = 0.016 and p < 0.001), while A+N− patients did not (hazard ratio = 1.13, p = 0.771). In A+N− and A+N+ groups, none of the biomarkers predicted time to progression. In the SNAP group, lower time to progression was correlated with greater hypometabolism (r = 0.42, p = 0.073).
Conclusions:
Our findings support the notion that patients with SNAP MCI feature a specific risk progression profile.
The amyloid cascade hypothesis1,2 has so far dominated the Alzheimer disease (AD) field. Jack et al.3,4 proposed a dynamic model that relates disease stage to the best established biomarkers of AD pathology. Based on this, a National Institute on Aging–Alzheimer's Association task force developed recommendations for the diagnosis of preclinical AD based on biomarkers of amyloidosis and neuronal injury.5 Soon afterward, these criteria were operationalized and a sizable minority of cognitively normal elders (23%) showed evidence of neuronal injury and no β-amyloid (Aβ) deposition.6 These subjects were collectively considered to have “suspected non-AD pathology” (SNAP).6
Patients with SNAP mild cognitive impairment (MCI) were shown to have a high 1-year rate of progression to dementia (21%–25%).7 Moreover, MRI markers were found to be useful for predicting progression to dementia in amyloid-negative patients with MCI,8 some of whom may be considered to have SNAP, suggesting that amyloid does not tell the whole story regarding development of dementia.
Individuals with SNAP were comparable to amyloid-positive cognitively normal individuals based on various imaging markers, clinical features, and risk factors, suggesting that the initial appearance of brain-injury biomarkers may be independent and indistinguishable from that due to amyloidosis.9 Further evidence to support amyloid-independent pathology in AD has begun to accumulate.10–12 Moreover, recent studies suggested that neurodegenerative pathology could emerge through a nonamyloid-related pathway even within regions usually affected by AD.13,14 Given the major implications for AD research and treatment,15 SNAP deserves more in-depth investigation. The aim of this study was to investigate predictors of progressive cognitive deterioration in patients with MCI-SNAP.
METHODS
Subjects.
We selected patients from 2 independent datasets: the Alzheimer's Disease Neuroimaging Initiative (ADNI, adni.loni.usc.edu) and a European Union (EU) dataset of patients coming to observation at 4 independent European memory clinics (Brescia, Italy [Translational Outpatient Memory Clinic, TOMC]; Amsterdam, the Netherlands [VU University Medical Center, VUMC]; Stockholm, Sweden [Karolinska University Hospital Huddinge, KUHH]; and Munich, Germany [Klinikum rechts der Isar der Technischen Universität München, MUCH]). For a complete description of the 2 datasets, refer to e-Methods on the Neurology® Web site at Neurology.org.
At baseline, all patients enrolled in this study (89 from ADNI, 39 from TOMC, 27 from VUMC, 17 from KUHH, and 29 from MUCH) had the syndromic diagnosis of MCI as described by Petersen et al.,16 and had available MRI, [18F]-fluorodeoxyglucose (FDG)-PET, and CSF sampling. Biomarker status was either not available or not considered for the baseline diagnosis. The cognitive profile was consistent with single- and multiple-domain amnestic MCI.
Clinical visual inspection of routine MRI of all patients included in the study indicated neither focal ischemic lesions nor extensive microvascular disease that could be responsible for the cognitive symptoms.
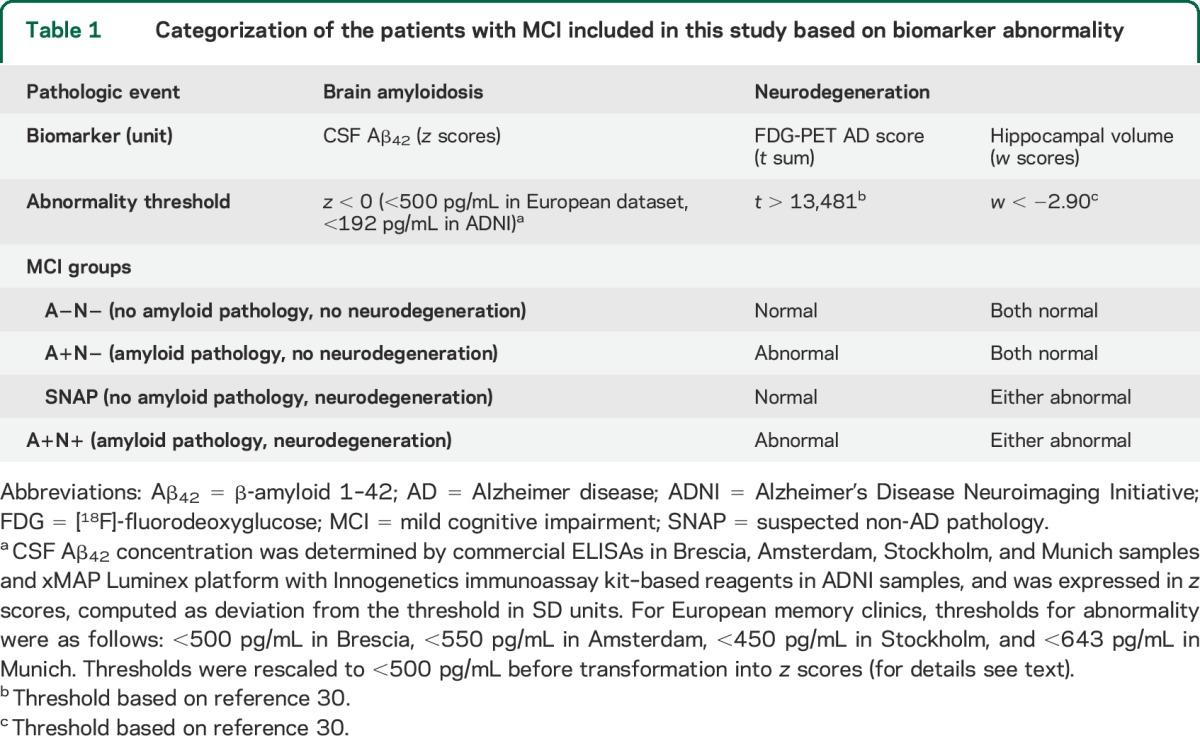
We pooled patients with MCI from ADNI and EU datasets, and then categorized them into 4 groups based on amyloid pathology and/or neurodegeneration (either hypometabolism or hippocampal atrophy) biomarker abnormality: A−N− (no amyloid pathology and no neurodegeneration), A+N− (amyloid pathology with no neurodegeneration), SNAP (A−N+ cases, no amyloid pathology with neurodegeneration), and A+N+ (amyloid pathology with neurodegeneration) (table 1).
Table 1.
Categorization of the patients with MCI included in this study based on biomarker abnormality
Patients with MCI were followed up to detect progressive cognitive deterioration, defined as (1) losing more than 3 points between first and last Mini-Mental State Examination (MMSE) administration, (2) having dementia at follow-up, or (3) getting a score less than 24 at last MMSE, as described in a previously published report.17
Standard protocol approvals, registrations, and patient consents.
Ethics/radiation committee approval of any protocol involved in the study was obtained at each of the ADNI and EU participating centers. Written informed consent to share data for scientific research purposes was collected from each participant.
Biological markers of amyloidosis and neurodegeneration.
We selected CSF Aβ42 concentration as a biological marker of amyloidosis: lower than normal CSF Aβ42 was assumed to be associated with cortical fibrillar amyloid deposition. We assessed neurodegeneration using an 18F-FDG-PET index of AD-related hypometabolism (the AD t-sum score)18 and MRI-based automated segmentation of age-adjusted hippocampal atrophy (w scores). Information on biomarkers procedure collection and normalization is available in e-Methods.
Statistical analysis.
We assessed differences in sociodemographic and clinical features, genotype, neurodegeneration, and amyloidosis biomarkers among A−N−, A+N−, SNAP, and A+N+ patients using analysis of variance (continuous variables) or Pearson χ2 test (dichotomous variables). We estimated cognitive deterioration as number of MMSE points lost per year (last MMSE score − baseline MMSE score/years of follow-up). We computed differences in sociodemographic factors, clinical features, and genotype between the SNAP and any other patient group, as well as between the ADNI and EU datasets, using independent Student t test (continuous variables) or Pearson χ2 test (dichotomous variables). We assessed differences between progressor and nonprogressor SNAP patients using the nonparametric, independent 2-group Mann–Whitney U test (continuous variables) or χ2 test (categorical variables), in order to account for the small sample size.
To assess the risk of progressive cognitive deterioration in A+N−, SNAP, and A+N+ patients, we plotted survival curves and computed hazard ratios (both crude and adjusted by age, MMSE scores, and APOE ε4 carrier status) with pertinent 95% confidence interval based on the A−N− reference group (6 separate models). We assessed the significance of differences in curves between SNAP and A+N+ or A+N− groups by log-rank test. We computed log-rank and Tarone tests for trend by using the survtrend R function (available at https://www.ics.uci.edu/∼vqnguyen/stat255/Stat255Functions.R).
In addition, we plotted survival curves to investigate biomarker prognosis in SNAP patients. In this analysis, we divided the SNAP group into subgroups based on the biomarker abnormality thresholds reported in table 1 (FDG-PET and hippocampal atrophy but not CSF Aβ42, because all patients with MCI-SNAP are negative for amyloidosis by definition), and we assessed the significance of differences in curves between normal and abnormal groups by log-rank test.
Finally, we adopted a generalized linear model for analyzing the time to progression in A+N−, SNAP, and A+N+ groups, where the time to progression was the dependent (gamma-distributed) variable and Aβ42, FDG-PET, and hippocampal volume were independent continuous predictors. We investigated the linear relationship between biomarkers and time to progression by computing both Pearson and Spearman correlation coefficients.
We performed all statistical analyses using R software version 3.0.2, except for time-to-progression analysis, which was performed with SPSS version 21.0 (IBM Corp., Armonk, NY).
RESULTS
Of the 201 patients with MCI included in the study, 41 were categorized A−N−, 41 A+N−, 34 SNAP, and 85 A+N+.
The 4 groups did not differ in age and sex. They significantly differed in follow-up duration, baseline and follow-up MMSE, as well as in MMSE yearly change. The SNAP group showed significantly lower baseline and follow-up MMSE scores than the A−N− group (p = 0.007 and p = 0.005), and significantly higher follow-up MMSE scores than the A+N+ group (p = 0.020), but their annual MMSE change was not significantly different from that of any other group. The 4 groups significantly differed in APOE ε4 proportion; ε4 proportion in the SNAP group was significantly lower than that in the A+N− and A+N+ groups (p = 0.002 and p = 0.005, respectively). The proportion of progressive cognitive deterioration was significantly different among the 4 groups; progression in SNAP was significantly more frequent than in A−N− (p = 0.005), more frequent than in A+N− (p = 0.098), and less frequent than in A+N+ (p = 0.187) (table 2). The proportion of progressive cognitive deterioration in the 4 groups did not significantly change when restricting to APOE ε4 carriers (69%, 40%, 36%, and 20% in A+N+, SNAP, A+N−, and A−N−, respectively). Of the 19 individuals with SNAP who progressed to dementia, 5 patients progressed to frontotemporal dementia (FTD), 2 patients progressed to Lewy body dementia, and the remaining 12 patients progressed to AD. Among A−N− progressors, half progressed to AD (n = 4) and the other half to FTD (n = 5). All amyloid-positive progressors but one A+N+ patient (who progressed to FTD) progressed to AD.
Table 2.
Descriptive features of the 201 patients with MCI included in this study
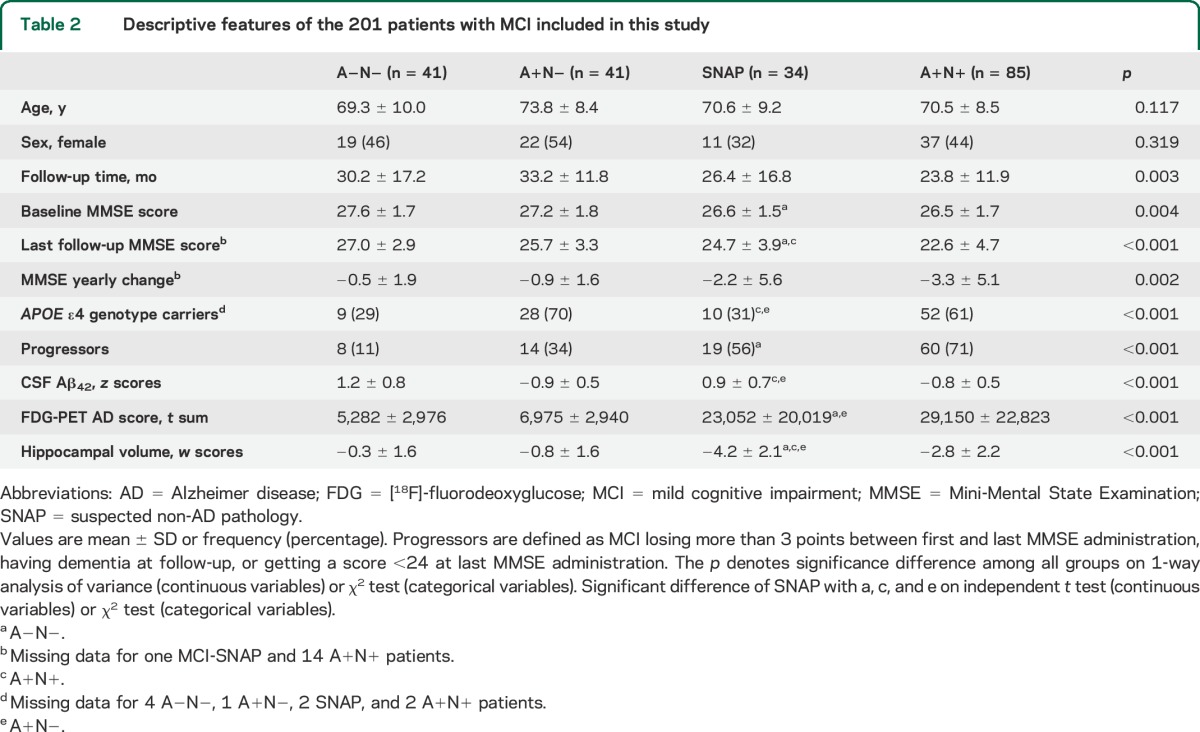
The 4 groups significantly differed in CSF Aβ42 concentrations, hypometabolism on FDG-PET, and hippocampal volume. Hypometabolism in SNAP was comparable to A+N+ (p = 0.154), while hippocampal atrophy was more severe in SNAP (p = 0.002). CSF Aβ42 concentrations were comparable to A−N− (p = 0.107) (table 2). Biomarker distributions in the 4 groups, disaggregated by progression, are displayed in figure 1.
Figure 1. Biomarker abnormality in A−N−, A+N−, SNAP, and A+N+ MCI patient groups, disaggregated by progressive cognitive deterioration.
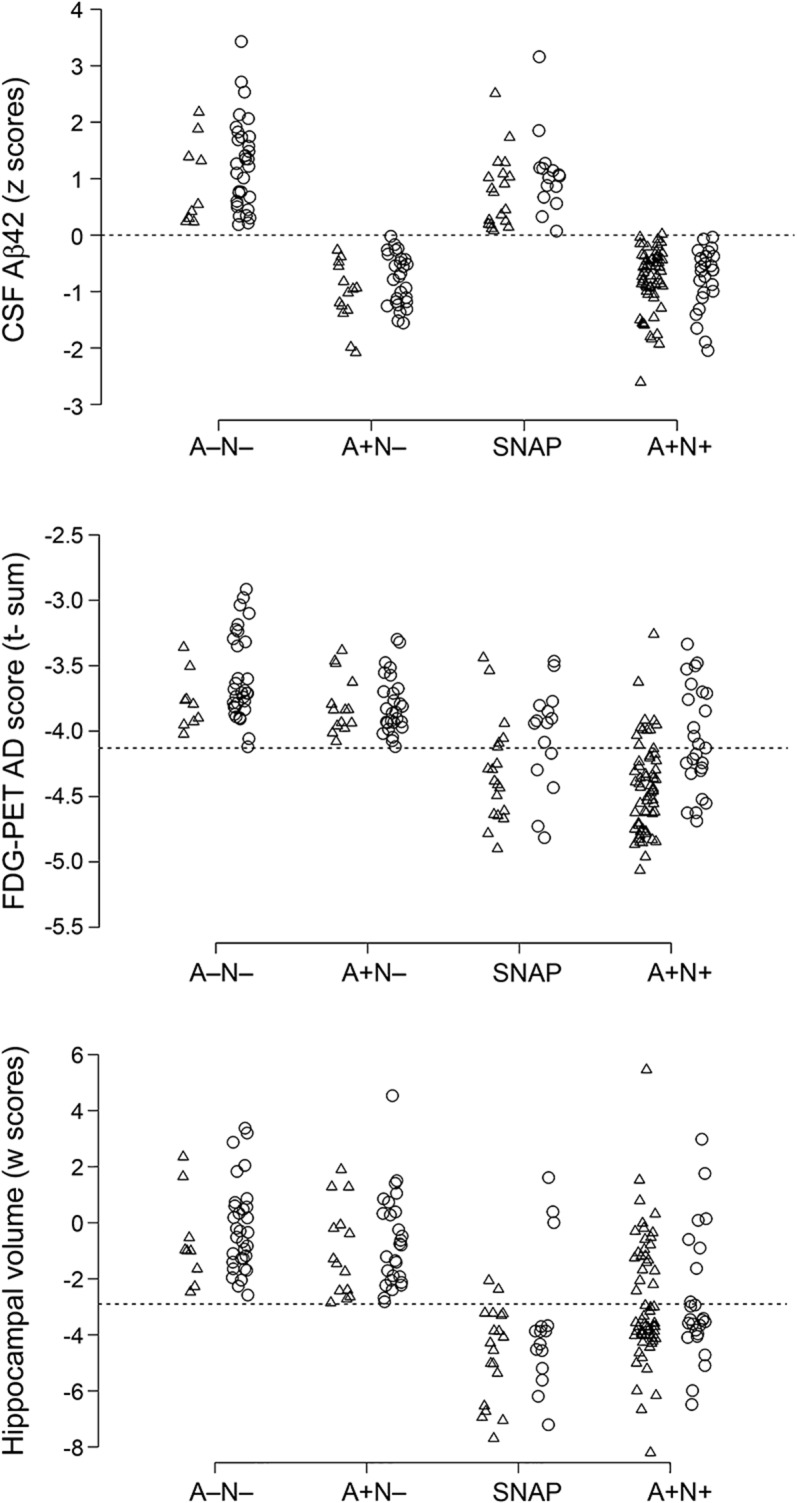
Triangles denote progressors, while circles denote nonprogressors. Data were jittered to prevent overplotting. For FDG-PET AD t-sum biomarker, logarithmic scores (log10) were polarized to improve visualization, with abnormal scores below the threshold line and toward the negative end of the distribution. Aβ42 = β-amyloid 1–42; AD = Alzheimer disease; FDG = [18F]-fluorodeoxyglucose; MCI = mild cognitive impairment; SNAP = suspected non-AD pathology.
Patients with MCI from the ADNI dataset (n = 89) did not differ from patients from the EU dataset (n = 112) in baseline MMSE score, follow-up duration, follow-up MMSE score, MMSE yearly change, APOE genotype, and proportion of progressive cognitive deterioration. EU patients were significantly younger than ADNI patients, and the EU dataset had a significantly higher proportion of females. The proportion of A+N− patients in ADNI was significantly higher than in EU, while the proportion of A−N− and SNAP patients was significantly lower; the proportion of A+N+ was comparable in the 2 datasets (table e-1).
SNAP and A+N+ patients had significant risk of progressive cognitive deterioration, based on A−N− reference group, while A+N− patients did not (figure 2). The SNAP survival curve was significantly different from A+N+ but not A+N− curves (log-rank p = 0.016 and 0.173, respectively). Both log-rank and Tarone tests for trend were significant (p < 0.001, both tests). Figure e-1 shows the risk of progressive cognitive deterioration in the 4 groups in APOE ε4 carriers and noncarriers, separately.
Figure 2. Risk of progressive cognitive deterioration in 34 SNAP, 41 A+N−, and 85 A+N+ patients with MCI, compared with 41 A−N− patients with MCI as the reference.

The + denotes censored cases. Adjusted by age, baseline Mini-Mental State Examination score, and APOE ε4 carrier status. Crude and adjusted HRs were computed in 6 separate Cox regression models. SNAP and A+N+ patients had significant risk of progressive cognitive deterioration, while A+N− patients did not. CI = confidence interval; HR = hazard ratio; MCI = mild cognitive impairment; SNAP = suspected non–Alzheimer disease pathology.
In the SNAP group, 5 of 34 subjects were FDG-positive only, 16 were hippocampus-positive only, and 13 were positive for both markers of neurodegeneration. SNAP patients with abnormal FDG-PET showed significantly higher risk of progressive cognitive deterioration than patients with normal FDG-PET, and the 2 groups showed significantly different survival distributions (log-rank p = 0.004). In contrast, risk of progressive cognitive deterioration in SNAP patients was independent of hippocampal atrophy (figure e-2). Progressor and nonprogressor SNAP patients did not differ in age, sex, baseline MMSE score, APOE, and CSF Aβ42 concentration, while they significantly differed in follow-up MMSE score and MMSE yearly change, as expected. Progressor SNAP patients had significantly lower cortical metabolism on FDG-PET and lower hippocampal volume than nonprogressor SNAP patients, although the difference was not significant (table e-2).
In A+N− and A+N+, none of the biomarkers predicted time to progression. In SNAP patients, lower hypometabolism predicted longer time to progression: 10,000-unit decrease in FDG-PET t sum was associated with 4-month-longer time to progression (p = 0.086) (table e-3). Lower time to progression was linearly correlated with greater hypometabolism (Pearson correlation coefficient r = 0.42, p = 0.073; Spearman correlation coefficient ρ = 0.42, p = 0.076) (figure 3). There was a trend toward linear correlation of lower time to progression with larger hippocampi (r = −0.33, p = 0.162; ρ = −0.36, p = 0.134), while no correlation was found between time to progression and CSF Aβ concentration (r = −0.12, p = 0.637; ρ = 0.06, p = 0.793) (figure e-3).
Figure 3. Linear correlation between time to progression and FDG-PET in the 19 SNAP progressors.
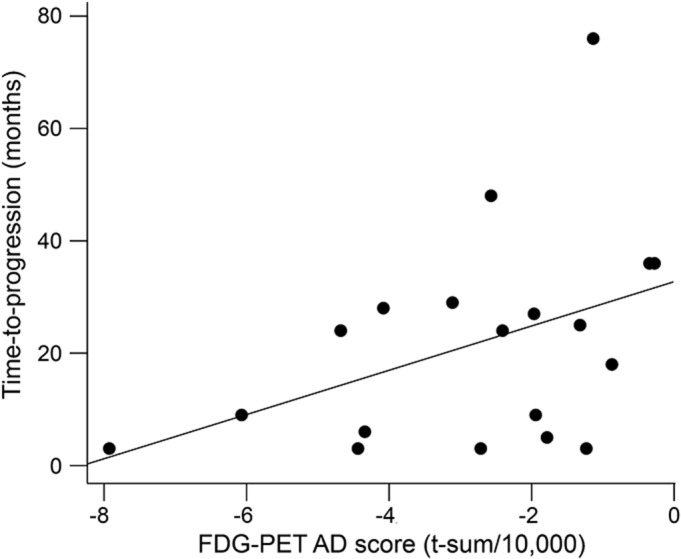
FDG-PET t-sum scores were polarized for more negative values to denote greater abnormality. Lower time to progression was linearly correlated with greater hypometabolism. AD = Alzheimer disease; FDG = [18F]-fluorodeoxyglucose; MCI = mild cognitive impairment; SNAP = suspected non-AD pathology.
DISCUSSION
In this study, we showed that the risk of progressive cognitive deterioration in patients with MCI who had neurodegeneration but no amyloid pathology (SNAP) was higher than in patients with MCI who had no neurodegeneration and no amyloid pathology (A−N−) but comparable to patients with MCI who had both neurodegeneration and amyloid pathology (A+N+). In SNAP patients, greater hypometabolism was linearly correlated with lower time to progression. In A+N− and A+N+ patients, none of the biomarkers predicted time to progression.
Since their recent description and given potential implications, SNAP cases have generated great interest. SNAP cases have recently been described in a population of cognitively normal elderly9 and were found to have lower prevalence of the APOE ε4 genotype than persons with preclinical AD, but were almost indistinguishable from persons with both neurodegeneration and amyloidosis on FDG-PET regional hypometabolism, MRI regional brain volume loss, cerebrovascular lesions on imaging, vascular risk factors, and α-synucleinopathy–related features. This suggests that the initial appearance of brain-injury biomarkers in cognitively normal elderly individuals may not depend on amyloidosis.9 In the current study, SNAP patients with MCI had a significantly lower proportion of APOE ε4 genotype than both A+N+ and A+N− patients, in line with findings on cognitively healthy elders with SNAP,9 but significantly more severe hippocampal atrophy than A+N+ patients.
There is only one previous study investigating progression to dementia in patients with MCI-SNAP, showing that 1-year rate of progression of SNAP was significantly higher than A−N− and A+N−, and comparable to A+N+ MCI patients.7 Our findings are overall in line with these, despite differences of demographics (our patients are 6 and 11 years younger than patients from ADNI and Mayo Clinic Study of Aging included in the other study) and study design (the other study had a shorter follow-up by about a half). The 2 studies are also in agreement in the proportion of the ε4 allele of APOE in MCI-SNAP, which was significantly lower than in amyloid-positive MCI, and comparable to biomarker-negative patients. However, our findings are in contrast to previous studies that found a relative cognitive stability of cognitively normal elders with SNAP and showed that their cognitive progression was markedly lower than in amyloid-positive persons.19,20 Such discrepancy suggests that patients with MCI-SNAP may represent a different group than cognitively normal elders with SNAP.
The pathophysiology of cognitive impairment in MCI-SNAP is still a matter of debate. It can be hypothesized that the category represents a mixed bag of several different types of amyloid-unrelated pathologies that may resemble AD clinically, such as hippocampal sclerosis, argyrophilic grain disease, tangle-only dementia, frontotemporal degeneration, or Lewy body disease, in line with the fact that a nonnegligible minority of patients diagnosed with clinically probable AD do not meet neuropathologic criteria for AD at histopathology.21 The poor stability of current assays for CSF Aβ42 and the uncertainty of abnormality thresholds22 suggest that a proportion of MCI-SNAP diagnoses could be false-negative and these patients could actually have underlying amyloid pathology.
We showed that in MCI-SNAP progressors, FDG-PET almost significantly predicted time to progression; CSF Aβ42 was not predictive of progressive cognitive deterioration, in line with previous findings in amyloid-negative patients with MCI8 and the notion that brain amyloidosis is not related to cognitive symptoms.23 Despite that these findings from a small sample of MCI-SNAP progressors should be considered preliminary, they could represent relevant information toward understanding underlying SNAP pathology. We propose that the SNAP group could include 2 different subgroups: (1) patients with severe cortical damage and no hippocampal atrophy, who might have underlying frontotemporal degeneration or tangle-only dementia, and rapidly progress to dementia; and (2) patients with hippocampal atrophy but relatively preserved cortical metabolism, who might have either hippocampal sclerosis or argyrophilic grain disease. This hypothesis is in line with the observation that medial temporal lobe atrophy is related to primary degenerative hippocampal pathology in pathologically confirmed very old patients24 who progress to dementia remarkably slowly.
Current findings could have been influenced by the choice of biomarkers. CSF Aβ42 protein concentration was included as an established marker of amyloid deposition.25 Although we did not measure cortical amyloidosis (because of the paucity of amyloid imaging data available), previous studies demonstrated good concordance between CSF Aβ42 and cortical amyloid, assessed by [11C]-Pittsburgh compound B–PET.26,27 Both hippocampal atrophy on MRI and t sum on FDG-PET are relatively specific topographic markers of AD neurodegeneration, and are by definition not specific to SNAP. However, defining SNAP patients with non-SNAP–specific topographic measures will only lead to selecting those SNAP patients with the most severe degrees of neurodegeneration, i.e., will lead to select a SNAP group including relatively few false-positives. This might have caused us to miss SNAP patients with milder degrees of neurodegeneration, but assures that those SNAP patients that we selected did indeed have neurodegeneration.
This study has some strengths and limitations. First, the group of 201 patients with MCI under study is the largest available with all 3 core biomarkers available at baseline (CSF Aβ42, MRI, and FDG-PET), paired with information on progressive cognitive deterioration on a reasonably long follow-up (30 months on average). Despite the large size of the overall MCI group, the relatively low proportion of SNAP patients results in a relatively small sample size, requiring caution in the interpretation of the results. However, to our knowledge, there is only one previous study7 reporting a similar case series (n = 36 SNAP with MCI from Mayo Clinic Study of Aging and n = 10 SNAP with MCI from ADNI), followed for shorter follow-up (15 and 12 months on average in Mayo Clinic Study of Aging and ADNI cohorts, respectively). Second, CSF total tau protein concentration, despite being an established marker of neurodegeneration, was not included in the study because of the paucity of available data (CSF tau was missing for 58 patients with MCI from the EU dataset). Although no measure of cerebrovascular disease (either risk factor or MRI measure) was included because of lack of consistent data across centers, clinical visual inspection of routine MRI of all patients included in the study indicated neither focal ischemic lesions nor extensive microvascular disease that could be responsible for the cognitive symptoms. It would have been valuable to assess differences in memory features in the SNAP group compared with the other groups. Unfortunately, this was not possible because of the multicenter nature of the study: heterogeneous neuropsychological tests with heterogeneous norms were administered in different centers, and pooling and standardizing neuropsychological data, albeit possible, was beyond the scope of this study. Finally, ADNI patients were significantly older than EU patients and had a lower proportion of SNAP, probably reflecting the different recruitment strategies of ADNI and dementia research centers in the United States and Europe and the interlaboratory variability in methods and protocols used to assess CSF Aβ42 concentration. However, standard operating preanalytical procedures for CSF biomarkers are just now being developed28,29 and cannot be applied to historical cohorts.
We provided further evidence that neurodegenerative dementia pathology can emerge and develop through nonamyloid pathways. We showed that MCI patients with SNAP are similar to A+N+ MCI patients in terms of risk of progressive cognitive deterioration, suggesting that SNAP prognosis can be challenging. However, patients with SNAP featured a specific risk progression profile, confirming a specific underlying pathology other than AD. The identification of SNAP patients is of particular interest to clinical trialists. Recent clinical trials with anti-amyloid drugs (bapineuzumab and solanezumab) have recruited up to 30% amyloid-negative patients, which might have diluted their therapeutic effect. Future studies, larger samples, and pathologic confirmation are needed to verify or falsify the hypothesis that the MCI-SNAP group does indeed comprise 2 distinct subgroups, denoted by different cortical damage/hippocampal atrophy and different time to progression, and ultimately different neuropathology.
Supplementary Material
ACKNOWLEDGMENT
Data used in this article were partially collected by Translational Outpatient Memory Clinic—TOMC—working group at IRCCS Centro San Giovanni di Dio Fatebenefratelli in Brescia, Italy. Contributors to the TOMC, involved in data collection, are: G. Amicucci, S. Archetti, L. Benussi, G. Binetti, L. Bocchio-Chiavetto, C. Bonvicini, E. Canu, F. Caobelli, E. Cavedo, E. Chittò, M. Cotelli, M. Gennarelli, S. Galluzzi, C. Geroldi, R. Ghidoni, R. Giubbini, U.P. Guerra, G. Kuffenschin, G. Lussignoli, D. Moretti, B. Paghera, M. Parapini, C. Porteri, M. Romano, S. Rosini, I. Villa, R. Zanardini, and O. Zanetti.
GLOSSARY
- Aβ
β-amyloid
- Aβ42
β-amyloid 1–42
- AD
Alzheimer disease
- ADNI
Alzheimer's Disease Neuroimaging Initiative
- EU
European Union
- FDG
[18F]-fluorodeoxyglucose
- FTD
frontotemporal dementia
- KUHH
Karolinska University Hospital Huddinge
- MCI
mild cognitive impairment
- MMSE
Mini-Mental State Examination
- MUCH
Klinikum rechts der Isar der Technischen Universität München
- SNAP
suspected non–Alzheimer disease pathology
- TOMC
Translational Outpatient Memory Clinic
- VUMC
VU University Medical Center
Footnotes
Supplemental data at Neurology.org
Contributor Information
Collaborators: Michael Weiner, Paul Aisen, Michael Weiner, Paul Aisen, Ronald Petersen, Clifford R. Jack, Jr, William Jagust, J.Q. Trojanowki, Arthur W. Toga, Laurel Beckett, Robert C. Green, Anthony Gamst, Andrew J. Saykin, John Morris, William Z. Potter, Robert C. Green, Tom Montine, Ronald Petersen, Paul Aisen, Anthony Gamst, Ronald G. Thomas, Michael Donohue, Sarah Walter, Clifford R. Jack, Jr, Anders Dale, Matthew Bernstein, Joel Felmlee, Nick Fox, Paul Thompson, Norbert Schuff, Gene Alexander, Charles DeCarli, William Jagust, Dan Bandy, Robert A. Koeppe, Norm Foster, Eric M. Reiman, Kewei Chen, Chet Mathis, John Morris, Nigel J. Cairns, Lisa Taylor-Reinwald, J.Q. Trojanowki, Les Shaw, Virginia M.-Y. Lee, Magdalena Korecka, Arthur W. Toga, Karen Crawford, Scott Neu, Laurel Beckett, Danielle Harvey, Anthony Gamst, John Kornak, Andrew J. Saykin, Tatiana M. Foroud, Steven Potkin, Li Shen, Zaven Kachaturian, Richard Frank, Peter J. Snyder, Susan Molchan, Jeffrey Kaye, Sara Dolen, Joseph Quinn, Lon Schneider, Sonia Pawluczyk, Bryan M. Spann, James Brewer, Helen Vanderswag, Judith L. Heidebrink, Joanne L. Lord, Ronald Petersen, Kris Johnson, Rachelle S. Doody, Javier Villanueva-Meyer, Munir Chowdhury, Yaakov Stern, Lawrence S. Honig, Karen L. Bell, John C. Morris, Mark A. Mintun, Stacy Schneider, Daniel Marson, Randall Griffith, David Clark, Hillel Grossman, Cheuk Tang, George Marzloff, Leyla deToledo-Morrell, Raj C. Shah, Ranjan Duara, Daniel Varon, Peggy Roberts, Marilyn S. Albert, Nicholas Kozauer, Maria Zerrate, Henry Rusinek, Mony J de Leon, Susan M De Santi, P. Murali Doraiswamy, Jeffrey R. Petrella, Marilyn Aiello, Steve Arnold, Jason H. Karlawish, David Wolk, Charles D. Smith, Curtis A. Given, II, Peter Hardy, Oscar L. Lopez, MaryAnn Oakley, Donna M. Simpson, M. Saleem Ismail, Connie Brand, Jennifer Richard, Ruth A. Mulnard, Gaby Thai, Catherine Mc-Adams-Ortiz, Ramon Diaz-Arrastia, Kristen Martin-Cook, Michael DeVous, Allan I. Levey, James J. Lah, Janet S. Cellar, Jeffrey M. Burns, Heather S. Anderson, Mary M. Laubinger, Liana Apostolova, Daniel H.S. Silverman, Po H. Lu, Neill R Graff-Radford, Francine Parfitt, Heather Johnson, Martin Farlow, Scott Herring, Ann M. Hake, Christopher H. van Dyck, Martha G. MacAvoy, Amanda L. Benincasa, Howard Chertkow, Howard Bergman, Chris Hosein, Sandra Black, Bojana Stefanovic, Curtis Caldwell, Ging-Yuek Robin Hsiung, Howard Feldman, Michele Assaly, Andrew Kertesz, John Rogers, Dick Trost, Charles Bernick, Donna Munic, Chuang-Kuo Wu, Nancy Johnson, Marsel Mesulam, Carl Sadowsky, Walter Martinez, Teresa Villena, Raymond Scott Turner, Kathleen Johnson, Brigid Reynolds, Reisa A. Sperling, Dorene M. Rentz, Keith A. Johnson, Allyson Rosen, Jared Tinklenberg, Wes Ashford, Marwan Sabbagh, Donald Connor, Sandra Jacobson, Ronald Killiany, Alexander Norbash, Anil Nair, Thomas O. Obisesan, Annapurni Jayam-Trouth, Paul Wang, Alan Lerner, Leon Hudson, Paula Ogrocki, Charles DeCarli, Evan Fletcher, Owen Carmichael, Smita Kittur, Michael Borrie, T-Y Lee, Dr Rob Bartha, Sterling Johnson, Sanjay Asthana, Cynthia M. Carlsson, Steven G. Potkin, Adrian Preda, Dana Nguyen, Pierre Tariot, Adam Fleisher, Stephanie Reeder, Vernice Bates, Horacio Capote, Michelle Rainka, Barry A. Hendin, Douglas W. Scharre, Maria Kataki, Earl A. Zimmerman, Dzintra Celmins, Alice D. Brown, Godfrey Pearlson, Karen Blank, Karen Anderson, Andrew J. Saykin, Robert B. Santulli, Jessica Englert, Jeff D. Williamson, Kaycee M. Sink, Franklin Watkins, Brian R. Ott, Edward Stopa, Geoffrey Tremont, Stephen Salloway, Paul Malloy, Stephen Correia, Howard J. Rosen, Bruce L. Miller, Jacobo Mintzer, Crystal Flynn Longmire, and Kenneth Spicer
AUTHOR CONTRIBUTIONS
Dr. A. Caroli contributed to study design, led manuscript preparation and discussion of the results. Dr. A. Prestia performed data analysis, helped in manuscript preparation. Dr. S. Galluzzi contributed to discussion of the results and manuscript revision. Dr. C. Ferrari significantly helped in the statistical analysis. Drs. W. van der Flier and R. Ossenkoppele provided MRI data for VUMC patients, were involved in the discussion of the results, contributed to the manuscript revision. Drs. B. Van Berckel, F. Barkhof, and C. Teunissen were involved in imaging and CSF data collection, in the discussion of the results, contributed to the manuscript revision. Drs. A. Wall, S. Carter, M. Schöll, A. Nordberg, A. Drzezga, and P. Scheltens were involved in the writing of the manuscript, in the discussion of the results, contributed to the manuscript revision. Dr. I.H. Choo computed AD t sum for KUHH patients, provided KUHH MRI data, was involved in the discussion of the results, and contributed to the manuscript revision. Dr. T. Grimmer computed AD t sum for MUCH patients, provided MUCH MRI data, was involved in the discussion of the results, and contributed to the manuscript revision. Dr. A. Redolfi computed hippocampal volumes on MRI data, contributed to the manuscript revision. Dr. G.B. Frisoni led study conception and design, coled discussion of the results, contributed to manuscript revisions.
STUDY FUNDING
EU data collection and sharing: the study was supported by the Swedish Research Council (project 05817), the Strategic Research Program in Neuroscience at Karolinska Institutet, the Swedish Brain Power. This work was also supported by the following grants: sottoprogetto finalizzato Strategico 2006: “Strumenti e procedure diagnostiche per le demenze utilizzabili nella clinica ai fini della diagnosi precoce e differenziale, della individuazione delle forme a rapida o lenta progressione e delle forme con risposta ottimale alle attuali terapie”; Programma Strategico 2006, Convenzione 71; Programma Strategico 2007, Convenzione PS39, Ricerca Corrente Italian Ministry of Health. Some of the costs related to patient assessment and imaging and biomarker detection were funded thanks to an ad hoc grant from the Fitness e Solidarietà 2006 and 2007 campaigns. The analyses of MRI data presented in the report have been performed thanks to the neuGRID platform, which has received funding from the European Union Seventh Framework Programme (FP7/2007–2013) under grant agreement 283562. Alzheimer's Disease Neuroimaging Initiative (ADNI) data: data collection and sharing for this project was funded by the ADNI (NIH grant U01 AG024904) and DOD ADNI (Department of Defense award W81XWH-12-2-0012). ADNI is funded by the National Institute on Aging, the National Institute of Biomedical Imaging and Bioengineering, and through generous contributions from the following: Alzheimer's Association; Alzheimer's Drug Discovery Foundation; BioClinica, Inc.; Biogen Idec Inc.; Bristol-Myers Squibb Company; Eisai Inc.; Elan Pharmaceuticals, Inc.; Eli Lilly and Company; F. Hoffmann-La Roche Ltd. and its affiliated company Genentech, Inc.; GE Healthcare; Innogenetics, N.V.; IXICO Ltd.; Janssen Alzheimer Immunotherapy Research & Development, LLC; Johnson & Johnson Pharmaceutical Research & Development LLC; Medpace, Inc.; Merck & Co., Inc.; Meso Scale Diagnostics, LLC; NeuroRx Research; Novartis Pharmaceuticals Corporation; Pfizer Inc.; Piramal Imaging; Servier; Synarc Inc.; and Takeda Pharmaceutical Company. The Canadian Institutes of Health Research is providing funds to support ADNI clinical sites in Canada. Private sector contributions are facilitated by the Foundation for the NIH (www.fnih.org). The grantee organization is the Northern California Institute for Research and Education, and the study is coordinated by the Alzheimer's Disease Cooperative Study at the University of California, San Diego. ADNI data are disseminated by the Laboratory for Neuro Imaging at the University of Southern California.
DISCLOSURE
The authors report no disclosures relevant to the manuscript. Go to Neurology.org for full disclosures.
REFERENCES
- 1.Ingelsson M, Fukumoto H, Newell KL, et al. Early Abeta accumulation and progressive synaptic loss, gliosis, and tangle formation in AD brain. Neurology 2004;62:925–931. [DOI] [PubMed] [Google Scholar]
- 2.Jack CR, Jr, Lowe VJ, Weigand SD, et al. ; Alzheimer's Disease Neuroimaging Initiative. Serial PIB and MRI in normal, mild cognitive impairment and Alzheimer's disease: implications for sequence of pathological events in Alzheimer's disease. Brain 2009;132:1355–1365. [DOI] [PMC free article] [PubMed] [Google Scholar]
- 3.Jack CR, Jr, Knopman DS, Jagust WJ, et al. Hypothetical model of dynamic biomarkers of the Alzheimer's pathological cascade. Lancet Neurol 2010;9:119–128. [DOI] [PMC free article] [PubMed] [Google Scholar]
- 4.Jack CR, Jr, Holtzman DM. Biomarker modeling of Alzheimer's disease. Neuron 2013;80:1347–1358. [DOI] [PMC free article] [PubMed] [Google Scholar]
- 5.Sperling RA, Aisen PS, Beckett LA, et al. Toward defining the preclinical stages of Alzheimer's disease: recommendations from the National Institute on Aging–Alzheimer's Association workgroups on diagnostic guidelines for Alzheimer's disease. Alzheimers Dement 2011;7:280–292. [DOI] [PMC free article] [PubMed] [Google Scholar]
- 6.Jack CR, Jr, Knopman DS, Weigand SD, et al. An operational approach to National Institute on Aging–Alzheimer's Association criteria for preclinical Alzheimer disease. Ann Neurol 2012;71:765–775. [DOI] [PMC free article] [PubMed] [Google Scholar]
- 7.Petersen RC, Aisen P, Boeve BF, et al. Criteria for mild cognitive impairment due to Alzheimer's disease in the community. Ann Neurol 2013;74:199–208. [DOI] [PMC free article] [PubMed] [Google Scholar]
- 8.Dickerson BC, Wolk DA; Alzheimer's Disease Neuroimaging Initiative. Biomarker-based prediction of progression in MCI: comparison of AD signature and hippocampal volume with spinal fluid amyloid-β and tau. Front Aging Neurosci 2013;5:55. [DOI] [PMC free article] [PubMed] [Google Scholar]
- 9.Knopman DS, Jack CR, Jr, Wiste HJ, et al. Brain injury biomarkers are not dependent on β amyloid in normal elderly. Ann Neurol 2012;73:472–480. [DOI] [PMC free article] [PubMed] [Google Scholar]
- 10.Jagust WJ, Landau SM. Apolipoprotein E, not fibrillar β amyloid, reduces cerebral glucose metabolism in normal aging. J Neurosci 2012;32:18227–18233. [DOI] [PMC free article] [PubMed] [Google Scholar]
- 11.Reiman EM, Quiroz YT, Fleisher AS, et al. Brain imaging and fluid biomarker analysis in young adults at genetic risk for autosomal dominant Alzheimer’s disease in the presenilin 1 E280A kindred: a case-control study. Lancet Neurol 2012;11:1048–1056. [DOI] [PMC free article] [PubMed] [Google Scholar]
- 12.Bateman RJ, Xiong C, Benzinger TL, et al. Clinical and biomarker changes in dominantly inherited Alzheimer's disease. N Engl J Med 2012;367:795–804. [DOI] [PMC free article] [PubMed] [Google Scholar]
- 13.Wirth M, Villeneuve S, Haase CM, et al. Associations between Alzheimer disease biomarkers, neurodegeneration, and cognition in cognitively normal older people. JAMA Neurol 2013;70:1512–1519. [DOI] [PMC free article] [PubMed] [Google Scholar]
- 14.Wirth M, Madison CM, Rabinovici GD, Oh H, Landau SM, Jagust WJ. Alzheimer's disease neurodegenerative biomarkers are associated with decreased cognitive function but not β-amyloid in cognitively normal older individuals. J Neurosci 2013;33:5553–5563. [DOI] [PMC free article] [PubMed] [Google Scholar]
- 15.Chételat G. Alzheimer disease: Aβ-independent processes—rethinking preclinical AD. Nat Rev Neurol 2013;9:123–124. [DOI] [PMC free article] [PubMed] [Google Scholar]
- 16.Petersen RC, Smith GE, Waring SC, Ivnik RJ, Tangalos EG, Kokmen E. Mild cognitive impairment: clinical characterization and outcome. Arch Neurol 1999;56:303–308. [DOI] [PubMed] [Google Scholar]
- 17.Prestia A, Caroli A, van der Flier WM, et al. Prediction of dementia in MCI patients based on core diagnostic markers for Alzheimer disease. Neurology 2013;80:1048–1056. [DOI] [PubMed] [Google Scholar]
- 18.Herholz K, Salmon E, Perani D, et al. Discrimination between Alzheimer dementia and controls by automated analysis of multicenter FDG PET. Neuroimage 2002;17:302–316. [DOI] [PubMed] [Google Scholar]
- 19.Knopman DS, Jack CR, Jr, Wiste HJ, et al. Short-term clinical outcomes for stages of NIA-AA preclinical Alzheimer disease. Neurology 2012;78:1576–1582. [DOI] [PMC free article] [PubMed] [Google Scholar]
- 20.Vos SJ, Xiong C, Visser PJ, et al. Preclinical Alzheimer's disease and its outcome: a longitudinal cohort study. Lancet Neurol 2013;12:957–965. [DOI] [PMC free article] [PubMed] [Google Scholar]
- 21.Beach TG, Monsell SE, Phillips LE, Kukull W. Accuracy of the clinical diagnosis of Alzheimer disease at National Institute on Aging Alzheimer Disease Centers, 2005–2010. J Neuropathol Exp Neurol 2012;71:266–273. [DOI] [PMC free article] [PubMed] [Google Scholar]
- 22.Mattsson N, Andreasson U, Persson S, et al. ; Alzheimer's Association QC Program Work Group. CSF biomarker variability in the Alzheimer's Association quality control program. Alzheimers Dement 2013;9:251–261. [DOI] [PMC free article] [PubMed] [Google Scholar]
- 23.Giannakopoulos P, Herrmann FR, Bussiere T, et al. Tangle and neuron numbers, but not amyloid load, predict cognitive status in Alzheimer's disease. Neurology 2003;60:1495–1500. [DOI] [PubMed] [Google Scholar]
- 24.Barkhof F, Polvikoski TM, van Straaten EC, et al. The significance of medial temporal lobe atrophy: a postmortem MRI study in the very old. Neurology 2007;69:1521–1527. [DOI] [PubMed] [Google Scholar]
- 25.Blennow K, Zetterberg H, Fagan AM. Fluid biomarkers in Alzheimer disease. Cold Spring Harb Perspect Med 2012;2:a006221. [DOI] [PMC free article] [PubMed] [Google Scholar]
- 26.Jagust WJ, Landau SM, Shaw LM, et al. Relationships between biomarkers in aging and dementia. Neurology 2009;73:1193–1199. [DOI] [PMC free article] [PubMed] [Google Scholar]
- 27.Zwan M, van Harten A, Ossenkoppele R, et al. Concordance between cerebrospinal fluid biomarkers and [11C]PIB PET in a memory clinic cohort. J Alzheimers Dis 2014;41:801–807. [DOI] [PubMed] [Google Scholar]
- 28.del Campo M, Mollenhauer B, Bertolotto A, et al. Recommendations to standardize preanalytical confounding factors in Alzheimer's and Parkinson's disease cerebrospinal fluid biomarkers: an update. Biomark Med 2012;6:419–430. [DOI] [PubMed] [Google Scholar]
- 29.Blennow K, Dubois B, Fagan AM, Lewczuk P, de Leon MJ, Hampel H. Clinical utility of cerebrospinal fluid biomarkers in the diagnosis of early Alzheimer's disease. Alzheimers Dement Epub May 2, 2014. [DOI] [PMC free article] [PubMed] [Google Scholar]
- 30.Prestia A, Caroli A, Herholz K, et al. Diagnostic accuracy of markers for prodromal Alzheimer’s disease in independent clinical series. Alzheimers Dement 2013;9:677–686. [DOI] [PMC free article] [PubMed] [Google Scholar]
Associated Data
This section collects any data citations, data availability statements, or supplementary materials included in this article.