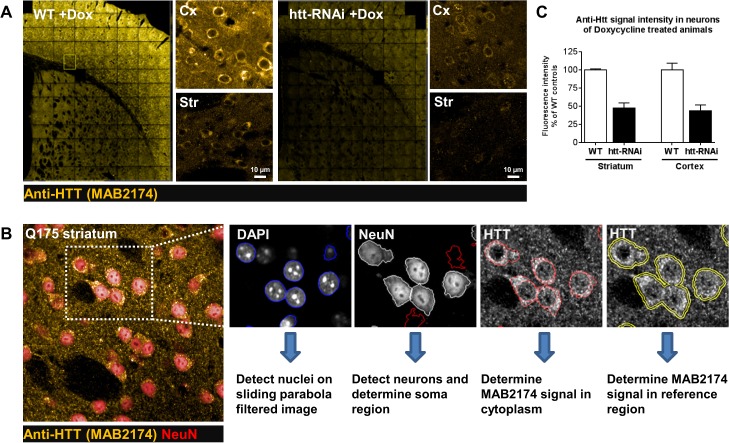
Fig 7. Illustration of pan HTT analysis in zQ175 and HTT conditional knockdown animals.
(A) Representative images depicting MAB2174-ir in the cortex and striatum of wild type and Htt conditional knockdown mice (htt-RNAi). (B) Illustration showing the image segmentation for quantifying cytoplasmic endogeneous HTT expression in neurons. Nuclear area was selected based on the DAPI signal. NeuN staining was used to identify neurons and to define the cytoplasmic region. Within this region, HTT levels were quantified by determining mean pixel intensity of MAB2174 antibody staining. Due to variability in staining intensity, MAB2174 signals were corrected for mean fluorescent intensities of a reference region around the cytoplasmic region. (C) Quantification of MAB2174 pan HTT staining in the cortex and striatum of wild type and htt-RNAi mice. In both brain regions, MAB2174-ir was below 50% as compared to wild type controls. Data are displayed as bar graphs with mean +/-SD. Mean values were calculated from 1 (striatum) or 2 (cortex) animals with an n of 3 sections per animal.

