
Figure 2.
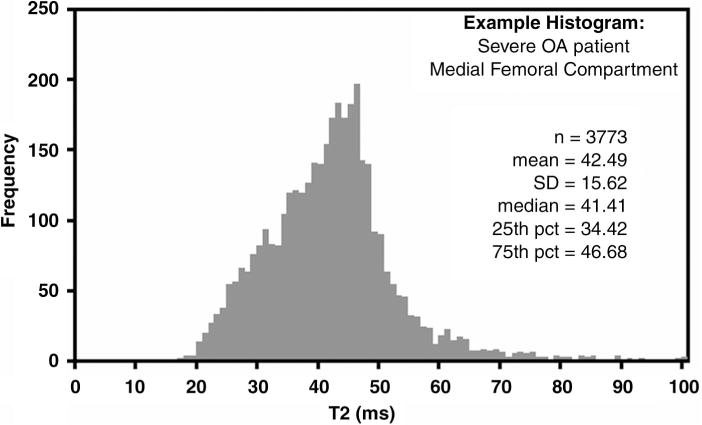
Graph shows distribution of T2 values in the medial femur cartilage compartment in 76-year-old man with severe OA. pct percentile.
Official websites use .gov
A
.gov website belongs to an official
government organization in the United States.
Secure .gov websites use HTTPS
A lock (
) or https:// means you've safely
connected to the .gov website. Share sensitive
information only on official, secure websites.
Graph shows distribution of T2 values in the medial femur cartilage compartment in 76-year-old man with severe OA. pct percentile.