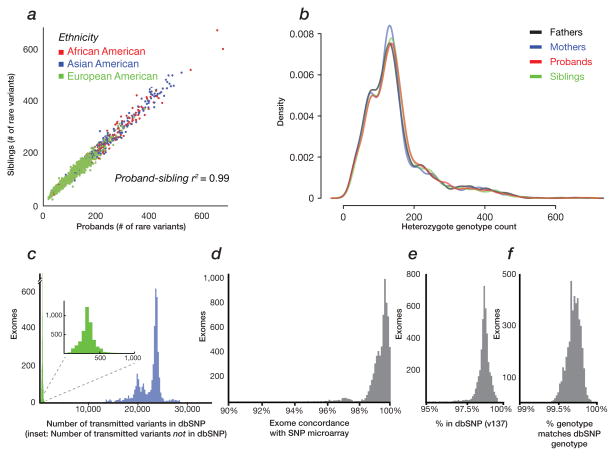
Figure 1. SNV quality assessment.
SNVs were identified based on the intersection of FreeBayes and GATK variant callers. The panels display a) proband-sibling concordance for number of private SNVs (Pearson’s r2 > 0.99) and stratified by population (calculated by PCA using EIGENSTRAT on SNV markers); b) the number and distribution of private, heterozygous genotypes that do not differ significantly between mothers, fathers, probands or siblings (p-values > 0.3 for all comparisons); c) the number of transmitted SNVs per exome in dbSNP (blue) or novel (green); d) concordance between exome and SNP microarray calls 19 (Sanders unpublished); e) fraction of events per exome found in dbSNP; f) genotype concordance of SNVs found in dbSNP, per exome.

