
Fig. 5.
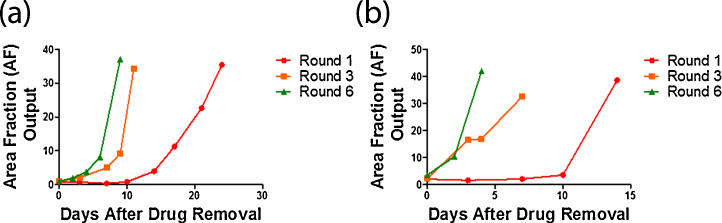
Tracking cell recovery using AF. Graphs show the recovery of cells over a period of days after carboplatin exposure. The cells received 3-day exposures to carboplatin every 4–5 weeks. Each dose of drug received, denotes a new round of drugging (Round 1–6). The x-axis shows the days after the drug has been removed from the cells and the y-axis gives the AF output at each time point measured. (a) OVCAR8 cells after exposure to 4 μg/ml carboplatin. (b) UPN251 cells after exposure to 2 μg/ml carboplatin.