

Abstract
Objective
We investigated associations between changes in national food energy supply and in average population body weight.
Methods
We collected data from 24 high-, 27 middle- and 18 low-income countries on the average measured body weight from global databases, national health and nutrition survey reports and peer-reviewed papers. Changes in average body weight were derived from study pairs that were at least four years apart (various years, 1971–2010). Selected study pairs were considered to be representative of an adolescent or adult population, at national or subnational scale. Food energy supply data were retrieved from the Food and Agriculture Organization of the United Nations food balance sheets. We estimated the population energy requirements at survey time points using Institute of Medicine equations. Finally, we estimated the change in energy intake that could theoretically account for the observed change in average body weight using an experimentally-validated model.
Findings
In 56 countries, an increase in food energy supply was associated with an increase in average body weight. In 45 countries, the increase in food energy supply was higher than the model-predicted increase in energy intake. The association between change in food energy supply and change in body weight was statistically significant overall and for high-income countries (P < 0.001).
Conclusion
The findings suggest that increases in food energy supply are sufficient to explain increases in average population body weight, especially in high-income countries. Policy efforts are needed to improve the healthiness of food systems and environments to reduce global obesity.
Résumé
Objectif
Nous avons enquêté sur les associations entre l’évolution des disponibilités énergétiques alimentaires nationales et celle du poids moyen des populations.
Méthodes
Nous avons collecté les données de 24 pays à revenu élevé, 27 pays à revenu intermédiaire et 18 pays à faible revenu concernant le poids moyen de la population, tel que renseigné dans les bases de données mondiales, les rapports d'enquêtes nationales sur la santé et la nutrition et des articles examinés par comité de lecture. Les changements de poids ont été déterminés par des paires d'études espacées d’au moins quatre années d'intervalle (diverses années sur la période 1971 à 2010). Les paires d'études sélectionnées sont considérées comme représentatives d'une population adolescente ou adulte, à des échelles nationales ou sous-nationales. Les données relatives aux disponibilités énergétiques alimentaires ont été extraites des bilans des disponibilités alimentaires de l'Organisation des Nations Unies pour l'alimentation et l'agriculture (FAO). Nous avons estimé les besoins caloriques des populations aux moments de réalisation des enquêtes en utilisant les équations de l'Institute of Medicine (IOM). Enfin, à l'aide d'un modèle validé expérimentalement, nous avons estimé le changement de l'apport calorique qui pourrait correspondre théoriquement aux changements observés du poids moyen.
Résultats
Dans 56 pays, une augmentation de la disponibilité énergétique alimentaire a été associée à une augmentation du poids moyen. Dans 45 pays, l'augmentation de la disponibilité énergétique alimentaire a été plus importante que l'augmentation de l'apport calorique déduit du modèle. L'association entre l'évolution de la disponibilité énergétique alimentaire et le changement de poids a été statistiquement significative, de manière générale et dans les pays à revenu élevé (P < 0,001).
Conclusion
Ces résultats suggèrent que l'accroissement de la disponibilité énergétique alimentaire suffit à expliquer les augmentations du poids moyen de la population, notamment dans les pays à revenu élevé. Des efforts politiques sont nécessaires pour obtenir des environnements et systèmes alimentaires plus sains afin de réduire l'obésité à l'échelle mondiale.
Resumen
Objetivo
Se investigó la relación entre los cambios en el suministro nacional de energía alimentaria y el peso corporal medio de la población.
Métodos
Se recopilaron datos de 24 países de ingresos altos, 27 de ingresos medios y 18 de ingresos bajos en relación con el peso corporal medio a partir de bases de datos internacionales, informes de estudios sobre salud y nutrición nacional y estudios revisados por homólogos. Los cambios en el peso corporal medio se obtuvieron a partir de estudios por pares realizados con una diferencia de al menos cuatro años (distintos años, 1971-2010). Los estudios seleccionados se consideraron representativos de una población adolescente o adulta, a nivel nacional o subnacional. Los datos de suministro de energía alimentaria se obtuvieron de los balances sobre alimentación de la Organización de las Naciones Unidas para la Agricultura y la Alimentación. Se calcularon los requisitos energéticos de la población en el momento de la realización de los estudios utilizando ecuaciones del Instituto de Medicina. Por último, se calculó el cambio en la ingesta de energía que, en teoría, podría explicar el cambio observado en el peso corporal medio mediante el uso de un modelo experimentalmente validado.
Resultados
En 56 países, se relacionó un aumento del suministro de energía alimentaria con un aumento del peso corporal medio. En 45 países, el aumento del suministro de energía alimentaria fue mayor que el aumento de ingesta energética previsto en el modelo. La relación entre el cambio en el suministro energético alimentario y el cambio en el peso corporal fue estadísticamente significativo en general y en países de ingresos altos (P < 0,001).
Conclusión
Los resultados sugieren que el incremento en el suministro de energía alimentaria basta para explicar el aumento del peso corporal medio de la población, en especial en países de ingresos altos. Es necesario que los políticos se esfuercen por mejorar la salubridad de los entornos y sistemas alimentarios para reducir la obesidad mundial
ملخص
الغرض
قمنا بتقصي الارتباطات ما بين التغيرات في إمدادات الطاقة الغذائية الوطنية وفي متوسط وزن الجسم للسكان.
الطريقة
لقد جمعنا بيانات من 24 بلدًا من البلدان عالية الدخل و27 بلدًا متوسط الدخل و18 بلدًا منخفض الدخل حول متوسط وزن الجسم من قواعد البيانات العالمية، وتقارير المسح الوطنية للصحة والتغذية، والدراسات التي خضعت لاستعراضات نديّة. وكانت التغيرات في متوسط وزن الجسم مستمدة من أزواج الدراسة التي تباعدت لمدة أربع سنوات على الأقل (سنوات عديدة، في الفترة ما بين عام 1971 إلى عام 2010). وتم اعتبار أزواج الدراسة المختارة لتكون ممثلة للقطاعات السكانية في سن المراهقة أو البالغين على الصعيد الوطني أو دون الوطني. تم الحصول على بيانات إمدادات الطاقة الغذائية من الميزانيات التموينية لمنظمة الأغذية والزراعة التابعة للأمم المتحدة. وقد قدّرنا متطلبات الطاقة للسكان في فترات زمنية للمسح باستخدام المعادلات الخاصة بمعهد الطب. وأخيرًا، قدّرنا التغير في مدخول الطاقة الذي قد يكون مسؤولاً من الناحية النظرية عن التغير الخاضع للرصد في متوسط وزن الجسم باستخدام نموذج تم التحقق من مصداقيته من واقع التجارب.
النتائج
في 56 بلدًا، ارتبطت الزيادة في إمدادات الطاقة الغذائية بزيادة في متوسط وزن الجسم. في 45 بلدًا، كانت الزيادة في إمدادات الطاقة الغذائية أعلى من زيادة مدخول الطاقة الغذائية التي تنبأ بها النموذج. وكان الارتباط بين التغير في إمدادات الطاقة الغذائية والتغير في وزن الجسم ملموسًا من الناحية الإحصائية بشكل إجمالي وبالنسبة للبلدان عالية الدخل ( الاحتمال > 0.001).
الاستنتاج
تشير النتائج إلى أن الزيادات في إمدادات الطاقة الغذائية كافية لشرح الزيادات في متوسط وزن الجسم للسكان، ولا سيما في البلدان عالية الدخل. وهناك حاجة إلى بذل جهود من خلال السياسات لتحسين سلامة النظم والبيئات الغذائية لخفض معدلات السمنة العالمية.
摘要
目的
我们调查了全国食品能量供给和人口平均体重之间的变化联系。
方法
我们从 18 个低收入国家的平均体重数据。平均体重的变化来源于最少相差 4 年的两组研究(不同年份,1971–2010 年)。所选的两组研究被认为是代表了国家或地方范围内青少年或成年人口的情况。食品能量供给的数据是从联合国粮食和农业组织的食品平衡表检索而得。我们采用医学研究所的方程式估计了在调查时间点的人口能量需求。最后,我们通过模型估计了能够在理论上对平均体重观察得到的变化产生影响的能量摄入的变化情况。
结果
在 56 个国家中,食品能量供给的增加与平均体重的增加相互联系。与通过模型预测的能量摄入相比, 45 个国家中食品能量供给的增加更高。能量供给变化与体重变化之间的联系在高收入国家中从整体上存在统计学上的显著差异 (P < 0.001)。
结论
结果表明食品能量供给的增加足以构成平均人口体重增加的原因,尤其是在高收入国家。我们还需要加大政策力度,改善食品系统和环境的健康,从而降低全球肥胖率。
Резюме
Цель
Исследование взаимосвязи между изменениями в калорийности продуктов питания и средней массы тела у населения.
Методы
Были собраны данные о средней массе тела у населения на основании глобальных баз данных, рецензируемых документов и отчетов о национальном исследовании состояния здоровья и питания населения. Анализ проводился по данным из 24 стран с высоким уровнем дохода, 27 стран со средним уровнем дохода и 18 стран с низким уровнем дохода. Информация об изменении средней массы тела была получена в ходе исследования пар, возраст которых отличался как минимум на четыре года (различные года в период с 1971 по 2010 г.). Выбранные для исследования пары считались характерными для подросткового и взрослого населения на национальном или субнациональном уровне. Данные о калорийности пищи были получены из продовольственного баланса Продовольственной и сельскохозяйственной Организации Объединенных Наций. Энергетические потребности населения оценивались на момент исследования с использованием уравнений Института медицины. Изменения в калорийности потребляемой пищи, которые теоретически могли служить причиной для наблюдаемого изменения средней массы тела, оценивались с использованием экспериментально проверенной модели.
Результаты
В 56 странах повышение калорийности пищи было связано с увеличением средней массы тела. В 45 странах повышение калорийности пищи превышало значение, прогнозируемое моделью. Взаимосвязь между изменением калорийности пищи и изменением массы тела была статистически значима повсеместно, в том числе и для стран с высоким уровнем дохода (P < 0,001).
Вывод
Результаты исследований свидетельствуют о том, что повышение калорийности пищи с достаточной вероятностью объясняет увеличение средней массы тела у населения, особенно в странах с высоким уровнем дохода. Для снижения уровня ожирения в мировом масштабе нужно предпринимать стратегические меры, направленные на создание пищевого окружения и систем питания, в большей мере способствующих здоровому уровню жизни.
Introduction
Overweight and obesity have become major global public health problems. Worldwide, the proportion of adults with a body mass index (BMI) of 25 kg/m2 or greater increased from 28.8% to 36.9% in men, and from 29.8% to 38.0% in women between 1980 and 2013.1 Urgent action from governments and the food industry is needed to curb the epidemic.2 Action needs to be directed at the main drivers of the epidemic to meet the global target of halting the rise in obesity by 2025.3
The drivers of the obesity epidemic have been much debated.4–7 An increased food energy supply and the globalization of the food supply, increasing the availability of obesogenic ultra-processed foods, are arguments for a predominant food system driver5 of population weight gain. Increasing motorization and mechanization, time spent in front of small screens and a decrease in transport and occupational physical activity, point to reducing physical activity as a predominant driver6,8 of the obesity epidemic.
A model used to predict body-weight gain, assuming no change in physical activity, follows the simple rule that a sustained increase in energy intake of 100 kJ per day leads to a predicted increase of 1 kg body weight on average, with half of the weight gain being achieved in about one year and 95% in about three years.9 According to this model, the oversupply of food energy is sufficient to drive the increase in energy intake and increases in body weight observed in the United Kingdom of Great Britain and Northern Ireland and the United States of America.9–11 This is despite the fact that, in the United States, food waste has increased by approximately 50% since 1974, reaching about 5800 kJ per person per day in 2003.12 Here we test the hypothesis that an increase in food energy supply is sufficient to explain increasing population body weight, using data from 24 high-income, 27 middle-income and 18 low-income countries.
Methods
Food energy supply
Food balance sheets of the Food and Agriculture Organization of the United Nations (FAO) estimate the food supply of countries, by balancing local production, country-wide stocks and imports with exports, agricultural use for livestock, seed and some components of waste. Waste on the farm, during distribution and processing, as well as technical losses due to transformation of primary commodities into processed products are usually taken into account. However, losses of edible food, e.g. during storage, preparation and cooking, as plate-waste or domestic animal feed, or thrown away, are not considered. The data are expressed as the annual per capita supply of each food item available for human consumption.13 The FAO’s database contains national level data from 1961 to 2010 for 183 countries. For each country, data on food energy supply were extracted to match the time periods of data on adult body weight.
Measured body weight
Three major strategies were used to collect data on measured average adult body weight. First, an electronic search of major databases on obesity prevalence and BMI was performed, including the World Health Organization’s (WHO) global infobase,14 WHO’s global database on BMI,15 the International Association for the Study of Obesity (now World Obesity Federation) database16 and the Organisation for Economic Co-operation and Development’s health data.17 As these databases only included data on obesity rates or mean BMI, the original sources of the data were searched. Second, data on average measured body weight were gathered from reports of national health and nutrition surveys in various countries. The WHO MONICA project18 and WHO STEPwise approach to surveillance (STEPS) country reports19 included anthropometric measures for male and female adult samples. We also calculated body weight for women of child-bearing age using mean BMI and height data from Demographic and Health Surveys.20 Third, an electronic search of Medline was conducted. For each country, a separate search was performed using the following keywords: “obesity”, “weight”, “anthropometric”, “BMI”, “health survey” and “national survey” (using the Boolean operator OR). Finally, specific national health and/or nutrition surveys identified by some of the above sources were electronically searched.
Studies fulfilling the following criteria were extracted: (i) weight was measured after 1961 and again before 2010 (to match the FAO food balance sheet data); (ii) the study samples were representative of a national or subnational adolescent or adult population; (iii) the survey method was comparable with previous or future surveys conducted in the country; (iv) the year in which each survey was conducted could be identified; at least four years elapsed between the two surveys; and (v) FAO food supply data were available for the relevant period.
If there were more than two eligible studies from a country, the surveys which we judged to be the best quality were included. Criteria for estimating study quality included national representativeness, sample size and length of time between surveys.
Demographic data
Demographic data (total population, by age and sex) were retrieved from the United Nations Department of Economic and Social Affairs.21 Average female and male height at survey time points were derived from http://www.averageheight.co/. For 13 countries, data were not available and average height data from a neighbouring country were used for calculating energy requirements.
Data analysis
Three types of analysis were performed. First, we compared the changes in food energy supply with changes in average body weight over time for each country. Second, estimates of population energy requirements at survey time points were performed for each country using Institute of Medicine equations.22 Low active physical activity levels (1.4 ≤ PAL <1.6) were assumed for high- and upper-middle-income countries. Active physical activity levels (1.6 ≤ PAL <1.9) were used for all other countries. Finally, we used a physiologically-based, experimentally-validated predictive energy intake body-weight model, to estimate the change in average population energy intake that would be required to account for the observed change in average body weight.9
Results
In total, 83 countries had at least two surveys with data on measured body weight; 24 countries had more than two surveys at different time points. We excluded countries where the period between surveys was less than four years (eight countries), survey populations were not comparable in terms of area representativeness (eight countries) or FAO food supply data for the country were not available (three countries). Survey pairs from 69 countries were included. Of those, 36 survey pairs included data for women of childbearing age only. One survey pair (Saudi Arabia) included data for men only. Data from 24 high-income, 27 middle-income and 18 low-income countries were included. The average period between the surveys was 12 years (range 4–37 years; Table 1). At the time of the initial survey, food energy supply was greater than the average energy requirements in 52 countries. For 37 of these countries, this excess food energy supply was more than 2000 kJ/day (Table 1).
Table 1. Countries and surveys included in a global analysis of food energy supply and body weight, 1971–2010.
| Country |
Income level of country |
Year |
Age range, years |
Food energy supply, kJ/day |
||||||
|---|---|---|---|---|---|---|---|---|---|---|
| First survey | Second survey | Survey 1 | Survey 2 | First survey | Second survey | First survey | Change | Excess at the first survey | ||
| Algeria | Upper-MIC | 1986 | 2003 | Cross-sectional survey | STEPS Survey | 16–65 | 25–64 | 11 385 | 1 464 | 2 958 |
| Australia | HIC | 1995 | 2007 | National Nutrition Survey | National Health Survey | ≥ 18 | ≥ 18 | 12 929 | 594 | 2 987 |
| Bangladesh | LIC | 1996 | 2007 | National Demographic Health Survey | National Demographic Health Survey | 15–49 | 15–49 | 8 849 | 1 423 | 506 |
| Barbados | HIC | 1995 | 2000 | ICSHIB Study | Food Consumption and Anthropometric Survey | ≥ 25 | 18–96 | 11 996 | −146 | 2 414 |
| Belgium | HIC | 1986 | 1991 | WHO MONICA | WHO MONICA | 25–34 | 25–34 | 14 439 | 515 | 4 008 |
| Benin | LIC | 1996 | 2001 | National Demographic Health Survey | National Demographic Health Survey | 15–49 | 15–49 | 9 929 | 54 | 715 |
| Bolivia (Plurinational State of) | Lower-MIC | 1994 | 2008 | National Demographic Health Survey | National Demographic Health Survey | 15–49 | 15–49 | 8 376 | 544 | −285 |
| Burkina Faso | LIC | 1993 | 1998 | National Demographic Health Survey | National Demographic Health Survey | 15–49 | 15–49 | 10 092 | −109 | 728 |
| Cambodia | LIC | 2000 | 2010 | National Demographic Health Survey | STEPS Survey | 15–49 | 25–64 | 8 908 | 1 059 | 197 |
| Cameroon | Lower-MIC | 1998 | 2004 | National Demographic Health Survey | National Demographic Health Survey | 15–49 | 15–49 | 8 870 | 774 | −649 |
| Canada | HIC | 1971 | 2008 | Nutrition Canada Survey | Canadian Community Health Survey | 20–69 | ≥ 18 | 12 159 | 2 339 | 2 636 |
| Chad | LIC | 1996 | 2004 | National Demographic Health Survey | National Demographic Health Survey | 15–49 | 15–49 | 7 740 | 895 | −1 665 |
| Chile | HIC | 2003 | 2009 | National Health Survey | National Health Survey | ≥ 17 | ≥ 15 | 12 067 | 100 | 2 665 |
| China | Upper-MIC | 1991 | 2000 | China Health and Nutrition Survey | Cross-sectional survey | 20–45 | 35–74 | 10 447 | 1 548 | 1 996 |
| Colombia | Upper-MIC | 1995 | 2005 | National Demographic Health Survey | National Demographic Health Survey | 15–49 | 15–49 | 10 837 | 188 | 2 510 |
| Czech Republic | HIC | 1993 | 2002 | Health Status of the Czech Population Survey | Health Status of the Czech Population Survey | 15–75 | 15–75 | 12 719 | 833 | 2 653 |
| Denmark | HIC | 1983 | 1991 | WHO MONICA | WHO MONICA | 25–64 | 25–64 | 12 740 | 862 | 2 795 |
| Dominican Republic | Upper-MIC | 1991 | 1996 | National Demographic Health Survey | National Demographic Health Survey | 15–49 | 15–49 | 9 025 | 301 | 749 |
| Egypt | Lower-MIC | 1992 | 2005 | National Demographic Health Survey | National Demographic Health Survey | 15–49 | 15–49 | 13 142 | 741 | 3 284 |
| Eritrea | LIC | 1995 | 2003 | National Demographic Health Survey | National Demographic Health Survey | 15–49 | 15–49 | 6 569 | −63 | −2 272 |
| Ethiopia | LIC | 2000 | 2005 | National Demographic Health Survey | National Demographic Health Survey | 15–49 | 15–49 | 7 565 | 761 | −1 343 |
| Fiji | Upper-MIC | 1980 | 2004 | National Food and Nutrition Survey | STEPS Survey (National Nutrition Survey) | 18–55 | 18–55 | 10 372 | 2 301 | 88 |
| Finland | HIC | 1987 | 1997 | Cross-sectional population survey | Cross-sectional population survey | 25–64 | 25–64 | 12 318 | 849 | 2 289 |
| France | HIC | 1986 | 2009 | WHO MONICA | National Epidemiological Survey | 35–64 | ≥ 18 | 14 707 | 67 | 5 067 |
| Gabon | Upper-MIC | 2000 | 2009 | National Demographic Health Survey | STEPS Survey | 15–49 | 15–64 | 11 234 | 251 | 2 653 |
| Germany | HIC | 1983 | 2009 | WHO MONICA | Microcensus – Health Questions | 25–64 | ≥ 18 | 14 267 | 582 | 4 305 |
| Ghana | Lower-MIC | 1993 | 2003 | National Demographic Health Survey | National Demographic Health Survey | 15–49 | 15–49 | 9 468 | 1 289 | 213 |
| Haiti | LIC | 1994 | 2005 | National Demographic Health Survey | National Demographic Health Survey | 15–49 | 15–49 | 7 163 | 703 | −1 929 |
| Hungary | Upper-MIC | 1982 | 1987 | WHO MONICA | WHO MONICA | 25–64 | 25–64 | 14 836 | 753 | 4 640 |
| Iceland | HIC | 1983 | 1993 | WHO MONICA | WHO MONICA | 25–64 | 25–64 | 13 334 | −343 | 2 757 |
| India | Lower-MIC | 1998 | 2007 | National Demographic Health Survey | STEPS Survey | 15–49 | 15–64 | 9 657 | 113 | 715 |
| Indonesia | Lower-MIC | 1983 | 2001 | Cross-sectional survey | STEPS Survey | 15–49 | 15–65 | 9 615 | 276 | 1 423 |
| Iran (Islamic Republic of) | Upper-MIC | 2004 | 2009 | STEPS Survey | STEPS Survey | 15–65 | 15–64 | 13 129 | 25 | 3 540 |
| Ireland | HIC | 1985 | 2009 | Cross-sectional survey | National Adult Nutrition Survey | 35–64 | 18–64 | 14 966 | 109 | 5 209 |
| Israel | HIC | 1985 | 2000 | WHO MONICA | National Health and Nutrition Survey | 25–64 | 25–64 | 13 979 | 728 | 4 284 |
| Italy | HIC | 1983 | 1993 | WHO MONICA | WHO MONICA | 25–64 | 25–64 | 14 493 | 71 | 4 749 |
| Jordan | Upper-MIC | 1997 | 2002 | Cross-sectional survey | National Demographic Health Survey | ≥ 25 | 15–49 | 11 355 | 720 | 2 778 |
| Kazakhstan | Upper-MIC | 1995 | 1999 | National Demographic Health Survey | National Demographic Health Survey | 15–49 | 15–49 | 13 117 | −3 778 | 4 448 |
| Kenya | LIC | 1993 | 2003 | National Demographic Health Survey | National Demographic Health Survey | 15–49 | 15–49 | 7 954 | 444 | −1 318 |
| Lebanon | Upper-MIC | 1997 | 2009 | National cross-sectional survey | National cross-sectional survey | ≥ 20 | ≥ 20 | 12 924 | 268 | 2 983 |
| Madagascar | LIC | 1997 | 2005 | National Demographic Health Survey | STEPS Survey | 15–49 | 25–64 | 8 732 | 155 | −67 |
| Malawi | LIC | 1983 | 2009 | Cross-sectional survey | STEPS Survey | ≥ 15 | 25–64 | 9 012 | 686 | −690 |
| Malaysia | Upper-MIC | 1996 | 2005 | National Health & Morbidity Survey | STEPS Survey | ≥ 20 | 25–64 | 12 355 | −481 | 3 745 |
| Mali | LIC | 1995 | 2006 | National Demographic Health Survey | National Demographic Health Survey | 15–49 | 15–49 | 9 021 | 1 155 | −322 |
| Malta | HIC | 1984 | 2006 | WHO MONICA | Lifestyle Survey | 25–64 | 18–65 | 12 711 | 1 682 | 3 130 |
| Mauritania | Lower-MIC | 2000 | 2006 | National Demographic Health Survey | STEPS Survey | 15–49 | 15–64 | 11 351 | 59 | 1 636 |
| Mongolia | Lower-MIC | 2005 | 2009 | STEPS Survey | STEPS Survey | 15–64 | 15–64 | 9 410 | 774 | −891 |
| Morocco | Lower-MIC | 1992 | 2003 | National Demographic Health Survey | National Demographic Health Survey | 15–49 | 15–49 | 12 117 | 1 331 | 2 611 |
| Mozambique | LIC | 1997 | 2003 | National Demographic Health Survey | National Demographic Health Survey | 15–49 | 15–49 | 8 263 | 247 | −728 |
| Nepal | LIC | 1996 | 2007 | National Demographic Health Survey | STEPS Survey | 15–49 | 15–64 | 9 234 | 674 | 766 |
| Netherlands | HIC | 2000 | 2009 | Health Survey | Health Survey | 15–65 | 15–65 | 13 389 | 255 | 2 941 |
| New Zealand | HIC | 1982 | 2009 | WHO MONICA | NZ Adult Nutrition Survey | 35–64 | 15–71 | 12 878 | 389 | 3 234 |
| Niger | LIC | 1992 | 2006 | National Demographic Health Survey | National Demographic Health Survey | 15–49 | 15–49 | 8 142 | 1 598 | −1 025 |
| Nigeria | Lower-MIC | 1999 | 2003 | National Demographic Health Survey | National Demographic Health Survey | 15–49 | 15–49 | 11 109 | −134 | 1 741 |
| Norway | HIC | 1990 | 2001 | Prospective population-based survey | Prospective population-based survey | ≥ 20 | 20–79 | 13 196 | 992 | 3 280 |
| Peru | Upper-MIC | 1991 | 2009 | National Demographic Health Survey | National Demographic Health Survey | 15–49 | 15–49 | 9 075 | 1 653 | 874 |
| Poland | HIC | 1983 | 1992 | WHO MONICA | WHO MONICA | 35–64 | 35–64 | 14 046 | 243 | 4 339 |
| Rwanda | LIC | 2000 | 2005 | National Demographic Health Survey | National Demographic Health Survey | 15–49 | 15–49 | 7 812 | 674 | −1 385 |
| Saudi Arabia | HIC | 1996 | 2004 | Cross-sectional survey | STEPS Survey | ≥ 19 | 25–64 | 12 247 | 519 | 1 448 |
| Senegal | Lower-MIC | 1992 | 2005 | National Demographic Health Survey | National Demographic Health Survey | 15–49 | 15–49 | 9 427 | 506 | −155 |
| South Africa | Upper-MIC | 1998 | 2003 | National Demographic Health Survey | National Demographic Health Survey | 15–65 | 15–65 | 11 929 | 397 | 2 243 |
| Sweden | HIC | 1985 | 2001 | WHO MONICA | INTERGENE Project | 25–64 | 25–64 | 12 456 | 636 | 2 703 |
| Switzerland | HIC | 1985 | 1994 | WHO MONICA | WHO MONICA | 35–64 | 25–64 | 14 242 | −310 | 4 590 |
| Togo | LIC | 1998 | 2010 | National Demographic Health Survey | STEPS Survey | 15–49 | 15–64 | 9 150 | 736 | −469 |
| Turkey | Upper-MIC | 1993 | 2003 | National Demographic Health Survey | National Demographic Health Survey | 15–49 | 15–49 | 15 531 | −602 | 7 251 |
| United Kingdom | HIC | 1993 | 2009 | Health Survey for England | Health Survey for England | ≥ 16 | ≥ 16 | 13 468 | 891 | 3 724 |
| United States | HIC | 1972 | 2004 | National Health and Nutrition Examination Survey | National Health and Nutrition Examination Survey | 20–74 | 20–74 | 12 770 | 3 213 | 2 979 |
| Uzbekistan | Lower-MIC | 1996 | 2002 | National Demographic Health Survey | Health Examination Survey | 15–49 | 15–49 | 12 242 | −2 615 | 2 803 |
| Zimbabwe | LIC | 1994 | 1999 | National Demographic Health Survey | National Demographic Health Survey | 15–49 | 15–49 | 8 037 | 280 | −1 343 |
LIC: low-income country; Lower-MIC: lower-middle-income country; HIC: high-income country; ICSHIB: the International Comparative Study of Hypertension in Blacks; Upper-MIC: upper-middle-income country; WHO: World Health Organization.
Note: Estimations of population energy requirements were performed for each country using the Institute of Medicine equations for males and females.22 Energy excess was calculated by subtracting energy requirements at the first survey from the energy supply at the same survey.
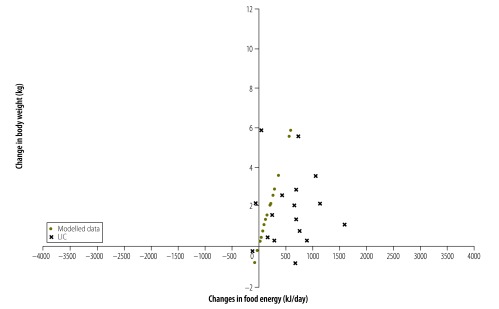
For 56 countries (81%) both food energy supply and body weight increased between the survey pairs. For 45 of these countries (80%) the increase in food energy supply was more than sufficient to explain the increase in average body weight. This is shown in Fig. 1 with 56/69 countries being in the top right quadrant and 45/56 being to the right of the model-predicted change in energy intake needed to produce the increase in mean body weight for that country. This same pattern was observed for countries of all income levels (Fig. 2, Fig. 3, Fig. 4 and Fig. 5). For 11 countries (Benin, Chile, the Dominican Republic, Gabon, India, Indonesia, Ireland, Italy, Lebanon, Mauritania and New Zealand) in the top right quadrant, the increase in food energy supply was insufficient to account for the observed increase in weight (Fig. 1).
Fig. 1.
Change in food energy supply and change in average body weight for 69 countries, 1971–2010
LIC: low-income countries; Lower-MIC: lower-middle-income countries; HIC: high-income countris; Upper-MIC: upper-middle-income countries.
Note: The dots representing the modelled data are the estimated change in energy intake required to account for the change in average body weight of the population.9

Fig. 2.
Change in food energy supply and change in average body weight for 24 high-income countries, 1971–2009
HIC: high-income countries.
Note: The dots representing the modelled data are the estimated change in energy intake required to account for the change in average body weight of the population.9

Fig. 3.
Change in food energy supply and change in average body weight for 15 upper-middle-income countries, 1980–2009
Upper-MIC: upper-middle-income countries.
Note: The dots representing the modelled data are the estimated change in energy intake required to account for the change in average body weight of the population.9

Fig. 4.
Change in food energy supply and change in average body weight for 12 lower-middle-income countries, 1983–2009
Lower-MIC: lower-middle-income countries.
Note: The dots representing the modelled data are the estimated change in energy intake required to account for the change in average body weight of the population.9

Fig. 5.
Change in food energy supply and change in average body weight for 18 low-income countries, 1983–2009
LIC: low-income countries.
Note: The dots representing the modelled data are the estimated change in energy intake required to account for the change in average body weight of the population.9
Five countries (Barbados, Burkina Faso, Kazakhstan, Nigeria and Switzerland) experienced reductions in both food energy supply and average body weight. For Kazakhstan the food energy supply decreased by 3778 kJ/day, from 13 117 kJ/day to 9339 kJ/day over a four year period (Table 1), accompanied by a decrease in average body weight of 0.9 kg. For the four other countries, decreases in food energy supply were much more modest (100–300 kJ/day; Table 1).
For five other countries (Eritrea, Iceland, Malaysia, Turkey and Uzbekistan), discordant changes were observed with reductions in food energy supply over the same period as increases in average body weight. The decrease in food energy supply was highest for Uzbekistan (2615 kJ/day) and lowest for Eritrea (63 kJ/day; Table 1). Apart from Eritrea, food energy supply at baseline for those five countries was relatively high (ranging from 12 242 to 15 531 kJ/day) and higher than the values of at least half of the other countries included in this study. In addition, excess food energy supply at baseline was high for those five countries (2757–7251 kJ/day; Table 1).
For three countries (the Islamic Republic of Iran, Rwanda and South Africa) there were discordant changes in the other direction with increases in food energy supply over the same period as reductions in average body weight. However, for two of those countries, the change in average weight was small (a reduction of 5 g for the Islamic Republic of Iran and 100 g for South Africa). In Rwanda, the reduction in weight was 800 g while the food energy supply over the same time period increased by 674 kJ/day (Table 1).
The correlation between the change in food energy supply and change in average body weight was significant (P = 0.011). When stratifying by type of country, associations were significant for high-income countries (P < 0.001), but not for other country groups.
Discussion
For most of the countries included in this study, the change in per capita food energy supply was greater than the change in food energy intake theoretically required to explain the observed change in average body weight. The associations between changes in food energy supply and average population body weight were significant overall and for high-income countries. This suggests that, in high-income countries, a growing and excessive food supply is contributing to higher energy intake, as well as to increasing food waste.12
Other factors, such as a decrease in physical activity, may also lead to an increase in body weight and could occur simultaneously with an increase in food energy supply. It has been shown that among 3.7 million participants in the United States at the county level, increased physical activity has only a very small impact on obesity prevalence.23 It is likely that in some countries, such as China, the impact of reduced physical activity on obesity is more important.24,25 A reduction in physical activity with no compensatory drop in energy intake will cause weight gain until sufficient weight is gained to create energy balance (through both an increased resting metabolic rate and increased energy required to move the larger body).
Researchers have suggested additional contributing factors for obesity, such as pollutants, infections and changes in the gut microbiota. These factors have an effect on metabolism, body composition and/or energy balance efficiencies. However, more evidence is needed to understand the importance of these factors in weight gain.26 Ideally, the cause of obesity in humans would be assessed through randomized controlled trials, where food energy availability is increased randomly and average body weight is then measured. However, such an experiment is not practical, since it is difficult to measure food intake over long time periods and it would require that non-obese subjects be randomly assigned to environments with different food energy supplies.
Our findings suggest that there is an excess of energy available from an increasing national average food energy supply in countries of varying income levels.9 Therefore, policy efforts need to focus on reducing population energy intake through improving the healthiness of food systems and environments.5,11,27 Achieving WHO’s target to halt the rise in obesity by 2025 will require major action by governments and the food industry.3 A combination of several policy actions will be needed to significantly improve diets and reduce overconsumption.2 These policies include restriction of unhealthy food marketing to children, front-of-pack supplementary nutrition labelling,28 food pricing strategies,29 improving the quality of foods in schools30 and other public sector settings. The impact of trade and investment agreements31 and agricultural policies32 on domestic food environments should be assessed.
The main strength of this study is the inclusion of nationally representative body weight and food energy supply data for a range of countries and over many years. Weaknesses include the limitations on the measurement of national per capita food energy supply (e.g. losses of edible food during storage, preparation and cooking, as plate-waste or domestic animal feed, and subsistence farming are not taken into account) and the variable quality of energy supply data. In addition, low- and middle-income countries, in different phases of the nutrition transition,33,34 are likely to have poorer data and have higher levels of subsistence farming, which is not included in the FAO food supply data.13
The association between changes in food supply and changes in body weight may be confounded by changes in physical activity levels, changes in food waste or changes in the demographic profile of countries. Demographic changes, particularly size, ageing, and racial/ethnic diversification of populations, may contribute to increasing obesity levels.35 About half the data sets on weight status used in this study are for women only and thus only represent half of the population. A limitation of the energy-balance model is that it assumes that metabolic physiology and physical activity levels are similar globally. While this is likely to be true for industrialized countries for which accurate data on the relationship between energy expenditure and body weight are available and for which the model has been calibrated, it is not clear how well this assumption applies for developing countries. The model also assumes that population-wide changes in physical activity are negligible over the periods investigated.
In conclusion, in high-income countries, observed increases in body weight over recent decades are associated with increased food energy supply. In addition, increases in food energy supply are sufficient to explain increases in average population weight. Due to the nutrition transition and a potential decrease in physical activity, the same pattern is expected to occur in low- and middle-income countries in the future. Policy efforts should focus on reducing population energy intake through improving the healthiness of food systems and environments.
Funding:
Stefanie Vandevijvere and Boyd Swinburn are funded by the University of Auckland Vice Chancellor’s strategic fund. Carson Chow and Kevin Hall are funded by the intramural research programme of the NIH’s National Institute of Diabetes and Digestive and Kidney Diseases (NIDDK), USA.
Competing interests:
None declared.
References
- 1.Ng M, Fleming T, Robinson M, Thomson B, Graetz N, Margono C, et al. Global, regional, and national prevalence of overweight and obesity in children and adults during 1980–2013: a systematic analysis for the Global Burden of Disease Study 2013. Lancet. 2014. August 30;384(9945):766–81. 10.1016/S0140-6736(14)60460-8 [DOI] [PMC free article] [PubMed] [Google Scholar]
- 2.Gortmaker SL, Swinburn BA, Levy D, Carter R, Mabry PL, Finegood DT, et al. Changing the future of obesity: science, policy, and action. Lancet. 2011. August 27;378(9793):838–47. 10.1016/S0140-6736(11)60815-5 [DOI] [PMC free article] [PubMed] [Google Scholar]
- 3.Global action plan for the prevention and control of noncommunicable diseases 2013-2020. Geneva: World Health Organization; 2013. [Google Scholar]
- 4.James WP. The fundamental drivers of the obesity epidemic. Obes Rev. 2008. March;9(s1) Suppl 1:6–13. 10.1111/j.1467-789X.2007.00432.x [DOI] [PubMed] [Google Scholar]
- 5.Swinburn BA, Sacks G, Hall KD, McPherson K, Finegood DT, Moodie ML, et al. The global obesity pandemic: shaped by global drivers and local environments. Lancet. 2011. August 27;378(9793):804–14. 10.1016/S0140-6736(11)60813-1 [DOI] [PubMed] [Google Scholar]
- 6.Frank LD, Andresen MA, Schmid TL. Obesity relationships with community design, physical activity, and time spent in cars. Am J Prev Med. 2004. August;27(2):87–96. 10.1016/j.amepre.2004.04.011 [DOI] [PubMed] [Google Scholar]
- 7.Bleich SN, Ku R, Wang YC. Relative contribution of energy intake and energy expenditure to childhood obesity: a review of the literature and directions for future research. Int J Obes. 2011. January;35(1):1–15. 10.1038/ijo.2010.252 [DOI] [PubMed] [Google Scholar]
- 8.McCormack GR, Virk JS. Driving towards obesity: a systematized literature review on the association between motor vehicle travel time and distance and weight status in adults. Prev Med. 2014. September;66:49–55. 10.1016/j.ypmed.2014.06.002 [DOI] [PubMed] [Google Scholar]
- 9.Hall KD, Sacks G, Chandramohan D, Chow CC, Wang YC, Gortmaker SL, et al. Quantification of the effect of energy imbalance on body weight. Lancet. 2011. August 27;378(9793):826–37. 10.1016/S0140-6736(11)60812-X [DOI] [PMC free article] [PubMed] [Google Scholar]
- 10.Swinburn B, Sacks G, Ravussin E. Increased food energy supply is more than sufficient to explain the US epidemic of obesity. Am J Clin Nutr. 2009. December;90(6):1453–6. 10.3945/ajcn.2009.28595 [DOI] [PubMed] [Google Scholar]
- 11.Scarborough P, Burg MR, Foster C, Swinburn B, Sacks G, Rayner M, et al. Increased energy intake entirely accounts for increase in body weight in women but not in men in the UK between 1986 and 2000. Br J Nutr. 2011. May;105(9):1399–404. 10.1017/S0007114510005076 [DOI] [PubMed] [Google Scholar]
- 12.Hall KD, Guo J, Dore M, Chow CC. The progressive increase of food waste in America and its environmental impact. PLoS ONE. 2009;4(11):e7940. 10.1371/journal.pone.0007940 [DOI] [PMC free article] [PubMed] [Google Scholar]
- 13.FAOSTAT [Internet]. Rome: Statistics Division, Food and Agriculture Organisation of the United Nations; 2012. Available from: http://faostat3.fao.org/home/index.html#DOWNLOAD [cited 2013 Feb 16].
- 14.WHO global infobase [Internet]. Geneva: World Health Organization; 2011. Available from: https://apps.who.int/infobase/ [cited 2015 Feb 18].
- 15.Global database on body mass index [Internet]. Geneva: World Health Organization; 2010. Available from: http://www.who.int/nutrition/databases/bmi/en/ [cited 2015 Feb 18].
- 16.Global prevalence of adult overweight and obesity by region. London International Association for the Study of Obesity; 2013. Available from: http://www.worldobesity.org/aboutobesity/resources/obesity-data-portal/ [cited 2015 Mar 16].
- 17.OECD health data [Internet]. Paris: Organisation for Economic Co-operation and Development; 2012. Available from: http://www.oecd.org/els/health-systems/health-data.htm [cited 2013 Feb 13].
- 18.Tunstall-Pedoe H, editor. MONICA monograph and multimedia sourcebook: World’s largest study on heart disease, stroke, risk factors, and population trends 1979-2002. Geneva: World Health Organization; 2003. [Google Scholar]
- 19.STEPS country reports [Internet]. Geneva: World Health Organization; 2013. Available from: http://www.who.int/chp/steps/reports/en/index.html [cited 2013 Feb 13].
- 20.The DHS Program Demographic and Health Surveys. Publications by country [Internet]. Rockville: ICF International; 2013. Available from: http://dhsprogram.com/Publications/Publications-by-Country.cfm [cited 2015 April 13].
- 21.World Population prospects: the 2012 revision [Internet]. New York: United Nations Department of Economic and Social Affairs; 2012. Available from: http://esa.un.org/unpd/wpp/Excel-Data/population.htm [cited 2014 Feb 15].
- 22.Institute of Medicine of the National Academies. Dietary reference intakes for energy, carbohydrate, fiber, fat, fatty acids, cholesterol, protein and amino acids. Washington: The National Academies Press; 2005. [Google Scholar]
- 23.Dwyer-Lindgren L, Freedman G, Engell RE, Fleming TD, Lim SS, Murray CJ, et al. Prevalence of physical activity and obesity in US counties, 2001–2011: a road map for action. Popul Health Metr. 2013;11(1):7. 10.1186/1478-7954-11-7 [DOI] [PMC free article] [PubMed] [Google Scholar]
- 24.Bell AC, Ge K, Popkin BM. The road to obesity or the path to prevention: motorized transportation and obesity in China. Obes Res. 2002. April;10(4):277–83. 10.1038/oby.2002.38 [DOI] [PubMed] [Google Scholar]
- 25.Ng SW, Norton EC, Guilkey DK, Popkin B. Estimation of a dynamic model of weight. [Working paper 15864]. Cambridge: National Bureau of Economic Research; 2010. 10.3386/w15864 [DOI] [Google Scholar]
- 26.McAllister EJ, Dhurandhar NV, Keith SW, Aronne LJ, Barger J, Baskin M, et al. Ten putative contributors to the obesity epidemic. Crit Rev Food Sci Nutr. 2009. November;49(10):868–913. 10.1080/10408390903372599 [DOI] [PMC free article] [PubMed] [Google Scholar]
- 27.Swinburn BA, Sacks G, Lo SK, Westerterp KR, Rush EC, Rosenbaum M, et al. Estimating the changes in energy flux that characterize the rise in obesity prevalence. Am J Clin Nutr. 2009. June;89(6):1723–8. 10.3945/ajcn.2008.27061 [DOI] [PMC free article] [PubMed] [Google Scholar]
- 28.Hawley KL, Roberto CA, Bragg MA, Liu PJ, Schwartz MB, Brownell KD. The science on front-of-package food labels. Public Health Nutr. 2013. March;16(3):430–9. 10.1017/S1368980012000754 [DOI] [PMC free article] [PubMed] [Google Scholar]
- 29.Eyles H, Ni Mhurchu C, Nghiem N, Blakely T. Food pricing strategies, population diets, and non-communicable disease: a systematic review of simulation studies. PLoS Med. 2012;9(12):e1001353. 10.1371/journal.pmed.1001353 [DOI] [PMC free article] [PubMed] [Google Scholar]
- 30.Taber DR, Chriqui JF, Powell L, Chaloupka FJ. Association between state laws governing school meal nutrition content and student weight status: implications for new USDA school meal standards. JAMA Pediatr. 2013. June;167(6):513–9. 10.1001/jamapediatrics.2013.399 [DOI] [PMC free article] [PubMed] [Google Scholar]
- 31.Friel S, Gleeson D, Thow AM, Labonte R, Stuckler D, Kay A, et al. A new generation of trade policy: potential risks to diet-related health from the trans pacific partnership agreement. Global Health. 2013;9(1):46. 10.1186/1744-8603-9-46 [DOI] [PMC free article] [PubMed] [Google Scholar]
- 32.Franck C, Grandi SM, Eisenberg MJ. Agricultural subsidies and the American obesity epidemic. Am J Prev Med. 2013. September;45(3):327–33. 10.1016/j.amepre.2013.04.010 [DOI] [PubMed] [Google Scholar]
- 33.Popkin BM, Adair LS, Ng SW. Global nutrition transition and the pandemic of obesity in developing countries. Nutr Rev. 2012. January;70(1):3–21. 10.1111/j.1753-4887.2011.00456.x [DOI] [PMC free article] [PubMed] [Google Scholar]
- 34.Baker P, Friel S. Processed foods and the nutrition transition: evidence from Asia. Obes Rev. 2014. July;15(7):564–77. 10.1111/obr.12174 [DOI] [PubMed] [Google Scholar]
- 35.Koch TG, Wilson N. Decomposing the American obesity epidemic [Working Paper No. 318]. Washington: Federal Trade Commission Bureau of Economics; 2013. Available from: http://papers.ssrn.com/sol3/papers.cfm?abstract_id=2266019 [cited 2015 Feb 10]. [Google Scholar]