

Abstract
Upon stimulation, dendritic cells (DCs) mature and migrate to draining lymph nodes to induce immune responses1. As such, autologous DCs generated ex vivo have been pulsed with tumor antigens and injected back into patients as immunotherapy. While DC vaccines have shown limited promise in the treatment of patients with advanced cancers2–4 including glioblastoma (GBM),5–7 the factors dictating DC vaccine efficacy remain poorly understood. Here we demonstrate that pre-conditioning the vaccine site with a potent recall antigen such as tetanus/diphtheria (Td) toxoid can significantly improve the lymph node homing and efficacy of tumor antigen-specific DCs. To assess the impact of vaccine site pre-conditioning in humans, we randomized patients with GBM to pre-conditioning with mature DCs8 or Td unilaterally before bilateral vaccination with Cytomegalovirus pp65 RNA-pulsed DCs. We and other laboratories have shown that pp65 is expressed in > 90% of GBM specimens but not surrounding normal brain9–12, providing an unparalleled opportunity to subvert this viral protein as a tumor-specific target. Patients given Td had enhanced DC migration bilaterally and significantly improved survival. In mice, Td pre-conditioning also enhanced bilateral DC migration and suppressed tumor growth in a manner dependent on the chemokine CCL3. Our clinical studies and corroborating investigations in mice suggest that pre-conditioning with a potent recall antigen may represent a viable strategy to improve antitumor immunotherapy.
To evaluate the influence of vaccine site pre-conditioning on DC migration clinically, we conducted a randomized and blinded clinical trial in newly-diagnosed GBM (Extended Data Fig. 1). Thirteen patients consented to this trial but only 12 were randomized as one progressed prior to randomization (Extended Data Table 1). Patients were randomized to unilateral vaccine site pre-conditioning with unpulsed, autologous DCs8 or Td, based upon our hypothesis that it would induce inflammation at the vaccine site13. The accumulation of injected DCs in vaccine site-draining lymph nodes (VDLNs) was significantly greater in patients given Td (Fig. 1a). Moreover, Td-treated patients also showed a significant increase in both PFS (Fig. 1b) and OS (Fig. 1c) compared to DC-treated patients. From the time of diagnosis, patients in the DC cohort had a median PFS of 10.8 months and a median OS of 18.5 months. Thus, the median PFS and OS for the DC cohort were consistent with patients treated with the standard of care14. Three censored patients from the Td cohort did not progress and were alive at the time of survival analysis (> 36.6 months). Overall, these prognostic factors varied across both treatment groups as expected in a small clinical trial. However, there was no discernible trend across prognostic factors that would suggest these factors alone account for the observed differences in survival between cohorts. Using the both Curran et al. recursive partition analysis15 and the European Organization for Research and Treatment of Cancer (EORTC) nomogram16 for predicting outcome of patients with GBM, Td-treated patients exceeded expected survival times by a far greater degree than did DC-treated patients in both cases by nearly the same amount (Extended Data Table 1). The vaccine responses in long-term survivors varied in durability, but pp65-specific immune responses were detectable for several months in all long-term survivors. An increase in pp65-specific interferon-γ spot-forming units (SFUs) from baseline did correlate with overall survival and the two long-term survivors for which samples were available had the highest increases in pp65-specific immune responses after vaccination. In addition, we observed a striking association between DC migration to the VDLNs and PFS and OS (Fig. 1d) in patients with GBM receiving pp65 RNA-pulsed DC vaccines.
Figure 1. Td pre-conditioning increases DC migration to VDLNs and is associated with improved clinical outcomes.
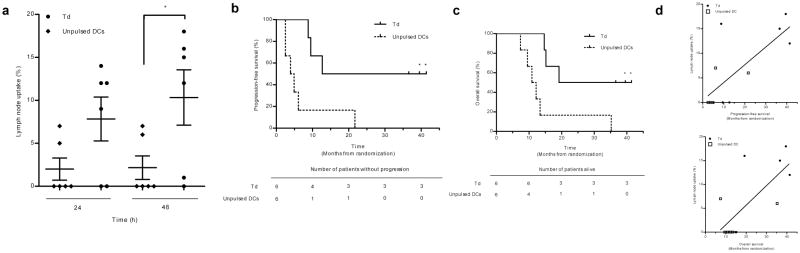
a, DC migration in Td (n = 6) vs. unpulsed DC patients (n = 6) (two sample t test, P = 0.049). Mean ± s.e.m., n values represent biological replicates of patient bilateral inguinal lymph nodes (iLNs). b, Patient PFS and c, OS (Logrank test, P = 0.013). d, Hazard ratios (HRs): DC migration efficiency from Td and DC cohorts showing the effect of a 1 unit increase in percent migration on PFS (top) and OS (bottom) (Cox proportional hazards model, PFS HR = 0.845 P = 0.027; OS HR = 0.820 P = 0.023). b and c, n = 3 censored Td patients (no progressive disease at survival analysis).
To validate these clinical results and understand the mechanistic underpinnings, we performed analogous studies in a mouse model. Vaccine sites of Td-immune mice were preconditioned with Td and then received a bilateral vaccine of ovalbumin (OVA) RNA-pulsed DCs. In a striking parallel to our clinical findings, Td-immune mice receiving Td preconditioning had a three-fold increase in DCs within the afferent inguinal lymph nodes (Fig. 2a). This effect was attributable to Td-specific recall responses as mice not primed with Td (Td-naïve mice) did not display any increased DC migration to VDLNs (Fig. 2b). Vaccination and preconditioning with other CD4-dependent protein antigens also increased DC migration suggesting this may be a generalizable phenomenon (Extended Data Fig. 2). Subsequent studies performed in Td-treated mice demonstrated that only selective depletion of CD4+ T cells abrogated the increase in DC migration (Fig. 2c). The effect of enhanced migration was also transferable to naïve mice administered Td-activated CD4+ T cells (Fig. 2d).
Figure 2. Td recall response activates CD4+ T cells to increase DC migration to VDLNs.

a, Control inguinal (n = 5 mice) vs. Td inguinal (n = 5 mice, two sample t test, P = 0.0001; Td popliteal (n = 5 mice) vs. Td inguinal, paired t test, P = 0.014. b, Mice primed and boosted with saline (Primary Td, n = 6) or Td (Control and Recall Td, n = 6) with Td (Primary and Recall Td) or saline (Control) pre-conditioning; one-way ANOVA, P = 0.004; post-hoc Tukey t test, Control vs. Recall Td, P = 0.006; Primary Td vs. Recall Td, P = 0.011. c, DC migration in depleted Td-immunized mice (n = 5); one-way ANOVA, P < 0.0001; post-hoc Tukey t test, Td vs. CD4, P = 0.005; Td vs. CD8, CD19, or NK1.1, P > 0.05). d, DC migration following CD4+ transfer (n = 4 mice); one-way ANOVA, P < 0.0001; post-hoc Tukey t test, CD4Act vs. CD4Naive, P < 0.05; Control vs. CD4, P > 0.05; Td vs. CD4, P > 0.05. e, Patient iLN ipsilateral (n = Naive Act 6) and contralateral (n = 6) to pre-conditioning (paired t test, P = 0.28). f, Mouse (paired t test, P = 0.37; n = 6 LN per group,). a–d, f, Representative of 4 experiments; mean ± s.e.m. a–d, biological replicates of individual right and left iLN or LN ipsilateral to Td/saline for popliteal and GFP− groups.
In patients with GBM randomized to unilateral Td pre-conditioning (Fig. 2e) and in mice (Fig. 2f), we observed an increased uptake of 111In-labeled DCs in bilateral lymph nodes, suggesting that Td pre-conditioning increased DC migration through systemic mediators. Subsequent experiments revealed that Td-activated CD4+ T cells administered systemically in naïve mice were also sufficient to increase bilateral DC migration (Extended Data Fig. 3). Vaccine site pre-conditioning with unpulsed DCs or TNF-α8 only increased DC migration ipsilaterally (Extended Data Fig. 4a and 4b).
Based on our observations that Td recall responses could induce bilateral DC migration and that systemic administration of Td-activated CD4+ T cells were sufficient to recapitulate the increased DC migration, we sought to examine the induction of CD4-dependent inflammatory mediators in the serum of patients and mice following a recall response with Td preconditioning. CCL3 was the only chemokine or cytokine to be elevated in both patients and mice and had the greatest fold elevation of all chemokines in the serum of both following Td preconditioning (Fig. 3a, Extended Data Fig. 5a–d).
Figure 3. Td recall responses and induced CCL3 cooperate to facilitate DC migration to VDLNs.

a, Serum CCL3 fold increase over non-Td cohorts (patient, n = 6; mouse, n = 8 biological replicates); signed rank test, P = 0.031 and P = 0.039. b, Left: DC migration in WT (n = 5) vs. Ccl3−/− mice (n = 4), two sample t test, P = 0.023). Right: Td-activated CD4+ transfer in Ccl3−/− hosts (n = 4 mice); two sample t test, P = 0.029. c, CCL3 and Td recall responses rescue migration (n = 4 mice); one-way ANOVA, P < 0.0001; post-hoc Tukey t test, Ccl3−/− Td + Td i.d. + CCL3 i.v. vs. Ccl3−/− Td + Td i.d. and vs. Ccl3−/− + CCL3 i.v., P = 0.007 and P = 0.001, respectively. b, c, biological replicates of individual right and left iLNs. Representative of 3 experiments; mean ± s.e.m.; intradermal (i.d.); intramuscular (i.m.); intravenous (i.v.).
To identify the site of the CCL3 production, we assayed the pre-conditioning sites in mice and found high concentrations of this chemokine only unilaterally at the site of Td preconditioning (Extended Data Fig. 6a). Subsequent experiments showed that CCL3 upregulation in the skin was dependent on the induction of the Td recall response (Extended Data Fig. 6b) and was significantly reduced by CD4+ T cell depletion (Extended Data Fig. 6c). Induction of CCL3 by Td pre-conditioning remained elevated over time compared to mice lacking Td recall responses (Extended Data Fig. 6d).
To evaluate the importance of CCL3 in mediating DC trafficking to VDLNs in vivo, we immunized and boosted Ccl3−/− mice with Td as described above and found that the migration of injected DCs to VDLNs in Ccl3−/− mice was significantly lower than in wild-type Td preconditioned mice (Fig. 3b, top). Endogenous migration experiments revealed that resident Langerhans cells also did not migrate as efficiently in Ccl3−/− hosts following Td pre-conditioning (Extended Data Fig. 7). To address the possibility that Td priming may have failed in Ccl3−/− mice due to some earlier role of CCL3, we compared the CD4 T-dependent immune responses to Td in both wild-type and Ccl3−/− hosts and found no differences in the ability of these two strains to mount anti-tetanus immune responses following Td priming and boosting (Extended Data Fig. 8).
Our studies demonstrated that CD4+ T cells activated by the Td recall response were sufficient to induce increased DC migration in naïve mice (Fig. 2d). However, Td-activated CD4+ T cells could not rescue the limited DC migration in Ccl3−/− hosts indicating that activated T cells were necessary, but not sufficient to increase DC migration (Fig. 3b, bottom). Exogenous administration of CCL3 could rescue the limited DC migration in Ccl3−/− mice, but only when the Td recall responses were induced (Fig. 3c), indicating that the ability of Td pre-conditioning to increase DC migration to VDLNs was dependent on both CD4+ recall responses and host-derived CCL3.
Alterations in CCL21 expression along the lymphatic endothelium in the skin take place in the context of inflammation and have been associated with increased DC migration8. Following Td pre-conditioning, higher levels of CCL21 in harvested skin sites were detected in Td-treated wild-type mice compared to Ccl3−/− mice, and exogenous administration of CCL3 rescued the diminished levels of CCL21 at the vaccine sites of Ccl3−/− mice only in the context of Td recall responses (Extended Data Fig. 9a), which paralleled the requirement of host CCL3 and Td recall responses for increased DC migration. Furthermore, Td pre-conditioning resulted in an increase in CCL21 within inguinal lymph nodes both ipsilateral and contralateral to the side of Td preconditioning (Extended Data Fig. 9b). Although lymph nodes contain high basal amounts of CCL21, we found CCL21 levels in bilateral inguinal lymph nodes of Td-treated Ccl3−/− mice to be lower than that of wild-type mice. Meanwhile, reconstitution of CCL3 back into Ccl3−/− mice in conjunction with the induction of Td recall responses significantly increased the expression of CCL21 in VDLNs (Extended Data Fig. 9c).
The apparent increase in PFS and OS for Td treated-patients prompted us to determine if Td pre-conditioning could inhibit tumor growth in a murine model of established B16/F10-OVA tumors. Pairwise comparisons revealed that tumor growth in Td + OVA-DC mice was significantly delayed (Fig. 4a) in an antigen-dependent manner (Fig 4b). Td pre-conditioning in Ccl3−/− mice, as expected, was unable to inhibit tumor growth (Fig. 4c). Similarly, plt (paucity of lymph node T cell) mice that lack expression of CCL21 in the lymph nodes17, also failed to suppress tumor growth (Fig. 4d), indicating that Td-enhancement of OVA-DC vaccines also required intact CCL21 expression in the host.
Figure 4. Td pre-conditioning improves responses in tumor-bearing mice.

a, Insert: Transformed growth curves, mixed linear effects model. Pairwise comparisons of regression line slopes (F-test, P < 0.0001). Day 22 volume (Td + OVA-DC vs. Td + GFP-DC, two sample t test, P = 0.002; n = 7). b, Antigen-specific responses with Td pre-conditioning. Day 15 volume (all groups, F-test, P = 0.016; pairwise Tukey t tests, Td + OVA-DC + B16-OVA (n = 7) vs. Td + OVA-DC + B16 (n = 5), P = 0.0004; Td + OVA-DC + B16-OVA vs. Saline + OVA-DC + B16-OVA (n = 6), P = 0.0002). Day 22 volume (Td + OVA-DC + B16-OVA vs. Td + OVA-DC + B16, two sample t test, P < 0.0001). c, Tumor growth in Ccl3−/− mice. Day 11 volume (all groups, F-test, P = 0.005). Day 27 volume (Td + OVA-DC WT vs. Td + OVA-DC Ccl3−/−, two sample t test, P = 0.042; n = 8). d, Antitumor responses in plt mice. Day 16 volume (all groups, F-test, P = 0.004). Day 24 volume (Td + OVA-DC plt (n = 7) vs. Td + OVA-DC WT (n = 6), two sample t test, P < 0.05). a–d, Representative of 3 experiments; mean ± s.e.m; autologous lymphocyte transfer (ALT).
Results from our trial appear to demonstrate that the modulation of CMV-specific DCs with Td pre-conditioning increases their migratory capacity and may improve clinical outcomes in patients with GBM. Corroborating studies in mice support these claims and underline CCL3 as a novel and important mediator of increased DC migration to VDLNs, in addition to its described roles in DC precursor mobilization to peripheral sites of inflammation18,19 and in guiding naïve CD8+ localization to sites of DC-CD4+ interactions in lymph nodes20. Our preclinical findings suggest that increased DC migration was only observed in the context of host CCL3 and Td recall responses. Similarly, we observed a slight increase in CCL21 skin and bilateral VDLN levels in the context of both host CCL3 and Td recall, which may play a role in DC homing to local lymph nodes. However, due to the already high basal amount of CCL21 chemokine in draining lymph nodes, it is possible that additional factors such as interactions between host CCL3 and CD4+ recall T cells are the predominant contributors to the increased DC accumulation in VDLNs. Our findings also suggest that DC migration should be further investigated as a predictive biomarker for immunotherapy studies.
Methods
Patient selection, demographics and clinical protocol
The clinical protocol and informed consent were approved by the U.S. Food and Drug Administration and Institutional Review Board at Duke University. Adults with a newly-diagnosed WHO Grade IV GBM, who had a gross total resection and residual radiographic contrast enhancement on post-resection magnetic resonance imaging (MRI) not exceeding 1 cm in diameter in two perpendicular axial planes, and a Karnofsky Performance Scale score of ≥ 80, were eligible for the clinical study (FDA - IND-BB-12839, Duke IRB Pro00003877, NCT00639639). Histopathology of all specimens was initially read as GBM, but this diagnosis was re-confirmed by a second board-certified neuro-pathologist. Histologic diagnosis included immunohistochemistry for MGMT protein expression. Benign endothelial cells staining positive for MGMT served as the internal control21. MGMT promoter methylation was performed by PCR. Based on published reports showing high expression of CMV viral proteins in > 90% of GBM tumors9–12, we elected not to include pp65 staining of tumor tissue as an eligibility criterion for this trial. All 13 patients on study received a gross total resection defined as > 90% with residual contrast enhancement of <1 cm2, and steroid doses could not exceed 2 mg/day of dexamethasone. No patients received intensity-modulated radiation therapy (IMRT) or had 5-aminolevulinic acid (5-ALA) dye used during resection. Thereafter, all patients completed a six week course of conformal external beam radiotherapy (XRT) to a dose of 60 Gray (Gy) with concurrent temozolomide (TMZ) at a targeted daily dose of 75 mg/m2/d. Upon completion of standard therapy, all patients underwent an MRI for evidence of progressive disease. Those with evidence of progressive disease or required steroid therapy in excess of physiological levels at the time of vaccination were replaced. A total of 13 patients were enrolled and randomized prior to the first cycle of standard-of-care 5-day TMZ (200 mg/m2/day), but one progressed before randomization. For each vaccine 2 × 10⁷ mature pp65 RNA-pulsed DCs in 0.4 mL of saline were given intradermally in the groin. The first vaccination occurred on day 21 ± 2 of TMZ cycle 1. Although some patients (n=5) were also randomized to receive an autologous lymphocyte transfer, those patients did not show a significant improvement in progression-free survival or overall survival. Patients given autologous lymphocytes were additionally administered 3 × 10⁷ cells/kg intravenously with acetaminophen (650 mg per os (po)) and Benadryl (25–50 mg po) given 30–60 minutes before infusion. The first three DC vaccines were given biweekly, and, at vaccine 4, patients were randomized to Td or unpulsed autologous DCs and received 111In-labeled DCs for migration studies. Vaccine 4 and additional monthly vaccines until tumor progression occurred on day 21±2 of successive TMZ cycles. A minimum of six cycles of adjuvant TMZ were required as per standard-of-care and continuation was at the discretion of the treating neuro-oncologist. Patients were monitored for treatment-related toxicity, and none of the patients experienced any vaccine or Td-related adverse events.
Human autologous DC generation for vaccination and production of pp65-LAMP/A64 mRNA
DCs were generated using the method of Romani et al.22,23, and after harvest the cells were frozen and assessed for contamination and lineage purity as previously published24. The 1.932 kB pp65 full-length cDNA insert was obtained from Dr. Bill Britt (University of Alabama-Birmingham, Birmingham, Alabama) and RNA was generated and transfected as previously reported23.
Human DC migration studies
DC migration studies were done at the fourth vaccination. Patients were randomized by side to have one inguinal vaccination site pre-treated with either 1 × 10⁶ unpulsed DCs or Td toxoid (1 flocculation unit (Lf)). Saline was administered on the contralateral side. Vaccination site pretreatment was done 6 to 24 hours before DC vaccination. DCs were labeled with 10 μCi / 1 × 10⁷ DC with 111In (GE Healthcare, Arlington Heights, IL) and divided equally in the two sites. Gamma camera images (GE Infinia Hawkeye) were taken immediately after injection and at 24 and 48 hours after injection to compare 111In-labeled DC migration from the inguinal injection sites to the inguinal lymph nodes.
Progression-free and overall survival
The more recent Response Evaluation Criteria in Solid Tumors (RECIST criteria) judge progression by measuring the longest one-dimensional diameter and determine progression by a 20% increase in this diameter25. Once progression is detected on MRI, other imaging modalities such as positron emission tomography and a stereotactic brain biopsy of the enhancing region are incorporated to aid in determining progression. A stereotactic brain biopsy or resection demonstrating recurrence defines clinical progression. Progression-free survival (PFS) was defined as the time until radiographic or clinical progression and was censored at the last follow-up if the patient remained alive without disease progression. Overall survival (OS) was defined as the time until death and was censored at the last follow-up if the patient remained alive at the time of analysis. PFS and OS for all patients were calculated from both the time of surgery and from randomization to vaccine site pre-conditioning.
Mice
All animal experiments were performed according to Duke University Institutional Animal Care and Use Committee-approved protocols. Female C57BL/6 wild-type, OT-I transgenic mice, Ccl3−/−, and RFP and GFP transgenic mice (ubiquitin promoter) were obtained from the Jackson Laboratory and were bred under pathogen-free conditions at Duke University Medical Center. The plt strain was provided by M.D.G. and maintained at Duke University Medical Center. All mice were bred under pathogen-free conditions at Duke University Medical Center.
Generation of murine bone marrow-derived DCs, electroporation, and phenotyping
Bone marrow-derived DCs were generated from 6–8 week old female C57BL/6 wild-type, RFP+, or GFP+ transgenic mice and pulsed with OVA RNA as previously described23. For phenotyping, anti-mouse PE-conjugated CD11c (HL3), CD80 (16-10A1), CD86 (GL1), Ly-6G (1A8), MHC class II (I-Ab; AF6-120.1) and isotype controls (IgG1; G235-2356, IgG2a,κ; R35-95) were from BD Pharmingen. Cells were washed, resuspended in PBS and 2% FBS, incubated at 4°C for 30 minutes, and washed again before use.
Vaccine site pre-conditioning and DC vaccination in mice
For Td immunization, female 6–8 week old C57BL/6 mice received a primary i.m. vaccine of Td toxoid (Sanofi Aventis; Decavac®; 1Lf, 100 μL) administered bilaterally into the quadriceps muscle (50 uL per leg). An i.m. booster (0.5 Lf, 50 μL) was administered two weeks later. Vaccine site pre-conditioning with saline or Td toxoid (0.5 Lf) was given i.d. two weeks after the booster and randomized to the right or left groin site. Mouse IgG antibody responses to Td were measured by ELISA (Xpress Bio). Serum from immunized mice was harvested two weeks following each immunization prior to the next booster vaccine. DCs were resuspended at 1 × 10⁶/100 μL PBS (Gibco) and administered i.d. on both sides 0.8 cm from the groin crease 24 hours after i.d. pre-conditioning. DCs injected in the groin ipsilateral to the Td pre-conditioning side were directly injected i.d. within the erythematous nodule produced by Td pre-conditioning. For recall response experiments using other protein antigen formulations, female 6–8 week old C57BL/6 mice received a primary i.m. vaccine of Prevnar 13® (Pfizer, Pneumococcal 13-valent conjugate vaccine, 1.32 μg, 100 μL) and Pedvax HIB® (Merck, Haemophilus b conjugate vaccine, 1.5 μg, 100 μL) administered bilaterally into the quadriceps muscle (50 μL per leg). Vaccine site pre-conditioning with saline or the protein antigen (50 μL) was given i.d. two weeks later and randomized to the right or left groin site. DC vaccines were given 24 hours later, and migration to lymph nodes was assessed 48 hours later. As with Td pre-conditioning, DCs injected in the groin ipsilateral to the pre-conditioning side were directly injected i.d. within the erythematous nodule produced by those formulations. For comparisons of other pre-conditioning agents, female 6–8 week old C57BL/6 mice received a unilateral dose of unpulsed, mature DCs (1 × 10⁶ in 50 μL) or TNF-α (30 ng) administered i.d. at the groin site 24 hours prior to DC vaccination. Based on the previous work using these pre-conditioning regimens, DC migration to bilateral inguinal lymph nodes was assessed 24 hours later. For all other migration experiments, popliteal and inguinal LNs were harvested 48 hours post-DC vaccination and digested for flow cytometry. The percent of migrating DCs was enumerated by gating on fluorescent DCs in wild-type VDLNs. DCs from wild-type (GFP− and RFP−) mice as negative controls before gating on fluorescent DCs within VDLNs to account for background autofluorescent cells that may have appeared in the GFP channel. For in vivo DC migration, a sample size (three per group) was based on empirical evidence from previously published reports as the size necessary for adequate statistical analysis of lymph nodes sampled26.
Depletion, adoptive transfer, and CCL3 reconstitution
Female 6–8 week old C57BL/6 mice were initially depleted of cellular subsets once daily (200 μg/mouse intraperitoneally) for three days prior to the first Td i.m. immunization. Anti-mouse CD4 (GK1.5) and anti-CD8 (2.43) antibodies were purchased from American Type Culture Collection (ATCC, Manassas, VA). Anti-mouse NK1.1 (PK136) and anti-CD19 (2D5) and control isotype depleting antibodies (IgG2a (2A3) and IgG2b (LTF-2)) were from BioXCell. Maintenance doses of depletion antibodies were administered at three-day intervals (200 μg intraperitoneally) until vaccine site pre-conditioning with Td two weeks later. For adoptive transfer experiments, Td-activated CD4+ T cells (CD4Act) were induced in donor female 6–8 week old C57BL/6 mice. Mice were primed (1Lf, 100 μL) and boosted (0.5Lf, 50 μL) i.m. with Td two weeks apart. Three days after the i.d. Td pre-conditioning, donor inguinal lymph nodes, skin injection sites, and spleens were harvested and processed for negative isolation of CD4+ T cells (Miltenyi Biotec). Complementary sites from naïve mice were harvested simultaneously and processed for negative isolation of CD4+ T cells (CD4Naive). A final dose of 6 × 10⁶ CD4+ T cells were administered intravenously into recipient mice two days before i.d. vaccination with RFP+ DCs. For CCL3 reconstitution in Ccl3−/− hosts, recombinant mouse CCL3 (R&D Systems) was administered intravenously into the tail vein (10 μg/mouse) 12 hours prior to vaccination with RFP+ DCs. Ccl3−/− mice that were Td-immune were given recombinant CCL3 12 hours following Td pre-conditioning at the vaccine site.
Tumor implantation experiments
For tumor implantation experiments, B16/F10-OVA cells were grown as previously published27 and injected subcutaneously at a concentration of 2× 10⁵ cells in 200 μL of PBS in the flank of C57BL/6 mice 8 days before vaccine site preconditioning, the first intradermal vaccine of OVA RNA-pulsed DCs, and autologous lymphocyte transfer (1:1 infusion of naïve: OT-I OVA-specific T cells). Randomization of mice occurred after tumor inoculation prior to vaccine site pre-conditioning and the first DC vaccine first by compilation and then by random sorting into various treatment cages. Mice received two additional weekly vaccines of RNA-pulsed DCs on days 15 and 22. Ten days after tumor implantation, flank sites were monitored daily for tumor growth, and tumor size was measured every two days. Tumor volume (millimeters cubed) was calculated by the formula (length × width2 × 0.52) in a perpendicular fashion. Mice were sacrificed when ulceration occurred or when the tumor reached either 2 cm in any direction or 2000 mm3. Analysis of tumor growth focused on follow-up assessments before significant dropout occurred. A logarithmic transformation yielded a linear relationship between tumor volume and time for all curves. A mixed effects linear model that accounted for correlation of measurements within a mouse was used to examine the relationship between time and log [tumor volume + 1]. No blinding was done for these animal studies.
Mouse tumor cell lines
The B16/F10-OVA tumor cell line was a kind gift from R. Vile, PhD (Mayo Clinic)27,28. The B16/F10 cell line was provided by I. Fidler, PhD (M. D. Anderson Cancer Center, Houston, TX)29. Cell lines were tested for mycoplasma before use.
Murine lymph node digestion and quantification of fluorescent and endogenous DCs
Harvested LNs were placed in 6-well culture plates containing 1 mL HBSS with Ca2+/Mg2+ (Gibco), digested for 35 min at 37°C with collagenase A (1 mg/mL; Roche) and DNaseI (0.2 mg/mL; Sigma-Aldrich) and 20 mM EDTA (Invitrogen) was added for 5 minutes at room temperature to stop the reaction26. Single cell suspensions were prepared, cells were centrifuged (500 × g × 5 min) and resuspended in PBS with 2% FBS and stained with murine APC-conjugated CD11c (BD Pharmingen; HL3). For quantification of RFP+ or GFP+ counts in individual lymph nodes, samples were resuspended at an equal volume and 50 μL of counting beads (Invitrogen; 50,000 beads) were added to each sample. Cells were gated first on murine CD11c+ cells and then RFP+ or GFP+ cells, and absolute cell counts/ lymph node were quantified using the following equation: RFP+ or GFP+ events × 50,000 beads/ # bead events. For endogenous DC migration experiments, cells were surface-stained in PBS with 3% FBS, 10mM EDTA, 5% normal mouse serum, 5% normal rat serum and 1% Fc Block (eBioscience; clone 93) and then intracellularly stained with anti-CD207 according to the manufacture’s protocol (BD Cytofix/Cytoperm™ Kit). The cells were analyzed by BD LSRII flow cytometer with FlowJo software (Tree Star). FITC-conjugated anti-B220 (RA-3-6B2), Alexa Fluor® 700-conjugated anti-Ly-6G (1A8), APC-Cy7-conjugated anti-CD11b (M1/70), V450-conjugated anti-Ly-6C (AL-21) are from BD Pharmingen. PE-conjugated anti-CD207 (eBioL31), PE-Cy5.5-conjugated anti-CD11c (N418), PE-Cy7-conjugated anti-CD8 (53.6.7), APC-conjugated anti-CD103 (2E7), eFluor® 605NC-conjugated anti-CD45 (30-F11) and eFluor® 650NC-conjugated anti-MHC Class II (I-A/I-E) (M5/114.15.2) are from eBioscience. FITC-conjugated anti-CD3 (145-2C11) and anti-CD49b (DX5) are from BioLegend. LIVE/DEAD® Fixable Aqua Dead Cell Stain Kit is from Molecular Probes.
Serum cytokine and chemokine analysis
Peripheral blood was collected 24 hours after vaccine site pre-conditioning prior to DC vaccination. For patients, blood was collected in 10 mL venous collection tubes (BD), allowed to clot, spun at 1,170 × g for 15 minutes, and serum was stored at −190°C. For mice, blood was collected in microtainer tubes (BD) allowed to clot for 30 min, spun at 8,000 × g for 5 min, and serum was stored at −80°C. Multiplex cytokine and chemokine kits were used for patient and mouse studies (cytokines and chemokines of interest for human, Affymetrix and Millipore: EPX080-10007-901, EPX010-12121-901, EPX010-12125-9, EPX010-10287-901, HCYTOMAG-60K-01 MDC; for mouse: Affymetrix and Millipore: EPX090-20821-901 ProcartaPlex 9 plex, MCYP3MAG-74K-01 MDC) following the manufacturer’s instructions.
Expression of chemokines CCL3 and CCL21 in mice
Female 6–8 week old C57BL/6 or Ccl3−/− mice were immunized with Td as described above. Twenty-four hours following Td pre-conditioning, both left and right skin sites and inguinal lymph nodes were harvested. For protein isolation, skin and lymph node samples were placed in pre-loaded bead lysis Eppendorf tubes (Next Advance) containing RIPA buffer (Sigma) with protease inhibitor cocktail tablets (Mini Complete Protease Inhibitor Cocktail Tablets, Roche Applied Science). Homogenization was performed with the Bullet Blender at 4°C. Supernatants were collected by centrifugation, and chemokines were quantified by ELISA. Quantikine kits (R&D Systems) were used for CCL3, and RayBiotech ELISA kits were used for CCL21. Corresponding samples were run for total protein concentration using the Bradford assay. CCL3 and CCL21 concentrations were normalized across samples and expressed as pg per mg or ng per mg of total skin or lymph node protein.
Statistical analysis
Statistics were reviewed by biostatisticians and tested as described in figure legends. Cox proportional hazard models were used to evaluate DC migration and clinical outcomes. The Logrank test was used to compare Kaplan-Meier survival curves with censored patient data. For in vivo DC migration and VDLN studies, individual patient and mouse inguinal lymph nodes were treated as separate biological replicates, based on the underlying assumption that unilateral vaccine site pre-conditioning may preferentially affect local draining lymph nodes over non-draining sites. An unpaired two-sample student’s t test was used for two-group comparisons. Paired t tests were used for comparisons between lymph nodes in the same host. One-way ANOVA was used to assess differences among three or more groups with post-hoc Tukey t tests for two-group comparisons. Wilcoxon rank sum analyses were conducted for pairwise comparisons in serum cytokine/chemokine panels. Signed rank tests were used to evaluate fold increase in chemokine levels. For tumor growth curves, a mixed effects linear model was employed utilizing log-transformed curves and F-test for pairwise comparisons of regression line slopes and mean tumor volumes on the first day of detectable tumors (y-intercept). Repeated measures for calculation of slopes incorporated time between detectable tumor until significant dropout occurred (maximal tumor size, ulceration, or death). Mean tumor volumes at final time points when entire control cohort expired were compared between two groups using an unpaired two-sample student’s t test. Asterisks indicate level of significance (*P < 0.05, **P ≤ 0.01, ***P < 0.001, P > 0.05 not significant (N.S.)).
Extended Data
Extended Data Figure 1.

Schema of clinical trial.
Extended Data Figure 2. Recall responses induced by other CD4+ T cell-dependent protein antigens increase DC migration to VDLNs.

Primary immunization and vaccine site preconditioning with CD4+ T cell-dependent protein antigens increase DC migration to VDLNs. Mice were immunized with either Haemophilus b conjugate (Hib) or pneumococcal 13-valent conjugate (PCV) intramuscularly and two weeks later received vaccine site pre-conditioning with the recall antigen (Recall) or saline (Control). A separate cohort of mice received saline only throughout the immunization schedule (Saline). Scatter plot shows biological replicates of individually processed right and left iLN per mouse (4 mice per group). Percent migration of RFP+ DCs to VDLNs (one-way ANOVA, P < 0.0001; post-hoc Tukey t test, PCV Control vs. Recall, P < 0.05, Hib Control vs. Recall, P < 0.05,). Representative of n = 3 experiments; mean ± s.e.m.
Extended Data Figure 3. Bilateral migration of OVA-DCs following Td pre-conditioning or Td-activated CD4+ T cell transfer.

Uptake of injected DCs to right and left iLN 48 hours following DC vaccination in Td-immune mice receiving Td pre-conditioning or naïve mice administered Td-activated CD4+ T cells. Scatter plot shows biological replicates of individually processed right and left iLN per mouse (5 mice per group). CD4Act ipsilateral vs. contralateral, paired t test, P = 0.41). Representative of n = 4 experiments; mean ± s.e.m.
Extended Data Figure 4. Unilateral pre-conditioning with unpulsed DCs or TNF-α results in increased DC homing to ipsilateral draining inguinal lymph nodes.

Td-immune mice preconditioned with Td or saline prior to administration of OVA RNA-pulsed DC vaccine. Separate cohorts of naïve mice received either 1×10⁶ unpulsed DCs or 30 ng TNF-α on one side of the groin 24 hours prior to the bilateral RFP+ DC vaccine. DC migration was quantified 24 hours post-vaccination. a, DC migration to ipsilateral lymph nodes (one-way ANOVA, P = 0.0018; post-hoc Tukey t test, Saline i.d. vs. Td i.d., P = 0.007, Saline i.d. vs. TNF-α, P < 0.05, Saline i.d. vs. DCs, P < 0.05; Td i.d. vs. TNF-α, P = 0.042; DCs vs. Td i.d. and DCs vs. TNF-α, N.S.). b, DC migration to contralateral lymph nodes (one-way ANOVA, P = 0.003; post-hoc Tukey t test, Saline i.d. vs. DCs or TNF-α, P > 0.05; Td i.d. vs. TNF-α, DCs, or Saline i.d., P < 0.05). n values are biological replicates of individually processed right and left iLN per mouse (4 mice per group). Representative of n = 3 experiments; mean ± s.e.m.
Extended Data Figure 5. Serum cytokine and chemokine profile following Td preconditioning in patients and mice.

a, Serum cytokine panel of patients following vaccine site pre-conditioning with Td or unpulsed DCs (Wilcoxon rank sum, IFN-γ and IL-4, P < 0.05 (n = 6 patients). b, Similar panel in mice (Wilcoxon rank sum, all comparisons, P > 0.05; Td recall n = 5, Non-Td n = 6). c, Patient serum chemokines following vaccine site pre-conditioning. Patient CCL2 and CCL3 in Td recall (Td, n = 6) vs. Non-Td (unpulsed DC, n = 5) (one-way ANOVA and Wilcoxon rank sum, P < 0.05). d, Murine CCL22, CCL7, and CCL3 in Td recall (Td, n = 8 mice) and Non-Td (saline, n = 8 mice) (one-way ANOVA and Wilcoxon rank sum, P < 0.05). a–d, individual values represent biological replicates; mean ± s.e.m.
Extended Data Figure 6. Td vaccine site pre-conditioning results in CCL3 upregulation in Td-immune hosts.

a, CCL3 production in skin site following Td pre-conditioning (Td ipsilateral vs. contralateral. Representative of four independent experiments b, CCL3 production in skin following Td recall response. c, CCL3 induction at skin site is abrogated with prior host depletion of CD4+ T cells. a-c, Bars represent CCL3 protein detected in skin sites from n = 2 mice with n = 2 technical replicates performed per mouse. d, CCL3 remains elevated at the Td pre-conditioning site in the skin following DC vaccination (24, 48, and 72 hr, one-way ANOVA, P = 0.0001, Td + Td i.d. + OVA-DC vs. Td + saline i.d. + OVA-DC and Saline + saline i.d. + OVA-DC, P < 0.05, post-hoc Tukey t test). Individual values represent biological replicates from n = 4 mice; mean ± s.e.m.
Extended Data Figure 7. Migratory DC subsets in wild-type and Ccl3−/− mice following induction of Td recall responses.

Both wild-type and Ccl3−/− mice were first immunized with Td and then challenged with Td pre-conditioning. Migration of endogenous DC subsets to inguinal lymph nodes contralateral to the site of Td pre-conditioning was assessed at day 4 and day 8 following Td administration. a, Gating strategy used to quantify DC subsets in inguinal lymph nodes following skin pre-conditioning with Td (LC: Langerhans cells; MoDC: monocyte-derived DC). b, Day 8 migration of LC population to non-draining inguinal lymph nodes in Ccl3−/− hosts is reduced in absence of CCL3 (two-sample t test, P = 0.046). Representative of three experiments. Individual values represent biological replicates from n = 4 mice; mean ± s.e.m.
Extended Data Figure 8. Anti-tetanus toxoid memory responses are induced and maintained in wild-type and Ccl3−/− mice throughout Td priming and boosting.

WT and Ccl3−/− mice primed and boosted with Td. Serum from immunized mice was harvested two weeks following each immunization prior to the next booster vaccine (for each boosting phase, WT vs. Ccl3−/−, two-sample t test, P > 0.05); Intramuscular (i.m.). Scatter plot showing averaged values from n = 4 mice with n = 2 technical replicates performed per mouse. Representative of three experiments; mean ± s.e.m.
Extended Data Figure 9. CCL21 levels in Td pre-conditioning skin sites and draining lymph nodes of wild type and Ccl3−/− mice.

a, CCL21 levels in skin site of Ccl3−/− hosts following induction of Td recall response and CCL3 administration. Mixed model accounting for within-mouse correlation of measurements, F-test, P < 0.001; Pairwise comparisons, WT Td + Td i.d. (n = 4) vs. Ccl3−/− Td + Td i.d. (n = 3), P = 0.049; Ccl3−/− Td + Td i.d. + CCL3 i.v. (n = 4) vs. Ccl3−/− Td + Td i.d. and vs. Ccl3−/− + CCL3 i.v. (n = 4), P = 0.044 and P = 0.0045, respectively. Scatter plot shows averaged values with n = 2 technical replicates performed per mouse. b, Bilateral inguinal lymph node (iLN) CCL21 levels in WT mice following Td recall with skin site pre-conditioning. Bars represent CCL21 protein within iLN ipsilateral and contralateral to the side of Td pre-conditioning from n = 2 mice with n = 2 technical replicates performed per iLN. Representative of three experiments. c, Increased lymph node CCL21 in Ccl3−/− hosts following CCL3 reconstitution and induction of Td recall response (All two group comparisons). CCL21 levels in bilateral iLN of Ccl3−/− hosts following induction of Td recall response and CCL3 administration. Mixed model accounting for within-mouse correlation of measurements, F-test, P < 0.001; Pairwise comparisons, WT Td + Td i.d. (n = 4 iLN) vs. Ccl3−/− Td + Td i.d. (n = 3 iLN), P = 0.045; Ccl3−/− Td + Td i.d. + CCL3 i.v. (n = 4 iLN) vs. Ccl3−/− Td + Td i.d. and vs. Ccl3−/− + CCL3 i.v. (n = 4 iLN), P = 0.0066 and P = 0.026, respectively. Scatter plot shows averaged values with n = 2 technical replicates performed per LN sampled.
Extended Data Table 1. Clinical trial patient characteristics.
Demographic and prognostics factors of newly-diagnosed GBM patients with vaccine site pre-conditioning randomization strategy and corresponding PFS and OS from the time of surgery and from randomization to preconditioning. Observed and predicted survival times are expressed in months. Median values are shown for Td and unpulsed DC cohorts. Predicted median OS for RPA Class yielded 17.9 months for Class III and 11.1 months for Class IV based on Curran et al. recursive partition analysis. Model 3 of the EORTC Scoring System that incorporated MGMT promoter methylation status, MMSE score, and WHO Performance Status was used to generate predicted median survival rates.
| Patient | Sex | Age | Biopsy location | Race | KPS | WHO score | MMSE | IDH1 | MGMT | MGMT promoter methylation | Vaccine site pre-conditioning | PFS (randomization) | OS (randomization) | PFS (diagnosis) | OS (diagnosis) | EORTC predicted median OS | EORTC O-E | RPA class | RPA O-E |
|---|---|---|---|---|---|---|---|---|---|---|---|---|---|---|---|---|---|---|---|
| 1 | F | 46 | R. frontal | W | 100 | 0 | 29 | − | N/A | N/A | Td | 8.8 | 19.2 | 15.4 | 25.7 | 26.8* | −1.1 | III | 7.8 |
| 2 | F | 32 | R. frontal | W | 100 | 0 | 29 | + | − | − | DC | 21.7 | 35.2 | 27.8 | 41.3 | 13.0¶ | 28.3¶ | III | 23.4 |
| 3 | M | 62 | R. temporal | W | 90 | 1 | 29 | − | − | − | DC | 4.9 | 10.9 | 11.2 | 17.3 | 9.8 | 7.5 | IV | 6.2 |
| 4 | M | 71 | L. frontoparietal | W | 90 | 1 | 30 | − | − | + | Td | 41.4 | 41.4 | 47.3† | 47.3‡ | 16.4 | 30.9 | IV | 36.2 |
| 5 | M | 43 | L. temporal | W | 90 | 1 | 28 | − | − | + | DC | 2.5 | 12.2 | 10.0 | 19.7 | 16.4 | 3.3 | III | 1.8 |
| 6 | F | 59 | R. temporal | W | 80 | 1 | 30 | − | − | − | Td | 39.5 | 39.5 | 45.0† | 45.0‡ | 9.8 | 35.2 | IV | 33.9 |
| 7 | M | 75 | R. temporal | B | 90 | 1 | 26 | − | + | + | Td | 9.5 | 14.7 | 15.4 | 20.6 | 11.8 | 8.8 | IV | 9.5 |
| 8 | F | 58 | L. parietal | H | 90 | 1 | 22 | − | + | N/A | DC | 2.5 | 13.4 | 9.1 | 20.0 | 13.1* | 6.9 | IV | 8.9 |
| 9 | F | 30 | R. temporal | W | 90 | 1 | 29 | N/A | + | N/A | Td | 36.6 | 36.6 | 44.1† | 44.1‡ | 21.3* | 22.8 | III | 26.2 |
| 10 | F | 66 | L. frontoparietal | W | 80 | 1 | 24 | − | + | − | DC | 3.9 | 9.5 | 10.4 | 16.0 | 6.9 | 9.1 | IV | 4.9 |
| 11 | F | 28 | L. frontotemporal | W | 100 | 0 | 28 | − | − | − | DC | 6.1 | 7.4 | 12.5 | 13.8 | 13.0 | 0.8 | III | −4.1 |
| 12 | M | 59 | R. posteroparietal | W | 90 | 1 | 29 | § | § | § | DC | § | § | 5.1 | 19.0 | 18.1* | 0.9 | IV | 7.9 |
| 13 | M | 71 | L. posterotemporal | W | 90 | 1 | 21 | − | + | + | Td | 12.7 | 15.2 | 18.5 | 20.9 | 11.8 | 9.1 | IV | 9.8 |
|
| |||||||||||||||||||
| Median DC | 58.5 | 90 | 1 | 28 | 4.4 | 11.6 | 10.8 | 18.5 | 13.0¶ | 6.9¶ | IV | 6.2 | |||||||
| Median Td | 65 | 90 | 1 | 29 | NE | NE | NE | NE | 14.1 | >16 | IV | >18 | |||||||
Model 2 of EORTC scoring system if methylation status unavailable
No progression
Alive
Patient progressed prior to time of randomization for vaccine site pre-conditioning
KPS, Karnofsky Performance Status; WHO, World Health Organization; MMSE, Mini-Mental State Examination, IDH1, isocitrate dehydrogenase type1; MGMT, O6-Methylguanine-DNA methyltransferase; PFS, progression-free survival; OS, overall survival; EORTC, European Organization for Research and Treatment of Cancer; O-E, observed – expected survival months; RPA, recursive partitioning analysis; NA, tissue not available; R., right; L., left; NE, not estimable.
Acknowledgments
The authors thank the staff who supported this study, including Robert Schmittling, Pamela Norberg, Weihua Xie, Denise Lally-Goss, Sharon McGehee-Norman, Beth Perry, Steven Snipes, and R. Edward Coleman. This work was supported by grants from the National Institutes of Health National Institute of Neurological Disorders and Stroke Specialized Program of Research Excellence in brain cancer (P50CA108786; D.D.B. and J.H.S.) and SRC on Primary and Metastatic Tumors of the CNS (P50-NS20023, D.D.B. and J.H.S.) as well as NIH RO1 (R01-CA177476-01, J.H.S.; R01-NS067037, D.A.M.), P01 (P01-CA154291-01A1, D.D.B. and J.H.S.), and P50 (P50-NS020023-30, D.D.B. and J.H.S.) funding sources. Additional support is from the National Brain Tumor Society (D.A.M. and J.H.S.), the American Brain Tumor Association (D.A.M. and J.H.S), Accelerate Brain Cancer Cure Foundation Young Investigator’s Award (D.A.M.), The Kinetics Foundation, (J.H.S) Ben and Catherine Ivy Foundation (J.H.S.), and in part by Duke University’s Clinical & Translational Science Awards grant 1UL2 RR024128-01 from the National Institutes of Health National Center for Research Resources.
Footnotes
The authors declare the following competing financial interests: D.A.M., K.A.B., and J.H.S. have filed provisional patents related to the use of Td pre-conditioning as a method to improve immunization efficacy. D.A.M. has served as a paid member of the Schering Plough North American Investigators Advisory Board. S.K.N. is a co-inventor on a patent that describes the use of DCs transfected with tumor antigen encoding RNA that has been licensed by Argos Therapeutics (Durham, NC) through Duke University. S.K.N. has no financial interests in Argos Therapeutics and is not compensated by Argos Therapeutics. D.A.R. has served as paid speaker for Schering/Merck and Genentech/Roche. The remaining authors declare no competing financial interests.
Author Contributions
D.A.M., G.E.A., and J.H.S. jointly conceived and implemented the clinical study; D.A.M. and K.A.B. jointly designed early DC migration studies in mice. K.A.B. conceived and designed the remainder of the murine research; A.D., A.H.F., H.S.F, R.E.M, D.A.R., J.J.V., D.D.B., and J.H.S. were responsible for provision of clinical study resources, materials, and patient access. S.K.N., E.R., and G.E.A. prepared human samples and conducted human in vitro experiments; K.A.B. performed all preclinical experiments and patient analyses; M.N.H. provided additional support for preclinical experiments. D.A.M., K.A.B., M.D.G., K.L.C., E.A.R., G.E.A., and J.H.S. performed data analysis and interpretation; J.E.H. and A.C. provided statistical support for design and analysis of human and murine studies. D.A.M., D.D.B., and J.H.S. contributed laboratory reagents and tools; and D.A.M., K.A.B., M.D.G., K.L.C., and J.H.S. wrote the paper. All authors gave their final approval to the manuscript.
References
- 1.Steinman RM, Banchereau J. Taking dendritic cells into medicine. Nature. 2007;449:419–426. doi: 10.1038/nature06175. [DOI] [PubMed] [Google Scholar]
- 2.Palucka AK, et al. Spontaneous proliferation and type 2 cytokine secretion by CD4+T cells in patients with metastatic melanoma vaccinated with antigen-pulsed dendritic cells. J Clin Immunol. 2005;25:288–295. doi: 10.1007/s10875-005-4089-z. [DOI] [PubMed] [Google Scholar]
- 3.Palucka AK, et al. Single injection of CD34+ progenitor-derived dendritic cell vaccine can lead to induction of T-cell immunity in patients with stage IV melanoma. J Immunother. 2003;26:432–439. doi: 10.1097/00002371-200309000-00006. [DOI] [PubMed] [Google Scholar]
- 4.Palucka AK, et al. Dendritic cells loaded with killed allogeneic melanoma cells can induce objective clinical responses and MART-1 specific CD8+ T-cell immunity. J Immunother. 2006;29:545–557. doi: 10.1097/01.cji.0000211309.90621.8b. [DOI] [PubMed] [Google Scholar]
- 5.Palucka K, Banchereau J. Cancer immunotherapy via dendritic cells. Nat Rev Cancer. 2012;12:265–277. doi: 10.1038/nrc3258. [DOI] [PMC free article] [PubMed] [Google Scholar]
- 6.Liau LM, et al. Dendritic cell vaccination in glioblastoma patients induces systemic and intracranial T-cell responses modulated by the local central nervous system tumor microenvironment. Clin Cancer Res. 2005;11:5515–5525. doi: 10.1158/1078-0432.CCR-05-0464. [DOI] [PubMed] [Google Scholar]
- 7.Yu JS, et al. Vaccination with tumor lysate-pulsed dendritic cells elicits antigen-specific, cytotoxic T-cells in patients with malignant glioma. Cancer Res. 2004;64:4973–4979. doi: 10.1158/0008-5472.CAN-03-3505. [DOI] [PubMed] [Google Scholar]
- 8.Martin-Fontecha A, et al. Regulation of dendritic cell migration to the draining lymph node: impact on T lymphocyte traffic and priming. J Exp Med. 2003 Aug;198:615–621. doi: 10.1084/jem.20030448. 2018. [DOI] [PMC free article] [PubMed] [Google Scholar]
- 9.Dziurzynski K, et al. Consensus on the role of human cytomegalovirus in glioblastoma. Neuro Oncol. 2012;14:246–255. doi: 10.1093/neuonc/nor227. [DOI] [PMC free article] [PubMed] [Google Scholar]
- 10.Ranganathan P, Clark PA, Kuo JS, Salamat MS, Kalejta RF. Significant association of multiple human cytomegalovirus genomic Loci with glioblastoma multiforme samples. J Virol. 2012;86:854–864. doi: 10.1128/JVI.06097-11. [DOI] [PMC free article] [PubMed] [Google Scholar]
- 11.Mitchell DA, et al. Sensitive detection of human cytomegalovirus in tumors and peripheral blood of patients diagnosed with glioblastoma. Neuro Oncol. 2008;10:10–18. doi: 10.1215/15228517-2007-035. [DOI] [PMC free article] [PubMed] [Google Scholar]
- 12.Cobbs CS, et al. Human cytomegalovirus infection and expression in human malignant glioma. Cancer Res. 2002;62:3347–3350. [PubMed] [Google Scholar]
- 13.Myers MG, Beckman CW, Vosdingh RA, Hankins WA. Primary immunization with tetanus and diphtheria toxoids. Reaction rates and immunogenicity in older children and adults. JAMA. 1982;248:2478–2480. [PubMed] [Google Scholar]
- 14.Stupp R, et al. Radiotherapy plus Concomitant and Adjuvant Temozolomide for Glioblastoma. N Engl J Med. 2005;352:987–996. doi: 10.1056/NEJMoa043330. [DOI] [PubMed] [Google Scholar]
- 15.Curran WJ, Jr, et al. J Natl Cancer Inst. 1993;85:704–710. doi: 10.1093/jnci/85.9.704. [DOI] [PubMed] [Google Scholar]
- 16.Gorlia T, et al. Nomograms for predicting survival of patients with newly diagnosed glioblastoma: prognostic factor analysis of EORTC and NCIC trial 26981-22981/CE.3. Lancet Oncol. 2008;9:29–38. doi: 10.1016/S1470-2045(07)70384-4. [DOI] [PubMed] [Google Scholar]
- 17.Nakano H, Gunn MD. Gene duplications at the chemokine locus on mouse chromosome 4: multiple strain-specific haplotypes and the deletion of secondary lymphoid-organ chemokine and EBI-1 ligand chemokine genes in the plt mutation. J Immunol. 2001;166:361–369. doi: 10.4049/jimmunol.166.1.361. [DOI] [PubMed] [Google Scholar]
- 18.Zhang Y, et al. Mobilization of dendritic cell precursors into the circulation by administration of MIP-1alpha in mice. J Natl Cancer Inst. 2004;96:201–209. doi: 10.1093/jnci/djh024. [DOI] [PubMed] [Google Scholar]
- 19.He S, et al. MIP-3alpha and MIP-1alpha rapidly mobilize dendritic cell precursors into the peripheral blood. J Leukoc Biol. 2008;84:1549–1556. doi: 10.1189/jlb.0708420. [DOI] [PMC free article] [PubMed] [Google Scholar]
- 20.Castellino F, et al. Chemokines enhance immunity by guiding naive CD8+ T cells to sites of CD4+ T cell-dendritic cell interaction. Nature. 2006;440:890–895. doi: 10.1038/nature04651. [DOI] [PubMed] [Google Scholar]
- 21.McLendon RE, et al. Immunohistochemical detection of the DNA repair enzyme O6-methylguanine-DNA methyltransferase in formalin-fixed, paraffin-embedded astrocytomas. Lab Invest. 1998;78:643–644. [PubMed] [Google Scholar]
- 22.Romani N, et al. Proliferating dendritic cell progenitors in human blood. J Exp Med. 1994;180:83–93. doi: 10.1084/jem.180.1.83. [DOI] [PMC free article] [PubMed] [Google Scholar]
- 23.Nair S, Archer GE, Tedder TF. Isolation and generation of human dendritic cells. Current Protocols in Immunology. 2012;99:1–23. doi: 10.1002/0471142735.im0732s99. [DOI] [PMC free article] [PubMed] [Google Scholar]
- 24.Thurner B, et al. Generation of large numbers of fully mature and stable dendritic cells from leukapheresis products for clinical application. J Immunol Methods. 1999;223:1–15. doi: 10.1016/s0022-1759(98)00208-7. [DOI] [PubMed] [Google Scholar]
- 25.Therasse P, et al. New guidelines to evaluate the response to treatment in solid tumors. European Organization for Research and Treatment of Cancer, National Cancer Institute of the United States, National Cancer Institute of Canada. J Natl Cancer Inst. 2000;92:205–216. doi: 10.1093/jnci/92.3.205. [DOI] [PubMed] [Google Scholar]
- 26.Nakano H, et al. Blood-derived inflammatory dendritic cells in lymph nodes stimulate acute T helper type 1 immune responses. Nat Immunol. 2009;10:394–402. doi: 10.1038/ni.1707. [DOI] [PMC free article] [PubMed] [Google Scholar]
- 27.Sanchez-Perez L, et al. Potent selection of antigen loss variants of B16 melanoma following inflammatory killing of melanocytes in vivo. Cancer Res. 2005;65:2009–2017. doi: 10.1158/0008-5472.CAN-04-3216. [DOI] [PubMed] [Google Scholar]
- 28.Daniels GA, et al. A simple method to cure established tumors by inflammatory killing of normal cells. Nat Biotechnol. 2004;22:1125–1132. doi: 10.1038/nbt1007. [DOI] [PubMed] [Google Scholar]
- 29.Fidler IJ. Biological behavior of malignant melanoma cells correlated to their survival in vivo. Cancer Res. 1975;35:218–224. [PubMed] [Google Scholar]