
FIG. 5.
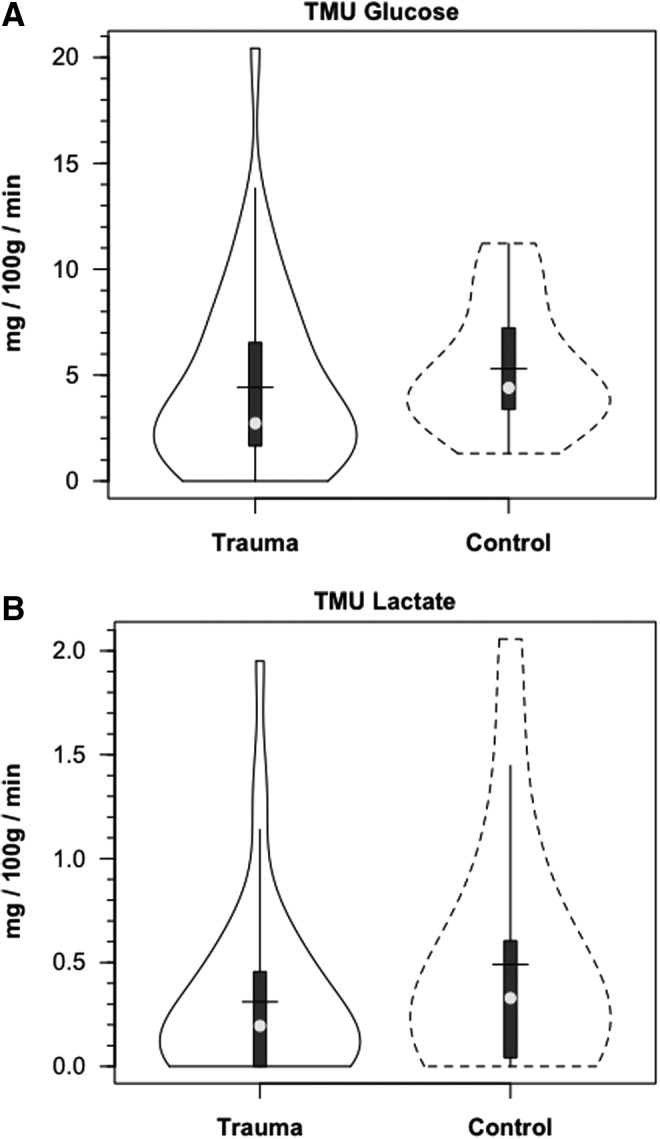
Violin plots of tracer-measured glucose (A) and lactate uptake (B). Solid lines represent traumatic brain injury (TBI) patients (n=12) whereas dashed lines are normal control subjects (n=6).
Official websites use .gov
A
.gov website belongs to an official
government organization in the United States.
Secure .gov websites use HTTPS
A lock (
) or https:// means you've safely
connected to the .gov website. Share sensitive
information only on official, secure websites.
Violin plots of tracer-measured glucose (A) and lactate uptake (B). Solid lines represent traumatic brain injury (TBI) patients (n=12) whereas dashed lines are normal control subjects (n=6).