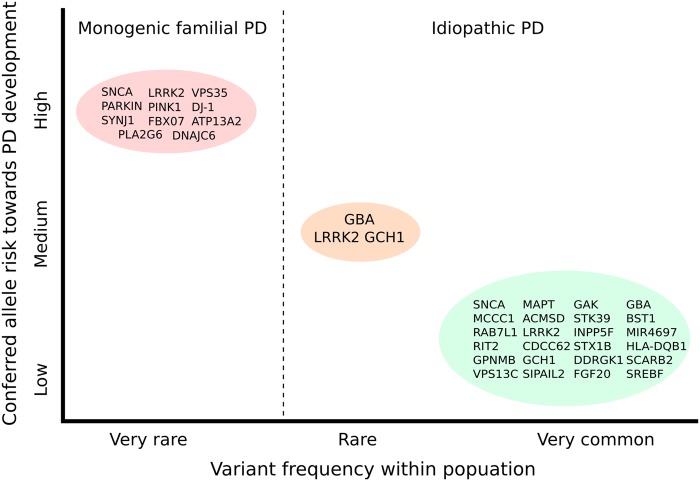
Figure 1.
Schematic overview of frequency and conferred risk of genes and genetic loci associated with the development of familial and idiopathic PD/parkinsonism. Genes listed in the red circle represent those identified through analysis of familial cases and give rise to monogenic forms of PD. The green circle contains genes in loci nominated as risk factors for idiopathic PD following meta-analysis of all European GWAS data sets. Lastly, the orange circle highlights a number of high-risk variants with reported odds ratios of >5. Adapted from (131).

