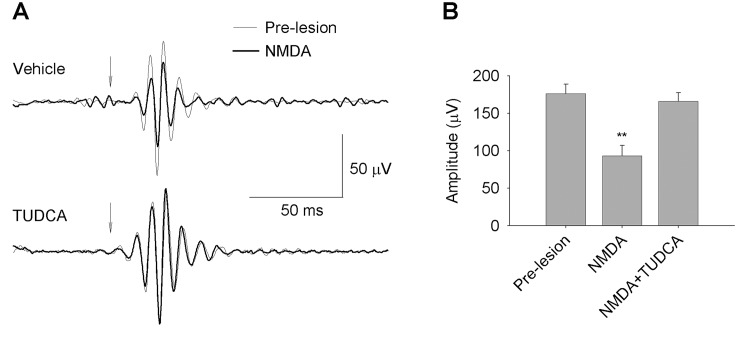
Fig 3. Effect of NMDA and TUDCA on the ERG OPs.
(A) Representative examples of filtered OP traces from scotopic ERGs recorded before (thin traces) and after (bold traces) NMDA-induced retinal damage, in vehicle- (upper graph) or TUDCA-treated (lower graph) rats, in response to a 1 cd·s/m2 stimulus (arrow). (B) Amplitude (mean ± SEM) of maximum OPs before retinal damage (pre-lesion, n = 11), and after NMDA-induced lesion in rats either treated with vehicle (NMDA, n = 5) or TUDCA (NMDA+TUDCA, n = 6). Asterisks indicate statistical significance (ANOVA, Bonferroni’s test) for pre-lesion vs. NMDA, and NMDA vs. NMDA+TUDCA groups, **P<0.01. No significant differences were found when comparing pre-lesion vs. NMDA+TUDCA groups.

